MANA/USDT looking interestingHey Traders!
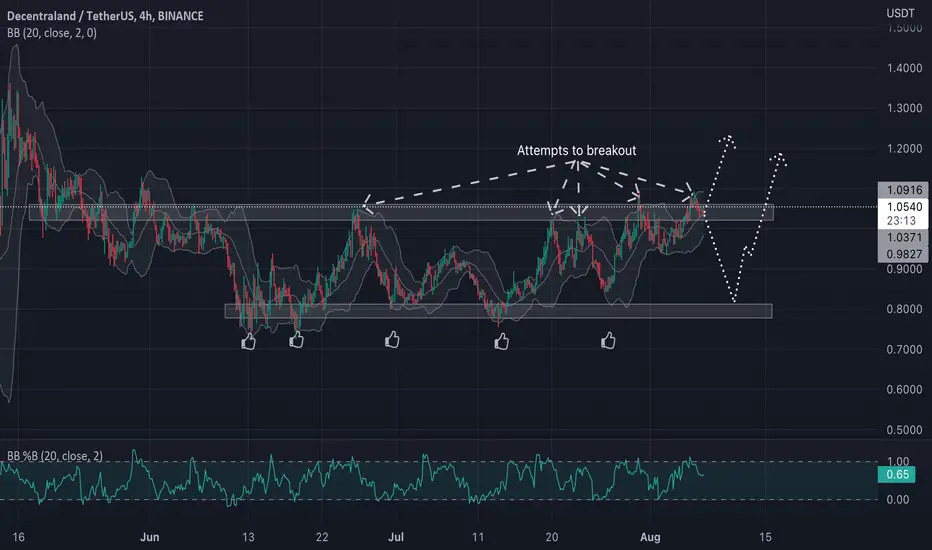
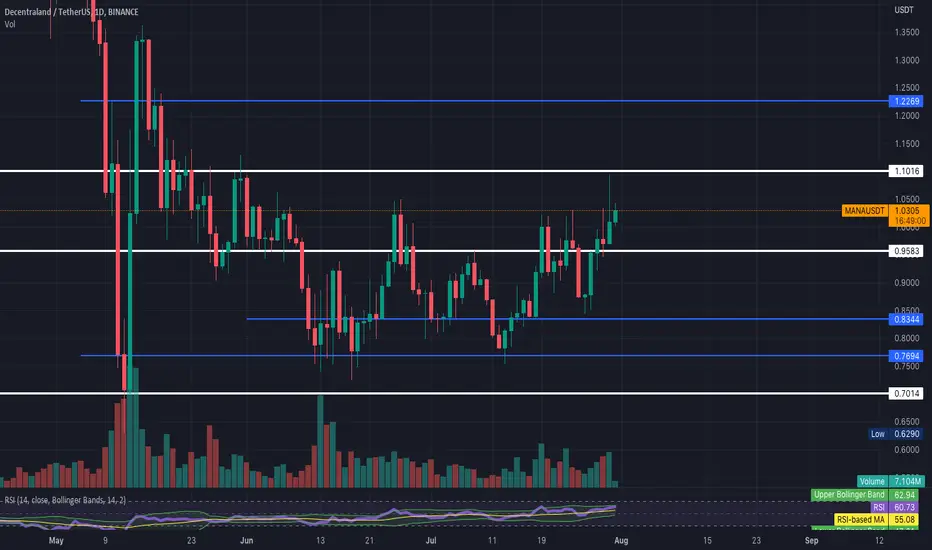
We are back with MANA coin. Long time we haven't talked about this one huh.... So we have seen for the past weeks 5 different attempts to breakout from that sideways path which we pointed out on our chart. Will bulls go for the sixth try to breakout? well we cant say anything for sure but we think that MANA will probably hold the resistance and go for the $0.081 zone.
But holding the $1 zone would mean going for a bull run!
If you like ideas provided by our team you can show us your support by liking and commenting.
Yours Sincerely,
Swallow Team 🔱
Disclamer:
We are not financial advisors. The content that we share on this website are for educational purposes and are our own personal opinions.
MANAUSDT_0BF6D9 trade ideas
MANA- Market is weak, we need to HedgeMANA is my selected Short for the day.
Close to 1.0860 Resistance it's ideal (to me) for a short position with SL over 1.10
At the same time check my previous posts/ideas for my other set-ups and most importantly look at this:
Mondays are Red🩸 Ends are Weak💤 Yet we Rise✔️
We might as well have patience and yes: the market will most likely continue to rise but not on a straight line.
DYOR and learn how to trade: it does pay out eventually.
One Love,
The FXPROFESSOR

MANA\USDT 📐ASCENDING TRIANGLE📐🇺🇸Hello friends👋.
📈Long: 5-10% of deposit (pending order at $1.0248)
🔴SL:0.9192$
🟢TP: 1.3302$
Another squeeze in the form of an Ascending Triangle, the price broke through the upper border of the triangle and fixed, I expect a retest and then a long!📈

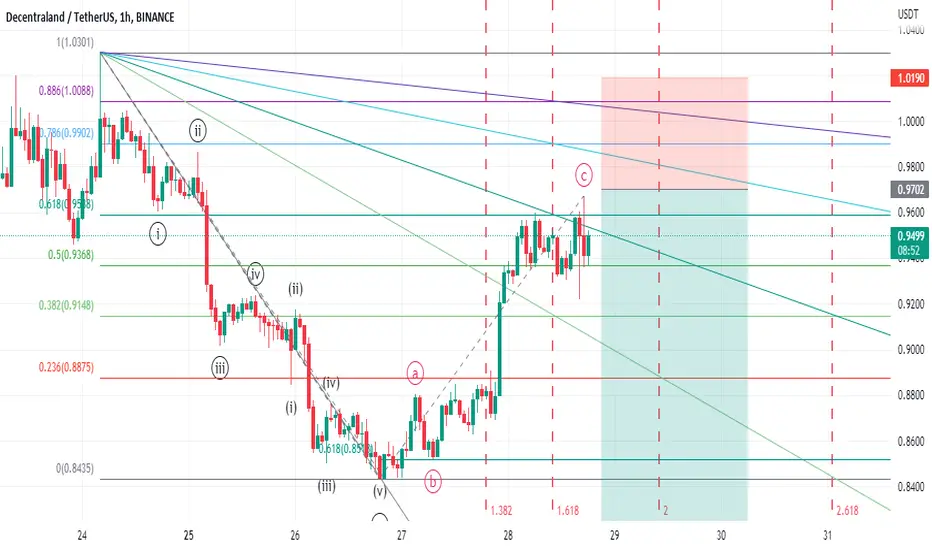
MANAUSDT AB=CDAB=CD
The AB=CD pattern is easy to identify on charts and consists of 2 equivalent price legs. It has specific Fibonacci measurements of each point within its structure, eliminating room for flexible interpretation. The C point must retrace to either a 0.618 or 0.786 and the BC projection is either 1.27 or 1.618. When the BC projection and the AB=CD completion converge closely and define a small area, the chance of a reversal increases.
The first target would be the 382 retracement of AD and the second target the 618 retracement of AD. A common stop level is behind a structure level beyond the D point. Conservative traders may look for additional confirmation before entering a trade, for instance an aligning RSI value or a specific candlestick pointing at a reversal. TradingView has a smart ABCD Pattern drawing tool that allows users to visually identify this pattern on a chart. There are several variations, based on CD being an extension of AB such as the 1.27 AB=CD or the 1.618 AB=CD pattern.

Adam & Eve Forming?Potential adam and eve bottom forming for MANA. Small ascending triangle may give Mana a small push up again before retracing back down, hopefully holding the parabola forming the adam and eve. Who knows.
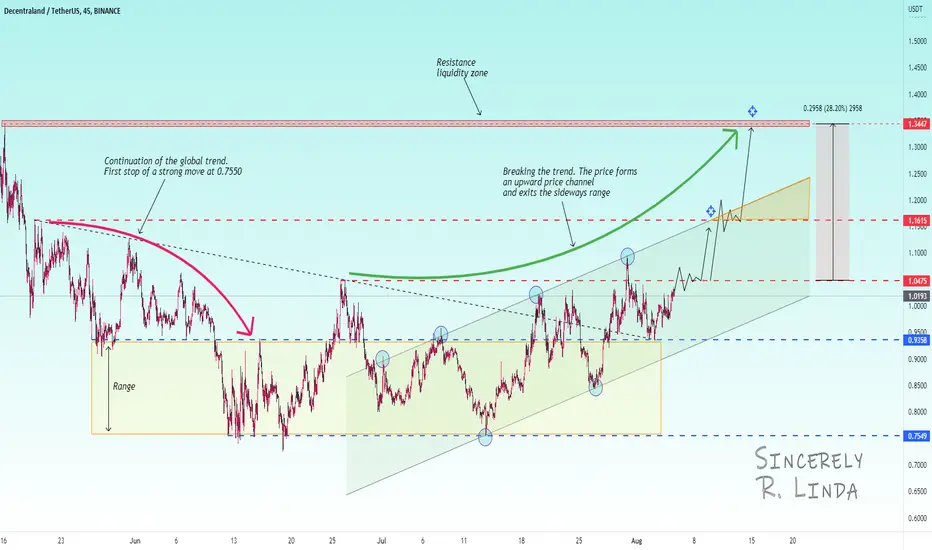
MANAUSDT ! Retest resistance. Ascending channel. What's next?🤔MANAUSDT forms a breakout of the trading range after repeatedly testing the upper boundary at 0.9358.
On the chart, I have marked the price movement as from 0.7550, the price forms an upward price channel and is momentarily testing the resistance at 1.0475.
I assume as the price comes back to retest this level, there is a good chance that the price could break it. The local trend is uptrending and the trend change was confirmed earlier. Key targets: the short-term target is the resistance at 1.1615, the medium-term target is the resistance at 1.3447
Regards R.Linda!
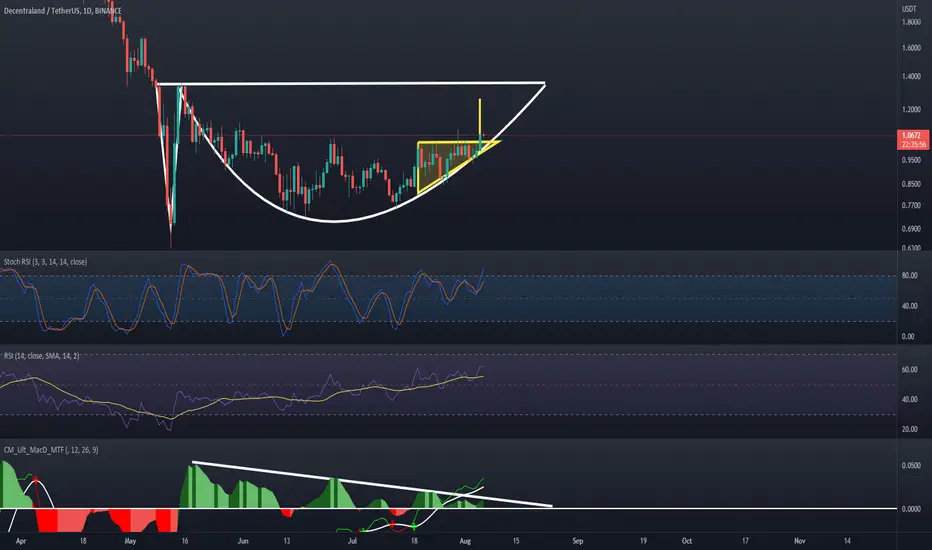
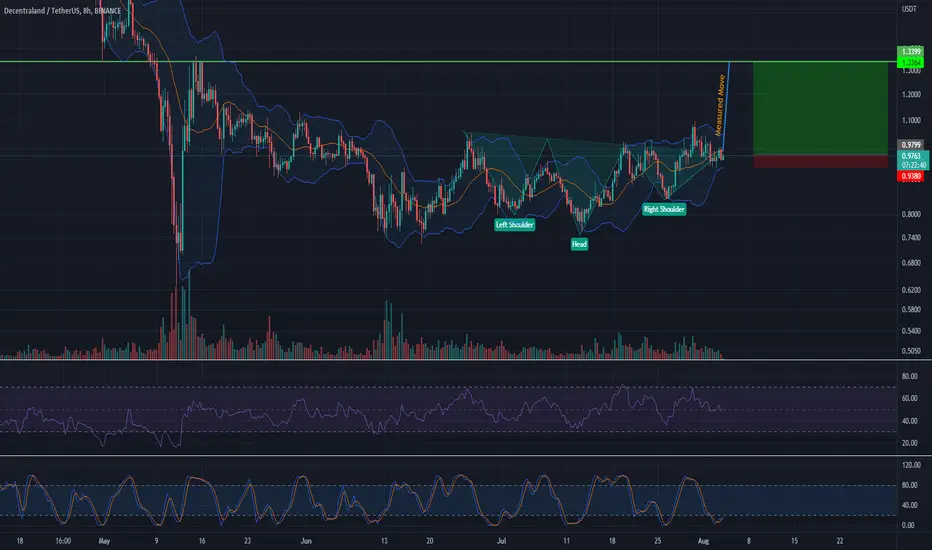
MANA Breakout of Inverse Head and Shoulders to 1.33 Area?MANA has been building market structure during the consolidation over the last 2 months and looks ready to breakout with the Stochastics reset on the 8h timeframe. A number of coins have had these breakouts but MANA finally looks ready for potential 36% swing on this trade. Not financial advice, DYOR.
MANAUSDT Price Update | TAHi, Please like and follow if you agree.
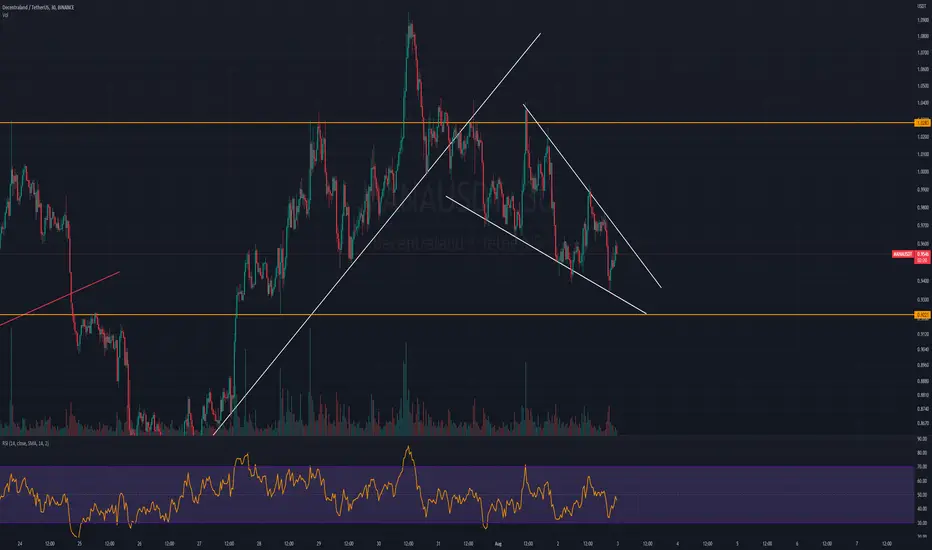
Mana is forming a falling wedge right now on 30 minutes time frame as it's a bullish pattern we can see some moves to the upside for MANAUSDT. best entry 0.9220.
MANA about to fall down!MANA/USDT Looks like a doing an ascending channel to continue pushing to the downside. And if it breaks out that ascending channel with strong impulse movement, it will do the correction movement. After that correction movement, if it breaks out, it will continue falling down to the next impulse movement.

MANAUSDT Short Term Price ForecastLooking at the Rounding Bottom Pattern smoothly drawn in the Price Action of MANAUSDT in the 4h TF, we are likely goin to see a Rally Upward (Considered that BTC Play the Bullish Scenario).
In an other angle looking at the Visible Range Volume Profile Indicator (VRVP) We can notice the concentrated POC (Point of Control) Stressing out to the Major Lower Ascending Resistance Line.
We Watch Out For The Two Directions and Get in After we Confirm one of them.


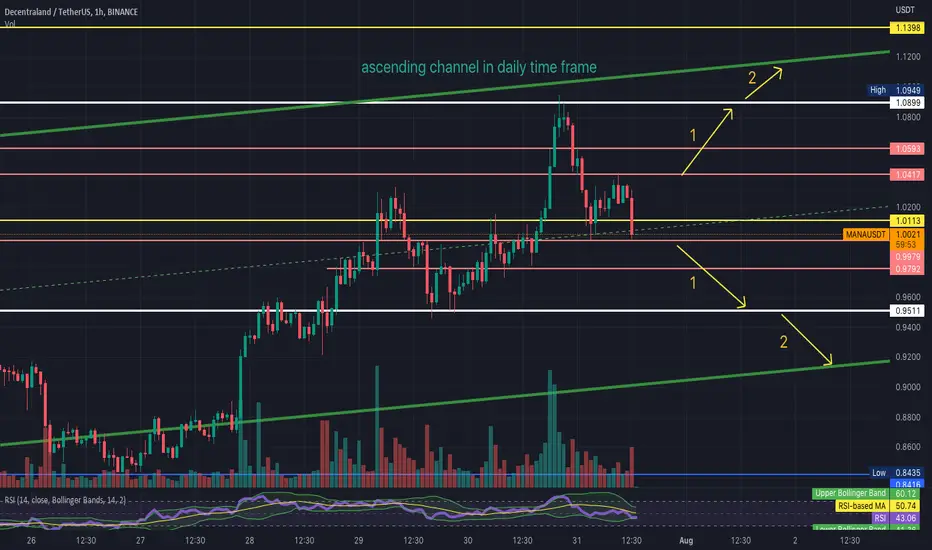
mana / usdt - ascending channel hi analys mana/usdt 1h time frame - ascending channel daily time frame - the range of 1.0113 to 0.9979 no trade zones
mana usdt - daily time frame - channelhi analys mana/usdt - daily time frame - (channel mana/ usdt daily)

mana / usdt - 4h - 1h - 15 min time frameHi mana / usdt - 4h , 1h , 15 min time frame (the second analysis)

mana / usdthi analys mana/usdt - monthly - week - daily time frame - ( my first analysis ) - next 4h and 1h

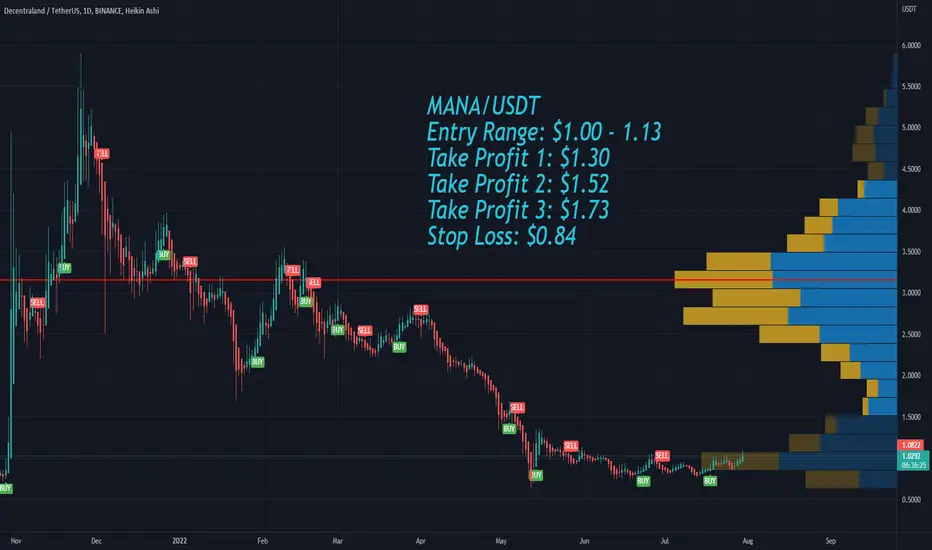
Decentraland MANA long Entry Range, Take Profit and Stop LossMANA/USDT
Entry Range: $1.00 - 1.13
Take Profit 1: $1.30
Take Profit 2: $1.52
Take Profit 3: $1.73
Stop Loss: $0.84
MANA sell signal
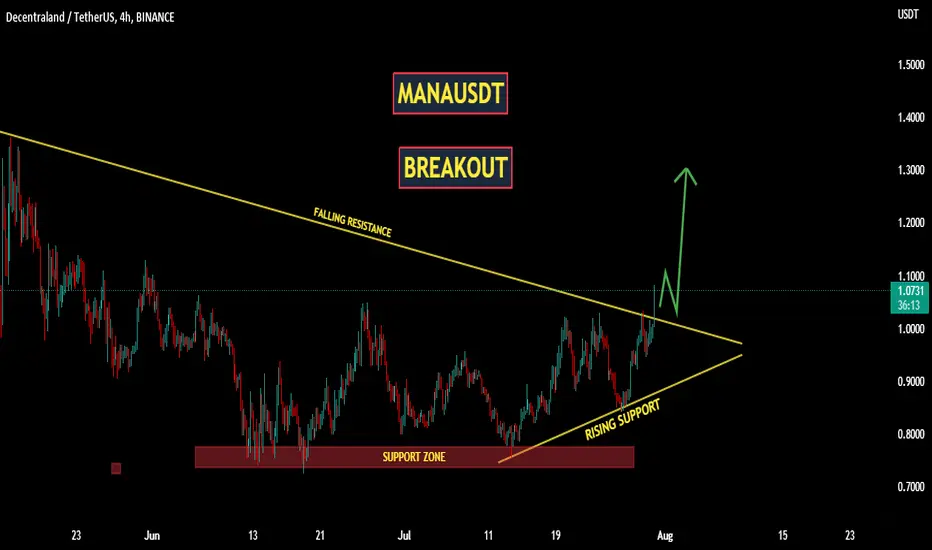
MANAUSDT | BREAKOUTMANAUSDT for a long time was trading below the falling resistance. The price has honored the horizontal support many times. Now the price has broken above the falling resistance. One can enter long in this trade While stop loss should be on 0.95.If price break below the trendline the break out will be turned into a fake out.
Manage your levels accordingly.
MANA / USDT Support & Resistances Daily Technical Outlook with possible short term trading targets- 29.07.2022
⛔️Note: Please watch Pro-Technical video on Cryptosocy platform first

MANA we should take long at $0.98 because of big size🚨MANA we should take long at $0.98 because of big size
If that size can push price higher - above key level that could start local pump

DECENTRALAND (MANAUSDT) close to the round number ✔️Hello 🐋
Based on the chart, the price is close to the major support (bottom) or better to say the previous zone that started its amazing pump to the upside and the round number $1 resistance that many times stop the price from more gain ✔️
if
the price breaks the round number to the upside, we will see more gain beside the range market is an acceptable scenario too 📖💡🚀
and
if the price breaks the range area to the upside, we will see more gain 🚀
Please, feel free to share your point of view, write it in the comments below, thanks 🐋

Short Manafirst of all, if you enjoy what you see I'd appreciate it if you hit the like button. I found this Elliott EOW2 ( End of wave 2 ) setup again. the correction part is arguable but the motive wave has been strong and the price is in the fib time zone of the motive wave. so I expect another down move. EZ.