DOLLAR INDEX DXYThe U.S. Dollar Index (DXY) is a measure of the value of the United States dollar (USD) relative to a basket of six major foreign currencies. It reflects how strong or weak the dollar is compared to these currencies collectively. The index was created by the Federal Reserve in 1973
The six currencies included in the basket and their approximate weightings are:
Euro (EUR): 57.6%
Japanese Yen (JPY): 13.6%
British Pound Sterling (GBP): 11.9%
Canadian Dollar (CAD): 9.1%
Swedish Krona (SEK): 4.2%
Swiss Franc (CHF): 3.6%
The DXY is calculated as a weighted geometric average of the dollar's exchange rates against these currencies. When the dollar strengthens against this basket, the index rises; when it weakens, the index falls.
The index is widely used by traders, investors, and economists to gauge the overall strength of the U.S. dollar in global currency markets and to inform trading and economic decisions.
In essence, the Dollar Index provides a standardized barometer of the U.S. dollar's value against its major international trading partners' currencies.
The U.S. Dollar Index (DXY) is trading near 98.684 of August 1, Friday market close.
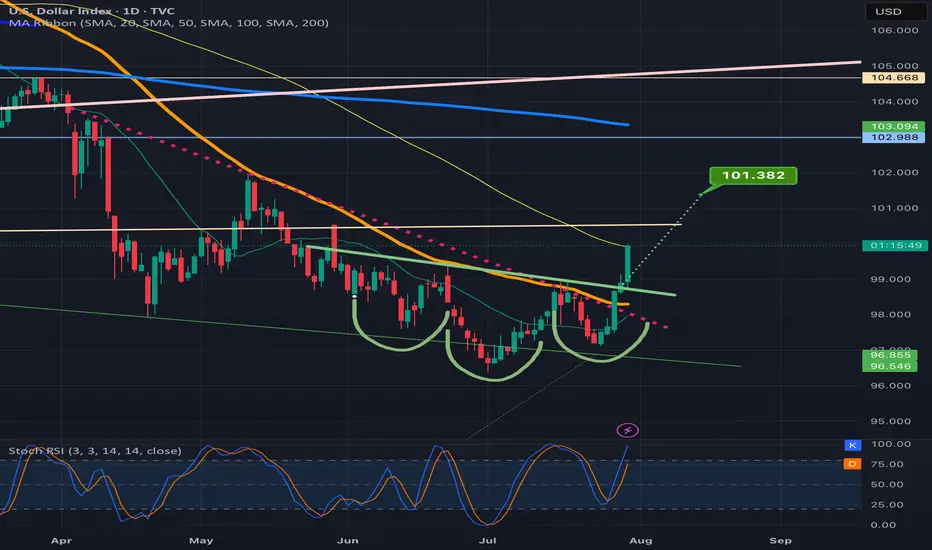
July saw the DXY record its first monthly gain in 2025 (rising nearly 1%) as a a result of the demand floor on ascending trendline acting as dynamic support .but selling has resumed at the start of August on ADP data report, the current supply roof presents resistance to upswing capping gains on economic outlook and immigration enforcement concern.
Key Fundamental Drivers (August 2025):
Fed Policy & Inflation: The Federal Reserve kept rates steady at 4.25–4.50% in July, but persistent inflation (core PCE up to 2.8% YoY in June) and the impact of new U.S. tariffs are keeping rate cuts on hold for now.
Tariffs & Trade Policy: Fresh, globally-applied U.S. tariffs announced at the end of July have heightened risk aversion, helped the dollar find support, and stirred inflation concerns—as import price increases feed into core inflation data.
Interest Rate Differentials: While the Fed holds rates high, other central banks (especially the ECB and BOE) are signaling further easing. The resulting policy divergence still gives the dollar some support, but large inflows into alternative markets (e.g., eurozone equities, gold, yen) have also pressured the greenback.
Safe-Haven Flows: Risk-off sentiment amid trade tension and global policy uncertainty continues to prompt investors to seek the relative safety of the dollar, limiting its downside.
Composition: The DXY measures the value of USD relative to a basket of currencies: euro (57.6%), yen (13.6%), pound (11.9%), Canadian dollar (9.1%), Swedish krona (4.2%), and Swiss franc (3.6%).
The path ahead depends on upcoming U.S. inflation prints, additional Fed commentary, and how global markets react to ongoing trade disputes and central bank moves.
Longer term,
The DXY remains under pressure at the start of August 2025 but is showing tentative signs of stabilization just below the key 100 mark. The trend will hinge on Fed policy, global inflation data, and the impact of new tariffs on both inflation and global risk appetite. If buying breaks and close above weekly resistance roof then 104-103 can be reclaimed.
trading is 100% probability ,manage your risk and know that any key level can fail.
#dollar #dxy #money #eurusd #gbpusd #audusd #usdjpy
DOLLARINDEX trade ideas

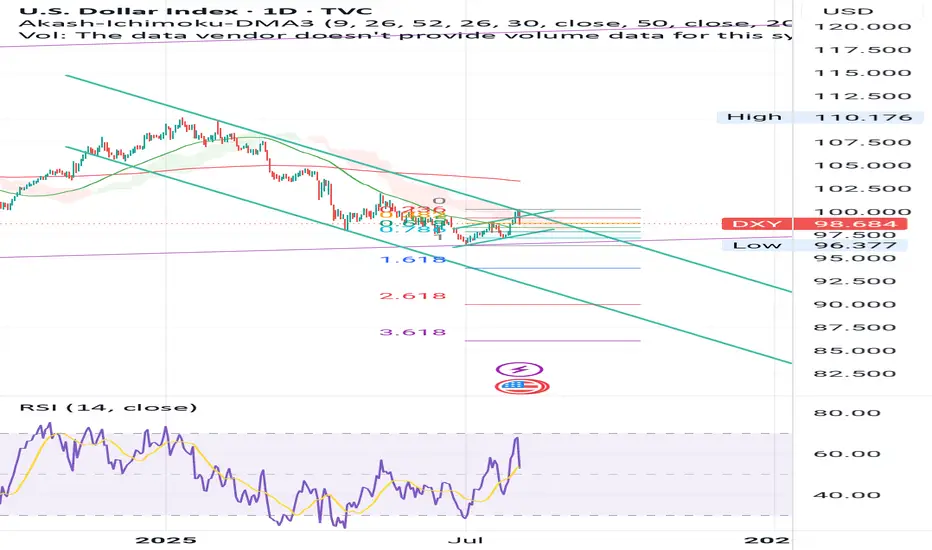
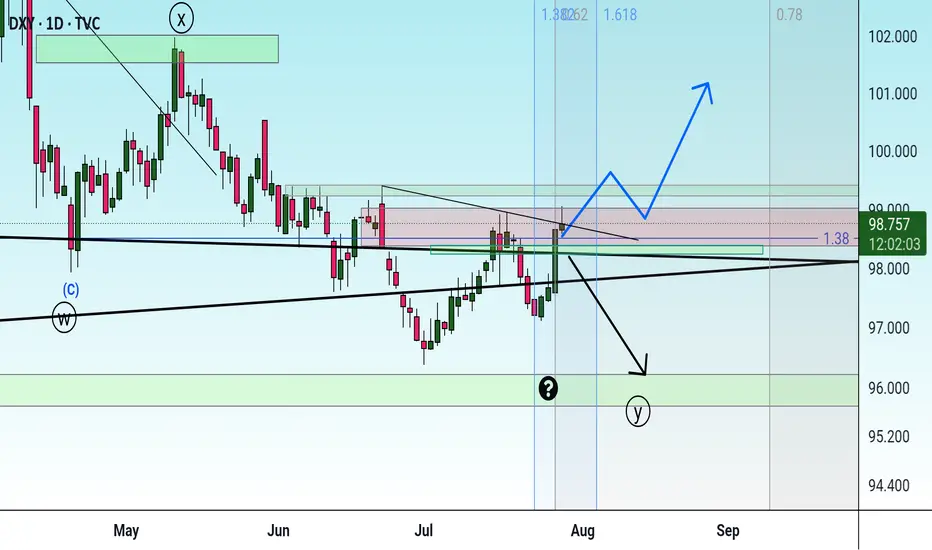
DXY POTENTIAL SCENARIO two possible scenarios for DXY in next coming weeks , watch the support and wait for confirmation before buying Dollar ,

DXY continued downside, next stop 90Perfect parallel channel + Fib 2.618 intersection
Gl
Not financial advice
Dollar Index in Danger: Patterns Point to More DownsideThe dollar index (DXY) is flashing serious warning signs. In this video, I break down the technical evidence behind my bearish outlook on both the monthly and daily charts. The head and shoulders pattern we spotted did work it's way to breaking the neckline BUT the target will Not be achieved as the data on the charts have changed. On the daily charts we have a strong bearish engulfing candle, there is also an RSI divergence in the overbought zone, stochastic indicator has turn down and momentum is also following along. The downtrend on the monthly timeframe has not formed any divergence yet so I expect price to fall below the previous month's low in the coming weeks.
There will be bounces from support zones on the daily and 4 hours, these will be opportunities for good entries.
If you’re holding USD or trading around it, this is a must-watch. The signals are clear—are you prepared?
Cheers and I wish everyone a profitable trade in the coming week.

The strength of the PMI reportWe all saw how a large and strong candle formed right after the news, hitting the top of the previous channel.
So now that channel top zone has proven to be valid.
Now we have to see whether this candle leads to another drop in the dollar, or if the dollar recovers and slowly starts moving back toward 100.
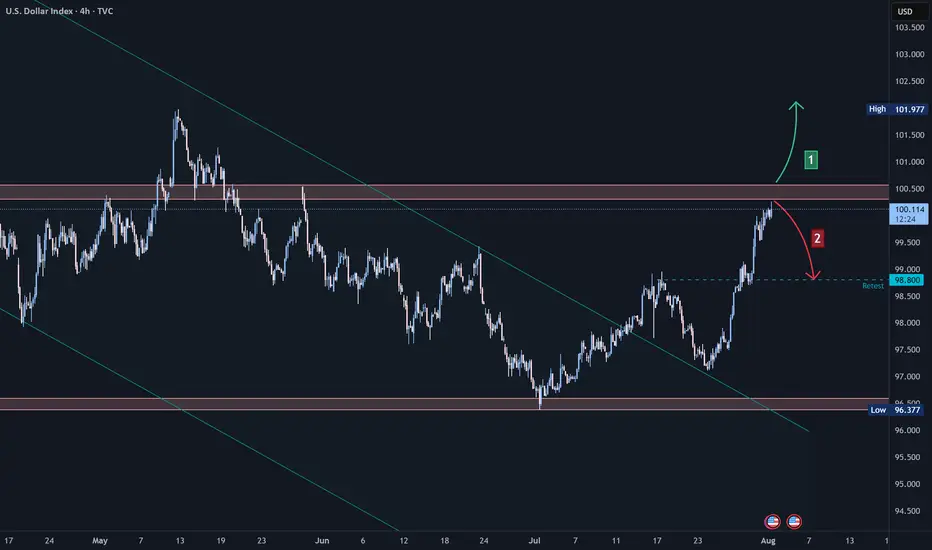
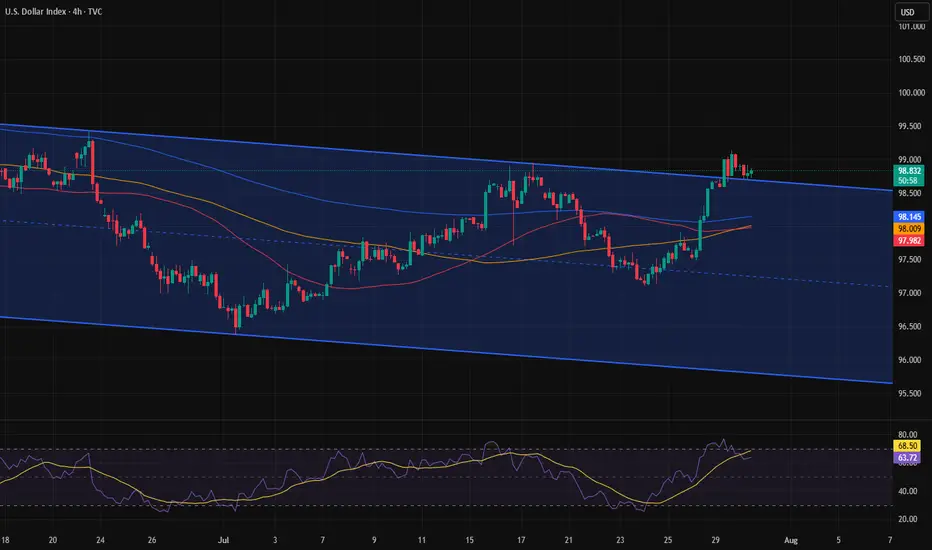
US Dollar Index (DXY) Technical Analysis:The DXY has recently exited a bearish wave, retested support levels, and began a recovery — currently trading near 100.09, a key resistance area.
🔹 If price breaks and holds above 100.09, the upward move may continue toward the 102.00 zone.
🔹 However, if the index rejects this level and reverses, a retest of 98.80 could follow.
⚠️ Disclaimer:
This analysis is for educational purposes only and does not constitute financial advice. Always perform your own analysis and monitor the markets before making any investment decisions.
DXY attempting an inverse H&S breakoutSeeing a big green candle today on dxy after confirming the neckline of the inverse head and shoulders pattern as support on the previous daily candle.
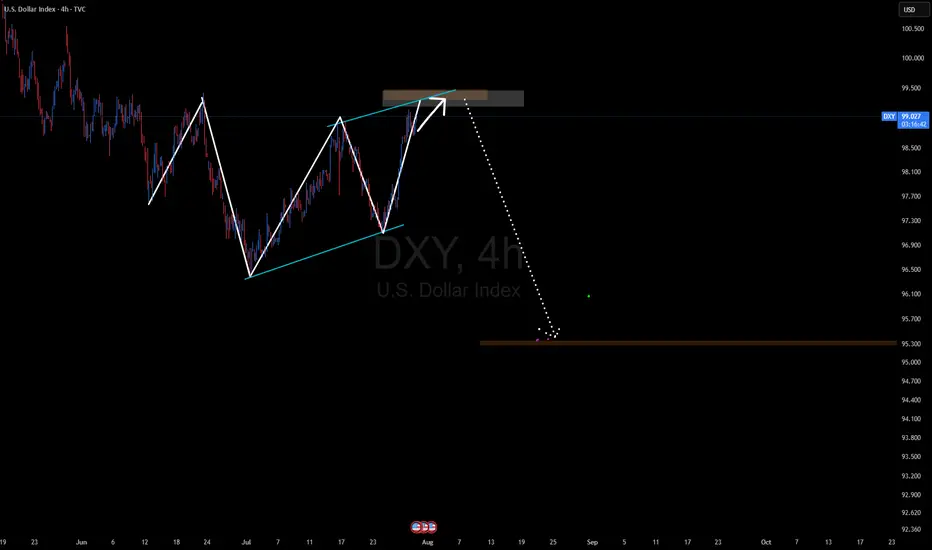
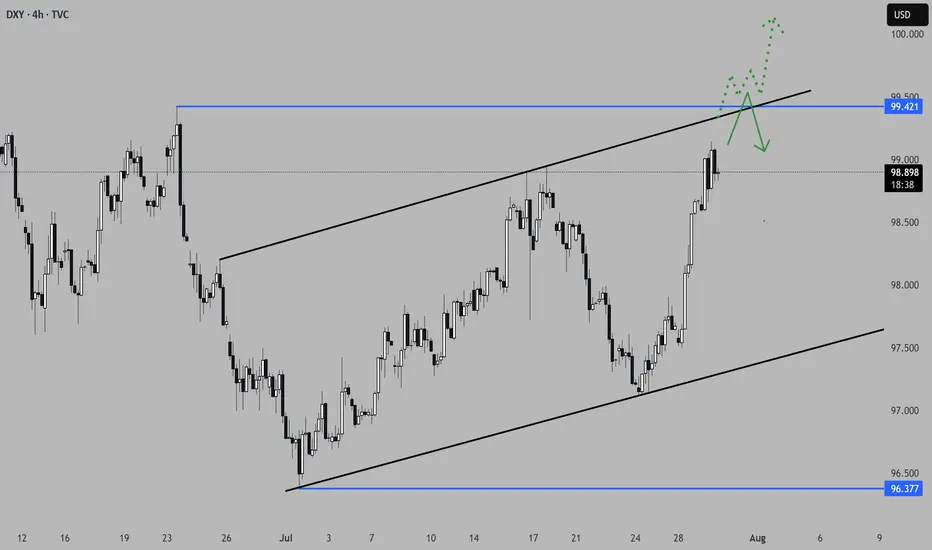
DXY BEARISH TREND 30-JUL 15-JUN 2025There are some major upcoming events that could significantly impact the US dollar index (DXY), including the ADP Non-Farm Employment Change and the Federal Funds Rate decision. Because of this, I expect the DXY to continue its downward movement until it reaches around 94.5. If it breaks below that level, it’s also possible that it could drop further and reach 89.00.
Currently, the DXY is expected to start its move downward from the 99.20–99.50 range, making a decline from that level quite likely
Just a bounce off or a real trend reversal?DXY sits on a major support zone. Price often delivers a reflex bounce at strong levels before continuing the prevailing trend, so a quick pop isn’t proof of a new bull run. DXY is closely linked to US real yields (10y TIPS): if real yields roll over as the Fed eases, USD strength likely fades; if real yields stay firm, a durable reversal is more plausible.
This post is for informational/educational purposes only and is not investment advice or a solicitation to buy/sell any security. Past performance is not indicative of future results. I may hold positions related to the instruments mentioned.

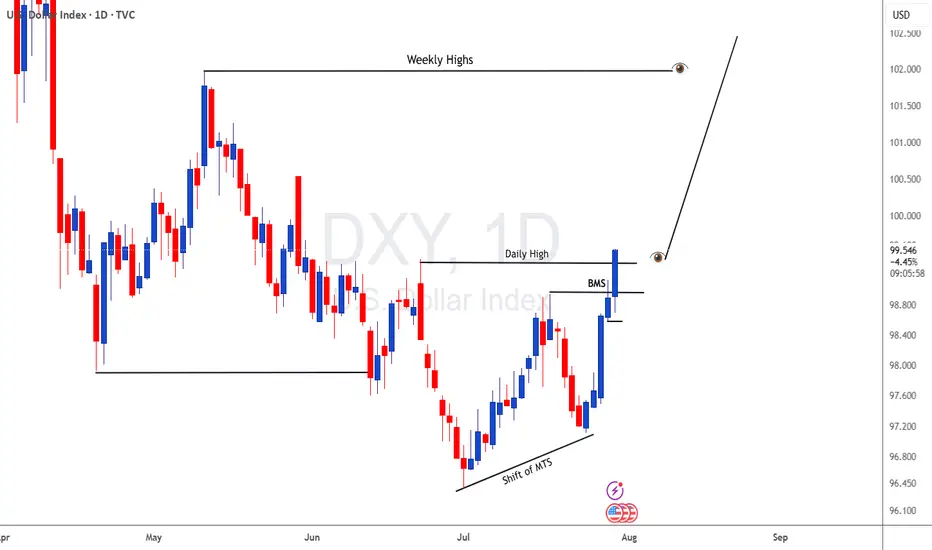
DXY UPDATE FOR LONG as we forecast a long term this an update
The dollar index (DXY00) on Tuesday rose by +0.22% and posted a 5-week high. The dollar has carryover support from Monday following the EU-US trade deal that is seen as favoring the US. Also, expectations for the Fed to keep interest rates unchanged at the end of Wednesday's 2-day FOMC meeting are supportive of the dollar. The dollar extended its gains after the US Jun advance goods trade deficit unexpectedly shrank, a supportive factor for Q2 GDP, and after July consumer confidence rose more than expected.
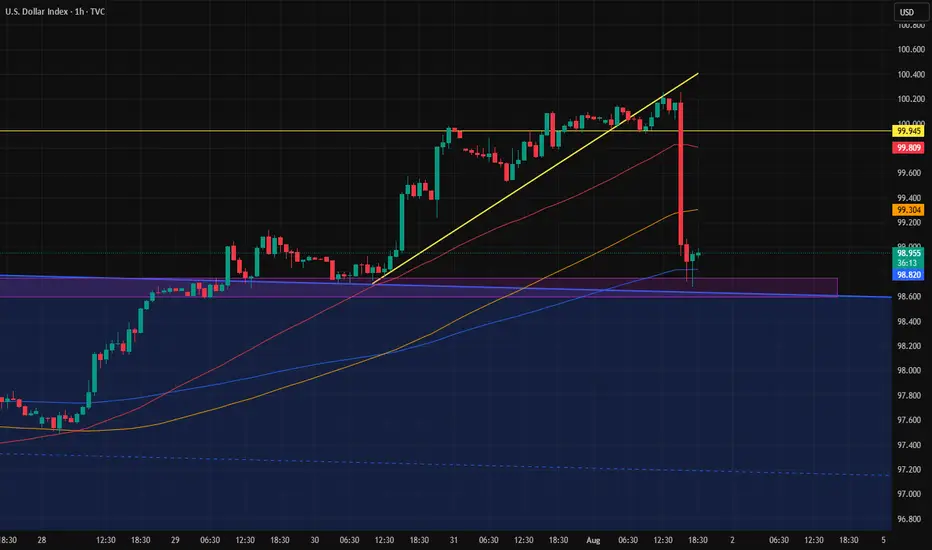
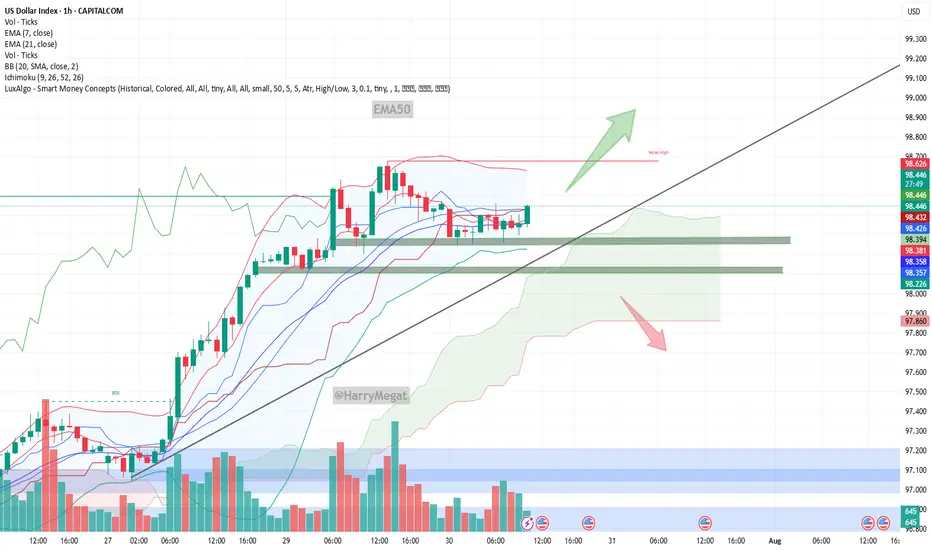
US Dollar Index (DXY) Chart Analysis – 1H TimeframeUS Dollar Index (DXY) Chart Analysis – 1H Timeframe
This chart shows the **US Dollar Index (DXY)** with key price zones, trendlines, and EMA indicators. Here's a detailed analysis:
**Key Observations:**
* **Price:** Currently trading near **98.41**
* **EMAs:**
* **EMA 7** = 98.373 (short-term trend)
* **EMA 21** = 98.356 (medium-term trend)
* **Trendline:** Uptrend line still intact, acting as dynamic support
* **Volume:** Steady, no strong breakout yet
* **Support Zones:** 98.20 – 98.35
* **Price Structure:** Consolidating above support and EMAs after a pullback from highs
**Bullish Scenario**
* If price **holds above EMAs and the green support zone (98.20–98.35)**
* **Breakout above 98.50** would confirm strength
* Targets:
→ **98.70**
→ **99.00+** if trendline support continues to hold
* EMAs are aligned bullishly (7 above 21) – good sign for continued upward trend
**Bearish Scenario**
* If price **breaks below 98.20 and closes under the trendline**
* Watch for rejection near 98.50 followed by strong red candle
* Downside targets:
→ **97.80**
→ **97.60**
* A breakdown below the ascending trendline = trend shift confirmation
**Conclusion**
* **Bias:** Bullish as long as DXY stays above 98.20 and trendline
* **Invalidation:** A break and close below 98.20 + trendline = bearish shift
Correction and rise, or drop?Today, with the first news release, we'll see whether the Dollar Index is making a correction before continuing upward, or if it's going to drop and fall back into the channel.
Waiting for tomorrow.The entire market is waiting for the major news that will be announced one after another starting tomorrow.

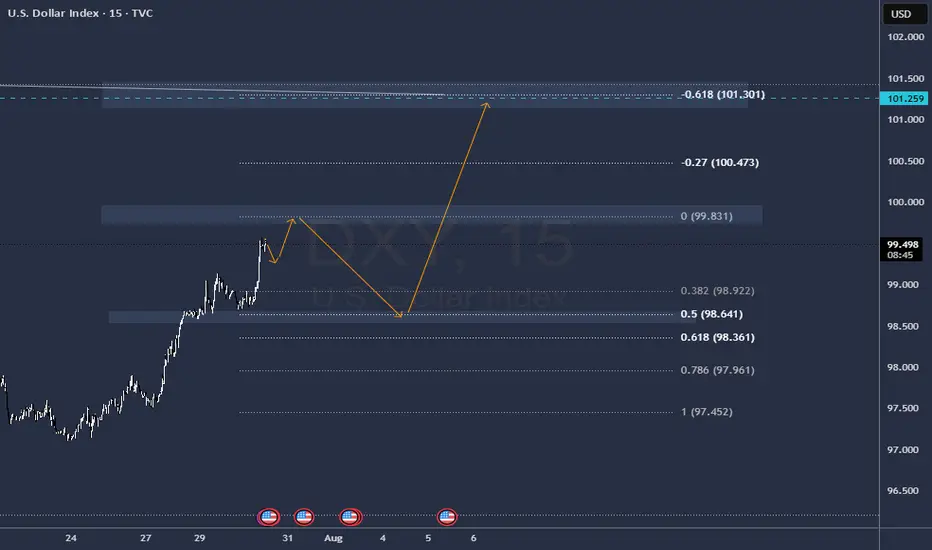
U.S. Dollar Index (DXY) – July 30, 2025 | 15-Min Chart1. **Range-Bound Structure**
DXY is consolidating between 98.588 support and 99.134 resistance. The 98.68–98.74 zone has acted as demand, but repeated retests show weakening buyer interest.
2. **Failed Breakouts**
Multiple rejections at 99.134 indicate it's a trap zone where sellers absorb buy-side pressure.
3. **Bearish Momentum Signs**
Lower highs and wicks into resistance with weak closes suggest distribution. Momentum likely shows bearish divergence.
4. **Critical Levels**
* **Support:** 98.588 — a break below this opens downside potential.
* **Resistance:** 99.134 — bulls need a strong breakout above this for continuation to 99.41+.
Summary:
Sellers dominate below 99.134. If 98.588 breaks, expect bearish continuation. Only a confirmed breakout above 99.134 shifts bias bullish.

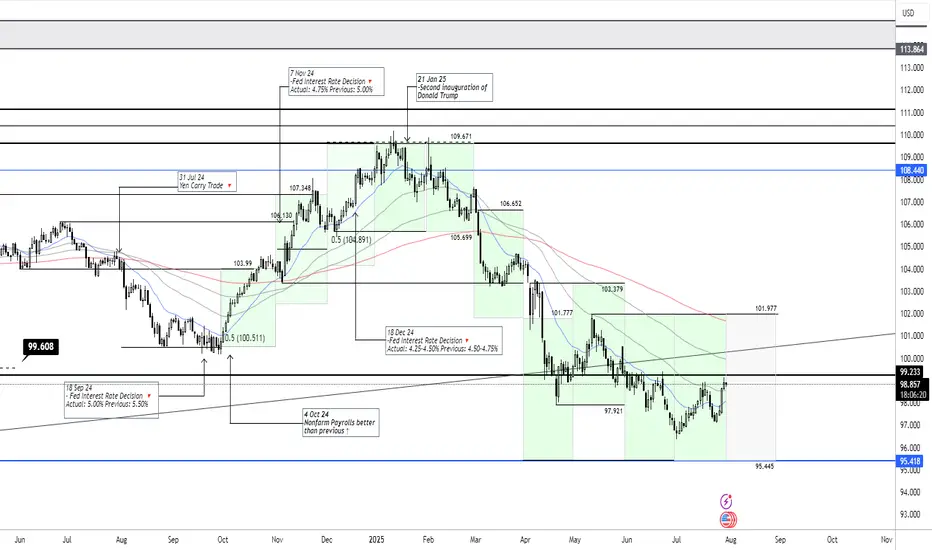
DXY July 30 2025The US dollar remains within the projected trading band, and we expect it to continue fluctuating within this range over the coming month.
Monthly Target: 95.445-101.977
Interesting few days ahead... USD pairs approaching key levelsDXY is finishing a HTF consolidation and is approaching medium-term key areas. Other USD pairs are also in areas where they could aggressively turn around. EURUSD just finished a H4 3-touch continuation flag and is starting to stall on the 3rd touch, suggesting indecision in the markets.
Considering the news events in the next 3 days, starting today with USD advanced GDP data, we could see volatility kicking in on these key levels. We do need a catalyst to push price into a larger directional move, and we are prime positioned for the next leg. Technically, a breakout in both directions would make sense in these areas. Time to set alarms and be vigilant but not jump into trades too early, considering NFP on Friday as well.
*** **** ****
📈 Simplified Trading Rules:
> Follow a Valid Sequence
> Wait for Continuation
> Confirm Entry (valid candlestick pattern)
> Know When to Exit (SL placement)
Remember, technical analysis is subjective; develop your own approach. I use this format primarily to hold myself accountable and to share my personal market views.
The pairs I publish here are usually discussed in detail in my Weekly Forex Forecast (WFF) and are now showing further developments worth mentioning.
⚠ Ensure you have your own risk management in place and always stick to your trading plan.
*** **** ****
Dollar is bullish Price was previously bearish, formed an inverse head and shoulders pattern. Broke out of the neckline. Wait for retest in combination of a bullish candlestick pattern and long.

US Dollar Index: Down YTD, But at a 5-Week HighThe U.S. dollar plays a leading role in the performance of U.S. stocks versus international stocks. The greenback endured its worst first-half performance since 1973, helping ex-U.S. equities post massive absolute and relative gains through June. But could the narrative be shifting? And what might it mean for investors?
The U.S. Dollar Index (DXY) sits at a five-week high ahead of the July Federal Reserve interest rate decision and the key July jobs report to be released on August 1. Up four sessions in a row, the dollar appears poised to post its best month since last December (in fact, the DXY's first positive month of 2025). If it’s the start of a protracted recovery, then the “U.S. exceptionalism” trade could be back in vogue over the second half, resulting in the same old story of U.S. over international in the stock market.

Possibility of uptrend As long as the indicator is above the green resistance zone and the resistance trend line is not consolidated, the continuation of the downtrend is likely. If the strong indicator breaks through the mentioned resistance zone, a long-term uptrend will be formed.
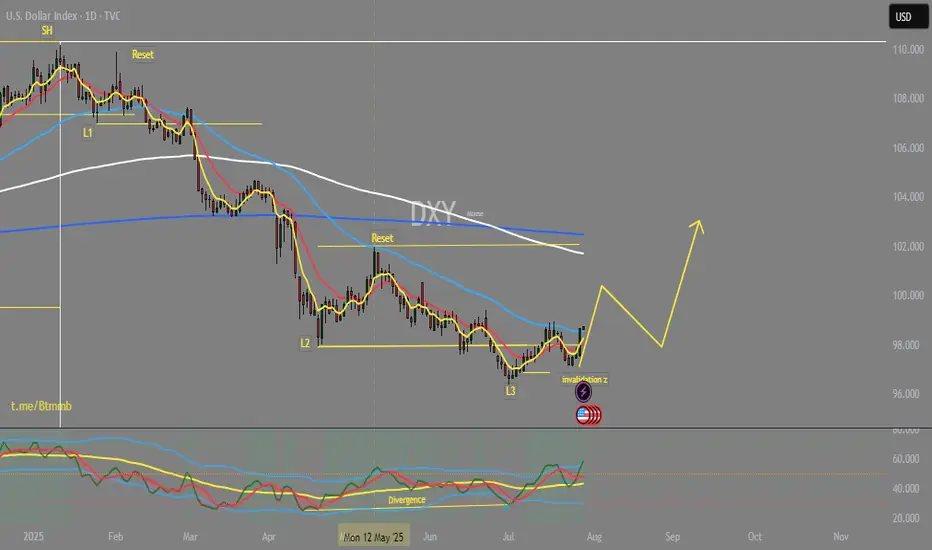
DOLLAR RECOVERYIt is been so down from begin of this year almost and now it is a time for the bulls to catch some breath. The cycle show that we are in the reset phase after the three levels down, which is gonna last until August 15 where we expect another fall.
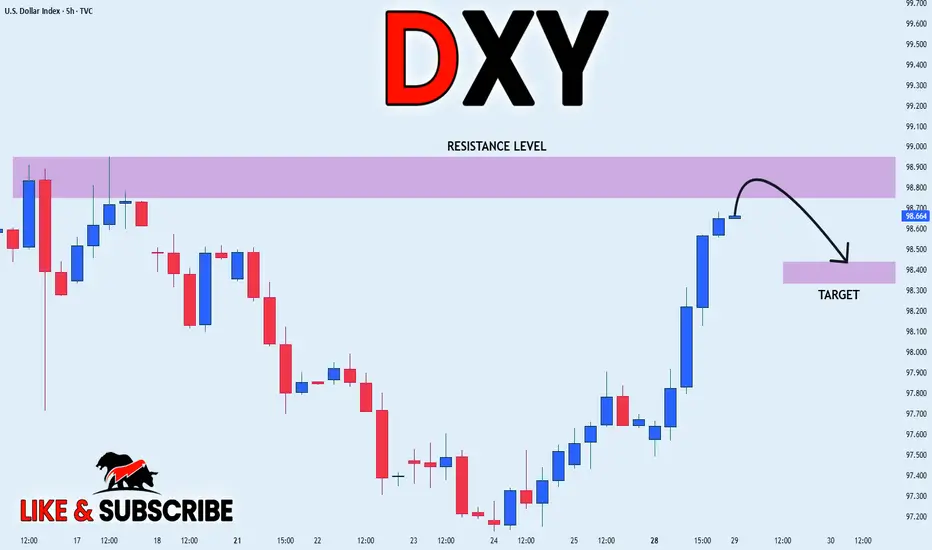
DXY LOCAL SHORT|
✅DXY is going up now
But a strong resistance level is ahead at 98.948
Thus I am expecting a pullback
And a move down towards the target of 98.451
SHORT🔥
✅Like and subscribe to never miss a new idea!✅
Disclosure: I am part of Trade Nation's Influencer program and receive a monthly fee for using their TradingView charts in my analysis.
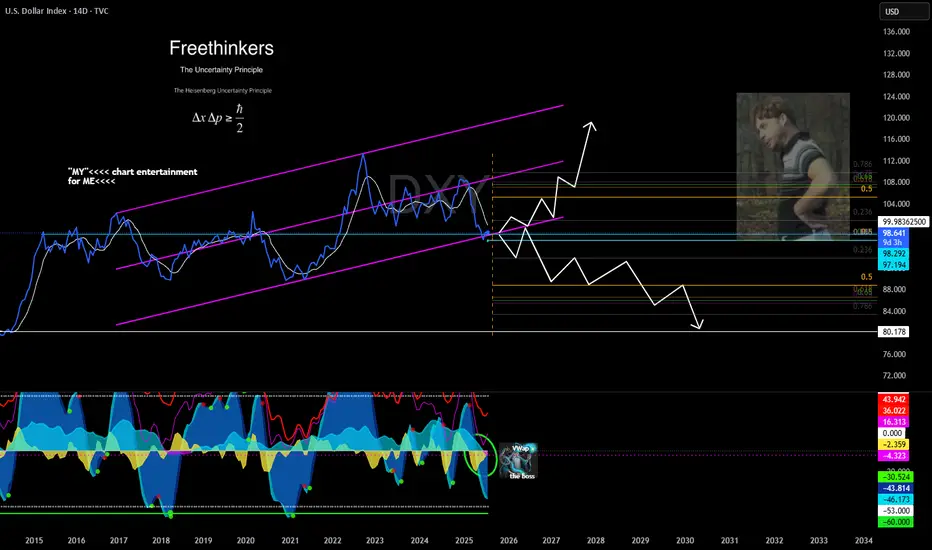
DXY dont take these charts serious its just my way to keep myself entertained while finding levels etc.. no your usual boring systematic shiiiteee!! IRISH CRAIC ONLY!!! ☘