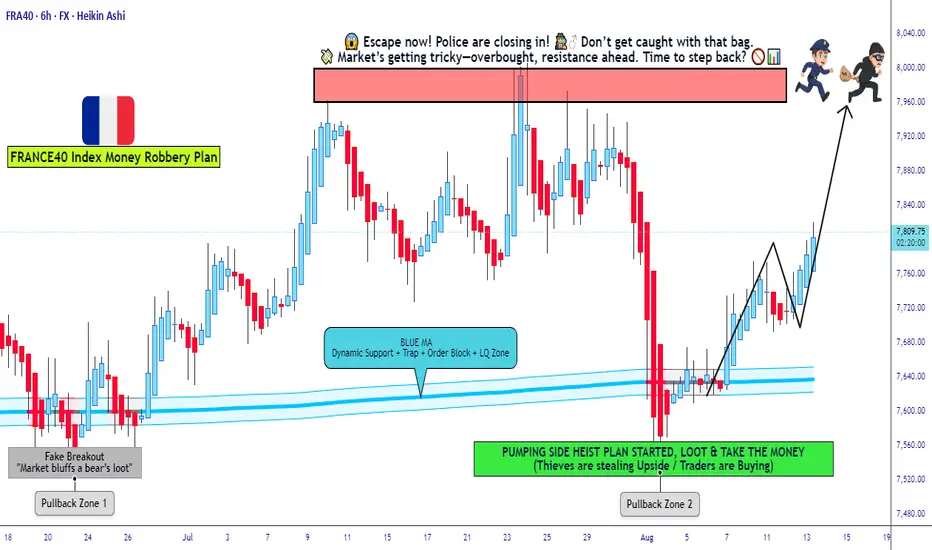
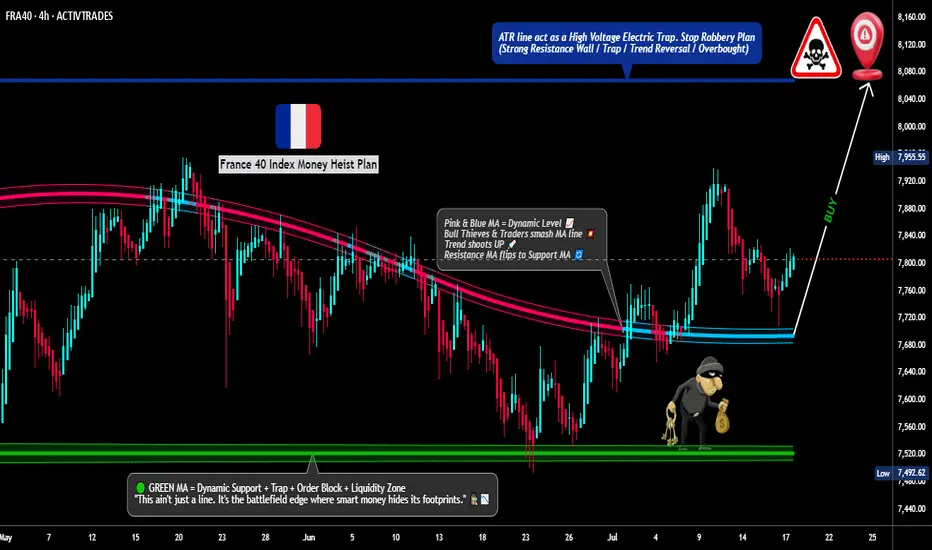
FRA40 Heist Incoming – Are You Positioning for the Escape?💰 FRA40/CAC40 "FRANCE40" INDEX HEIST – ULTIMATE BULLISH LOOTING PLAN 🏴☠️🚀
🔥 STEAL LIKE A PRO – LAYERED ENTRY MASTERCLASS 🔥
🤑 GREETINGS, FELLOW MARKET ROBBERS!
"This ain’t trading… IT’S A HEIST!" 🎭💸
Time to SWIPE the France40 index before the bears set their trap! Thief OG’s know the drill—LAYERED
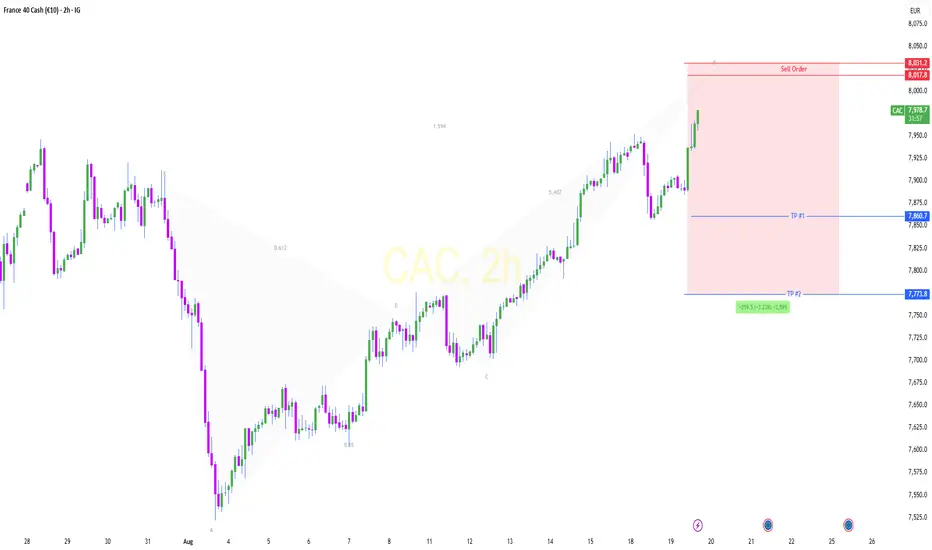
CAC ShortFR40 is expected to FALL from 8k , moving toward its target, supported by the Crab pattern formation.
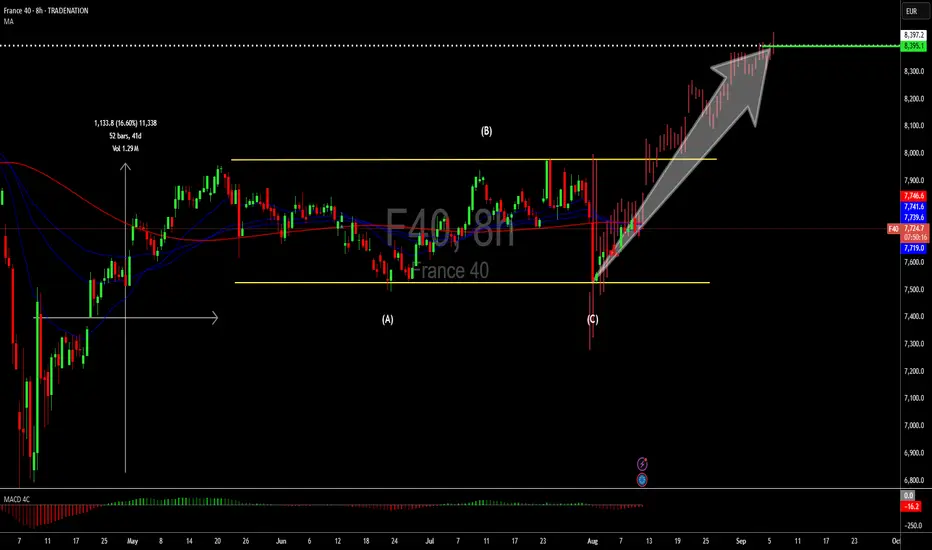
France 40: A short term buy opportunityHello,
There is a short term buy opportunity for the France 40 on lower timeframe. The France 40 is forming a flat pattern which is a continuation pattern for the previous impulse experienced from mid-April to late May. We see an opportunity for short term investors to enter at the current price wi
CAC40 Pivotal trading zone at 7730The CAC remains in a neutral trend, with recent price action showing signs of a corrective pullback within the broader uptrend.
Support Zone: 7520 – a key level from previous consolidation. Price is currently testing or approaching this level.
A bullish rebound from 7520 would confirm ongoing ups

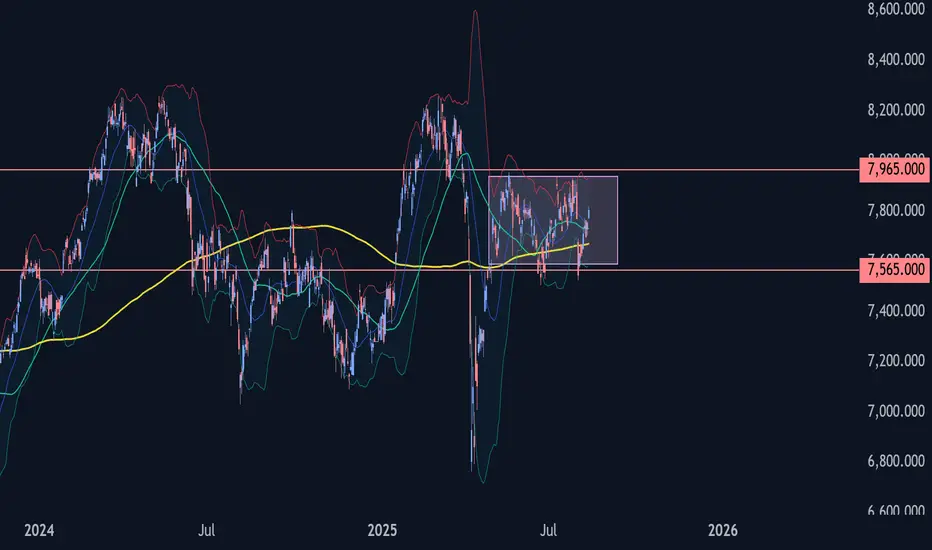
CAC40 Wave Analysis – 14 August 2025- CAC40 rising inside intermediate impulse wave (3)
- Likely to reach resistance level 7965.00
The CAC40 index continues to rise within the intermediate impulse wave (3), which began earlier from the support level of 7565.00 (the lower border of the sideways price range within which the index has b
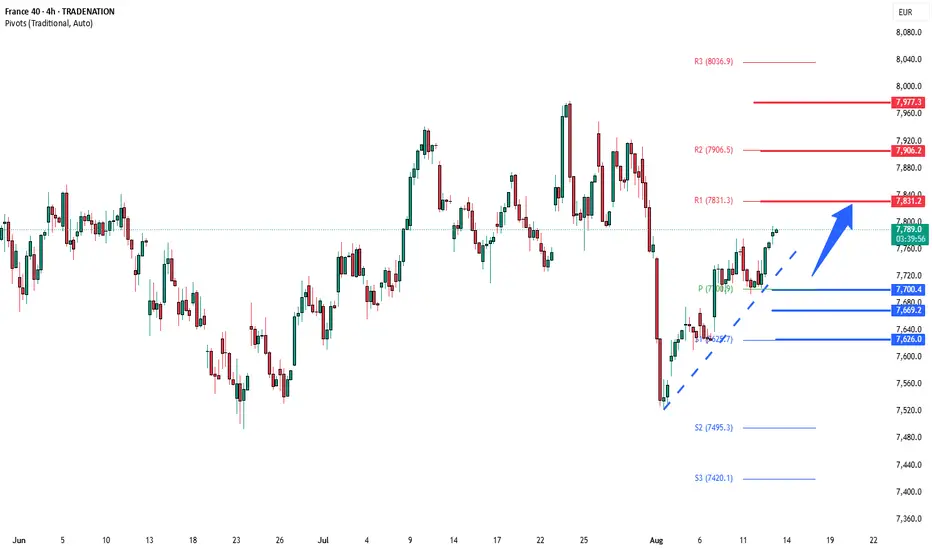
CAC40 oversold rally resistance at 7830The CAC40 remains in a bullish trend, with recent price action showing signs of an oversold rally within the broader uptrend.
Support Zone: 7700 – a key level from previous consolidation. Price is currently testing or approaching this level.
A bullish rebound from 7700 would confirm ongoing upside
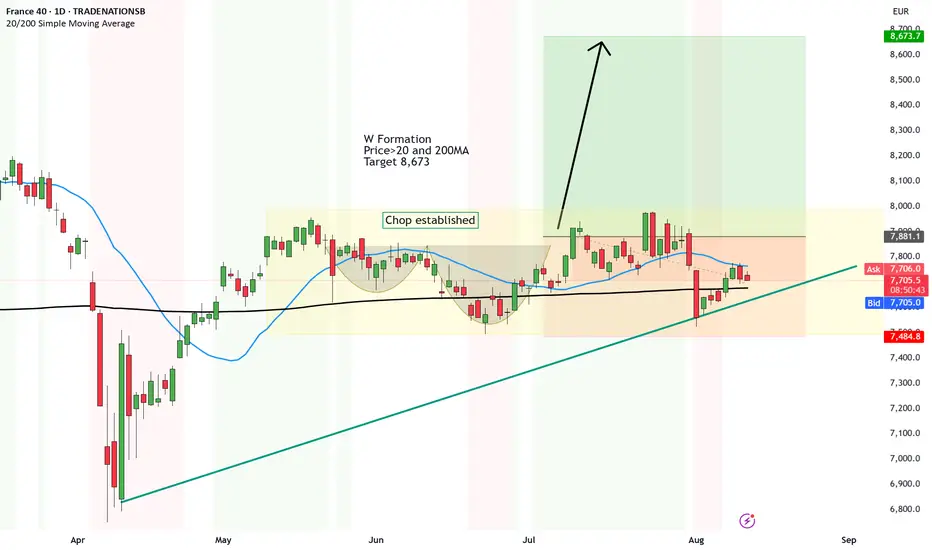
UPDATE: France fakeout - makes the analysis less attractive4th of July - we had FIREWORKS.
With a beautiful breakout above the neckline. But it was short lived.
And lead to a short fuse.
Because since then it went right back into the range, close to the stop loss and now it's moving sideways into a CHOP.
So, the analysis applies still but looks shake
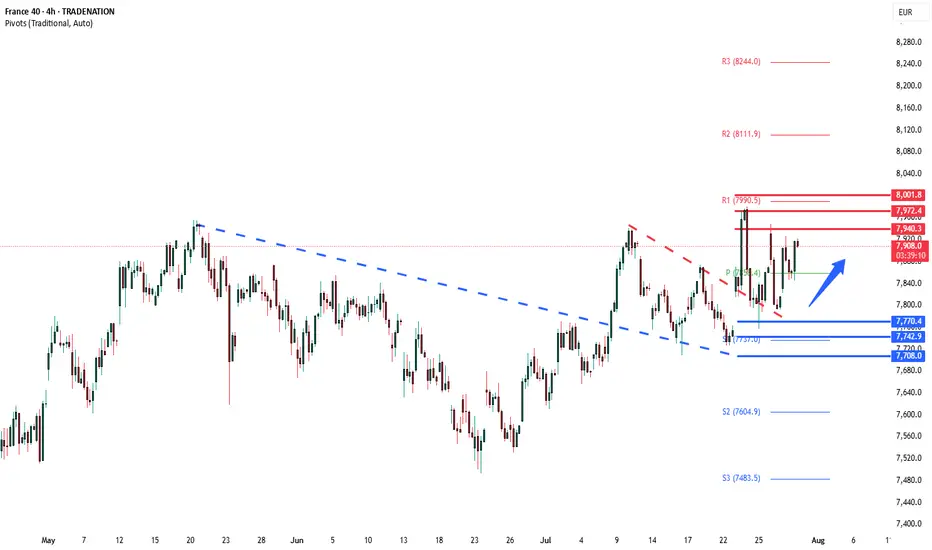
CAC40 Bullish breakout retestThe CAC 40 index continues to display a bullish bias, underpinned by a well-established rising trend. Recent intraday price action indicates a breakout from consolidation, suggesting renewed upward momentum.
Key Technical Levels:
Support:
7770 – This level marks the prior consolidation zone and n
"FRA40/CAC40 HEIST! Bullish Loot Before Bear Trap – Act Fast!"💰 FRA40/CAC40 "FRANCE40" INDEX HEIST – THIEF TRADING STYLE MASTER PLAN 🏴☠️🚀
🔥 Steal the Market Like a Pro – Bullish Loot & Escape Before the Trap! 🔥
🤑 GREETINGS, FELLOW MONEY MAKERS & MARKET ROBBERS!
🌟 Hi! Hola! Ola! Bonjour! Hallo! Marhaba! 🌟
This is your VIP invite to the ultimate FRA40/CAC40 he
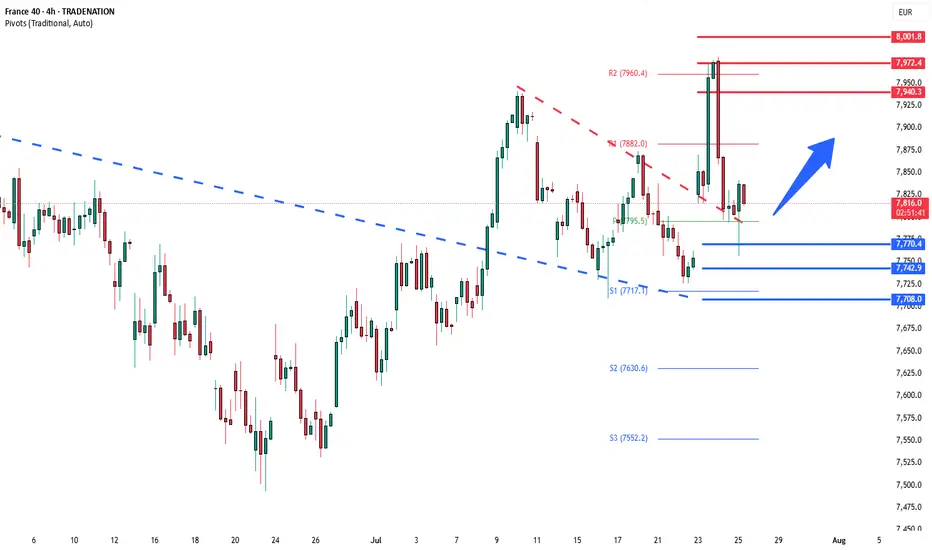
CAC breakout retest support at 7770The CAC 40 index continues to display a bullish bias, underpinned by a well-established rising trend. Recent intraday price action indicates a breakout from consolidation, suggesting renewed upward momentum.
Key Technical Levels:
Support:
7770 – This level marks the prior consolidation zone and n
See all ideas
Summarizing what the indicators are suggesting.
Oscillators
Neutral
SellBuy
Strong sellStrong buy
Strong sellSellNeutralBuyStrong buy
Oscillators
Neutral
SellBuy
Strong sellStrong buy
Strong sellSellNeutralBuyStrong buy
Summary
Neutral
SellBuy
Strong sellStrong buy
Strong sellSellNeutralBuyStrong buy
Summary
Neutral
SellBuy
Strong sellStrong buy
Strong sellSellNeutralBuyStrong buy
Summary
Neutral
SellBuy
Strong sellStrong buy
Strong sellSellNeutralBuyStrong buy
Moving Averages
Neutral
SellBuy
Strong sellStrong buy
Strong sellSellNeutralBuyStrong buy
Moving Averages
Neutral
SellBuy
Strong sellStrong buy
Strong sellSellNeutralBuyStrong buy
Displays a symbol's price movements over previous years to identify recurring trends.
Frequently Asked Questions
The current value of CAC 40 is 7,950.58 EUR — it has risen by 0.65% in the past 24 hours. Track the index more closely on the CAC 40 chart.
CAC 40 reached its highest quote on Mar 6, 2025 — 8,310.99 EUR. See more data on the CAC 40 chart.
The lowest ever quote of CAC 40 is 3,506.30 EUR. It was reached on Mar 19, 2020. See more data on the CAC 40 chart.
CAC 40 value has increased by 3.26% in the past week, since last month it has shown a 1.39% increase, and over the year it's increased by 5.60%. Keep track of all changes on the CAC 40 chart.
CAC 40 is just a number that lets you track performance of the instruments comprising the index, so you can't invest in it directly. But you can buy CAC 40 futures or funds or invest in its components.