MASA Ascending Triangle (1D) + Key LevelsBITGET:MASAUSDT is currently forming an ascending triangle on the daily chart, with horizontal resistance around $0.040 and rising support.
This structure typically leans bullish and suggests accumulation under resistance.
Structure & Zones
• Resistance: ~$0.040 (triangle top, within flipped de
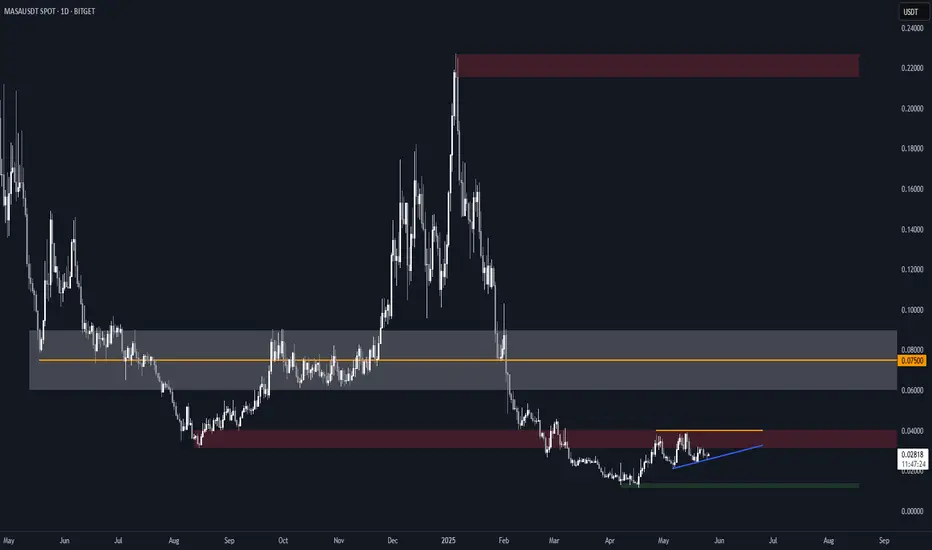
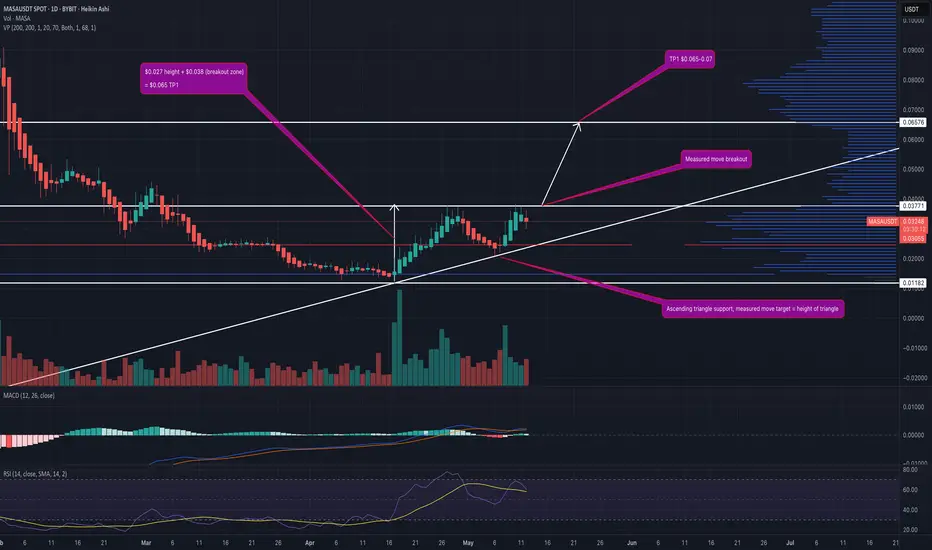
Long MASA AI Data InfrastructureAs the chart shows a clear ascending triangle, building long with a breakout target of $0.065
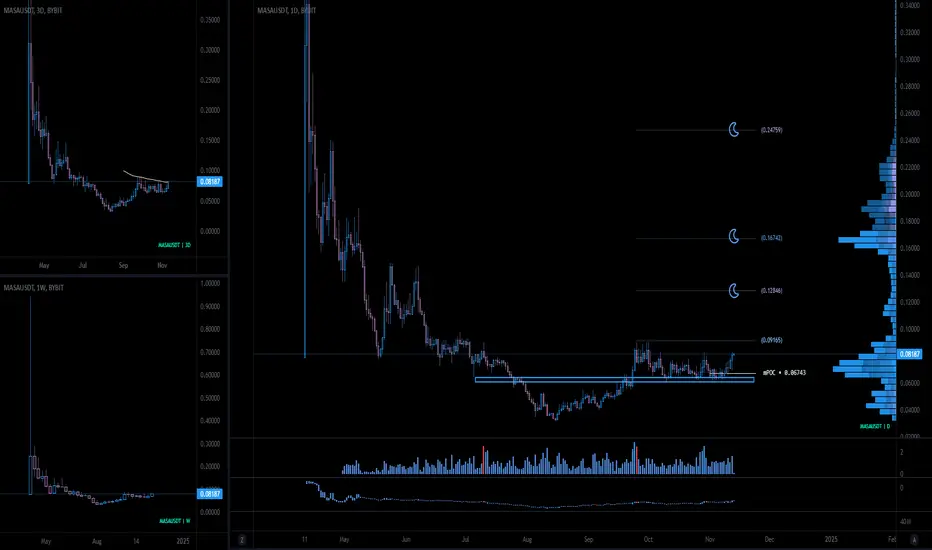
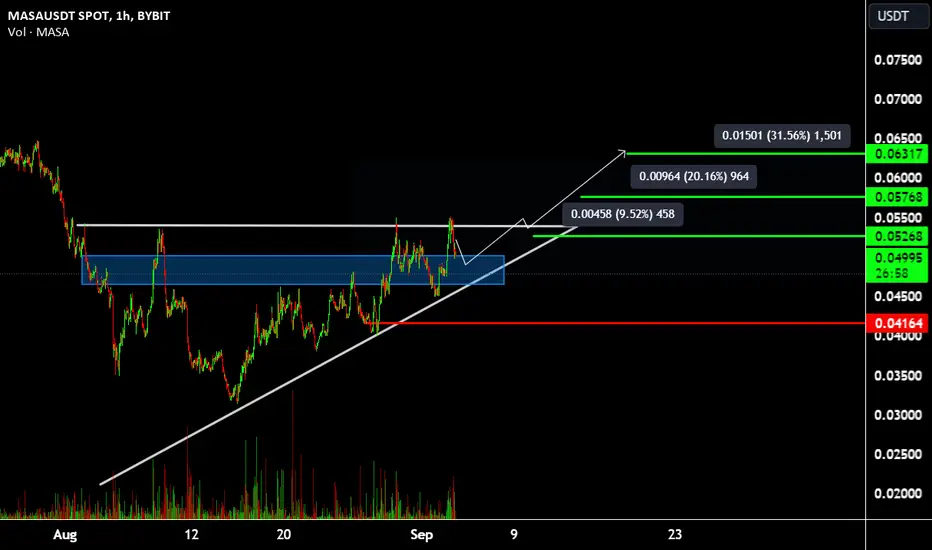
MASA Massive C&H possibleMASA has a reversal bottom in the form of the C&H.
3 neckline levels are possible.
Be aware of the RSI and volume in de breakout.
Possible target 100% up.
Use a SL to make sure you don't get liquidated when BTC suddenly retraces.

LIMIT ORDER - MASA/USDT ShortLIMIT ORDER - $MASA/USDT
Direction: #Short 🔴
Entry Price: 0.01502
Stop Loss: 0.01717
Target 1: 0.013942
Target 2: 0.012864
Target 3: 0.011785
Target 4: 0.010707
Target 5: 0.009629
Reminder: Move the stop loss to breakeven once the 2nd target (0.012864) is reached.
Disclaimer: This is not a financ

MASA #cryptoI don't have much understanding of cryptocurrency. I have purchased this and a few other coins based solely on technical charts. Since it's a very risky investment, I've only invested a small amount.

MASA C&H breakout with positive retestIDX:MASA is showing a cup and holder patern with a breakout en bounce as restest on its patern line. If BTC is acting like it is right now we could get a hughe pump of MASA. If BTC will pullback till de 85 / 87k zone we could see a rejection of the breakout of MASA. If so we need to look for ne pat
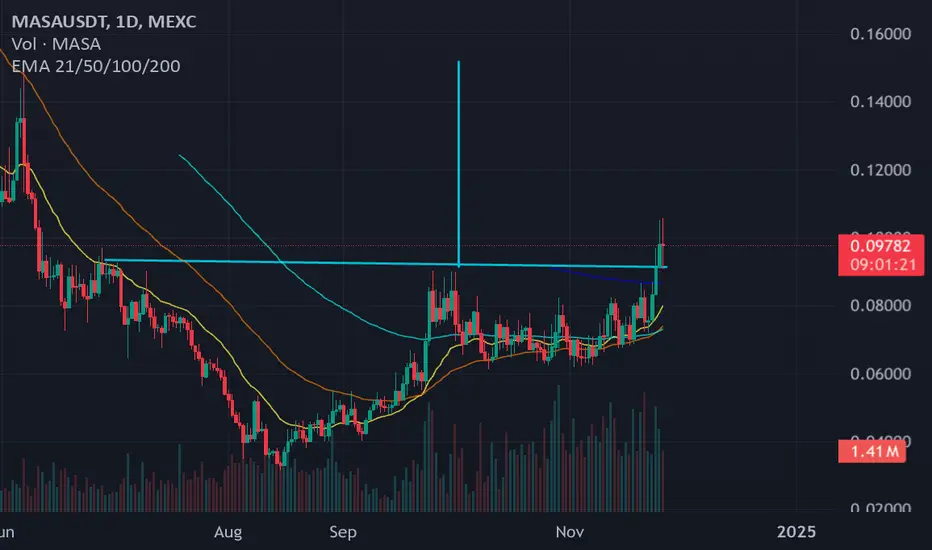
$MASA is attempting for a massive breakoutMASA is feeling BASE(D)! It's a strong AI low-cap.
This decentralized platform enables you to securely share and monetize your personal information, earning MASA tokens while supporting a fair AI ecosystem.
MASA has been consolidated for 50 days and now is attempting for a massive breakout
We can
MASA $0.079 | Ai For the Greater Good of the Peoplefrom the Underwritters of GRAPH ONDO ARKHAM and MASK
comes their Ai pet for the next big wave
currently under valued for friends and pals to come on board
when this gets traction and major listings
it shall be as insatiable as MATiC gunning above 1bn levels
strategy: buy and store it in a DORMA

MASA - LONG Hello, friends! Today, I reviewed the MASA coin. It is moving in an ascending triangle, and we see accumulation in the middle of the triangle. The coin has great potential targets. I expect a slight correction, where I consider buying. I have indicated the targets and stop-loss on the chart.
MASA NEW INCREASE VOLUME AND BREAKSince the breakdown of BTC more coins are into a downtrend
MASA seems to be able to make a high chance for an increase in the coming time frames.
We will see if MASA can make new trend confirmations and break.
$0,09 can become the first 15% first target

See all ideas
Summarizing what the indicators are suggesting.
Oscillators
Neutral
SellBuy
Strong sellStrong buy
Strong sellSellNeutralBuyStrong buy
Oscillators
Neutral
SellBuy
Strong sellStrong buy
Strong sellSellNeutralBuyStrong buy
Summary
Neutral
SellBuy
Strong sellStrong buy
Strong sellSellNeutralBuyStrong buy
Summary
Neutral
SellBuy
Strong sellStrong buy
Strong sellSellNeutralBuyStrong buy
Summary
Neutral
SellBuy
Strong sellStrong buy
Strong sellSellNeutralBuyStrong buy
Moving Averages
Neutral
SellBuy
Strong sellStrong buy
Strong sellSellNeutralBuyStrong buy
Moving Averages
Neutral
SellBuy
Strong sellStrong buy
Strong sellSellNeutralBuyStrong buy
Displays a symbol's price movements over previous years to identify recurring trends.