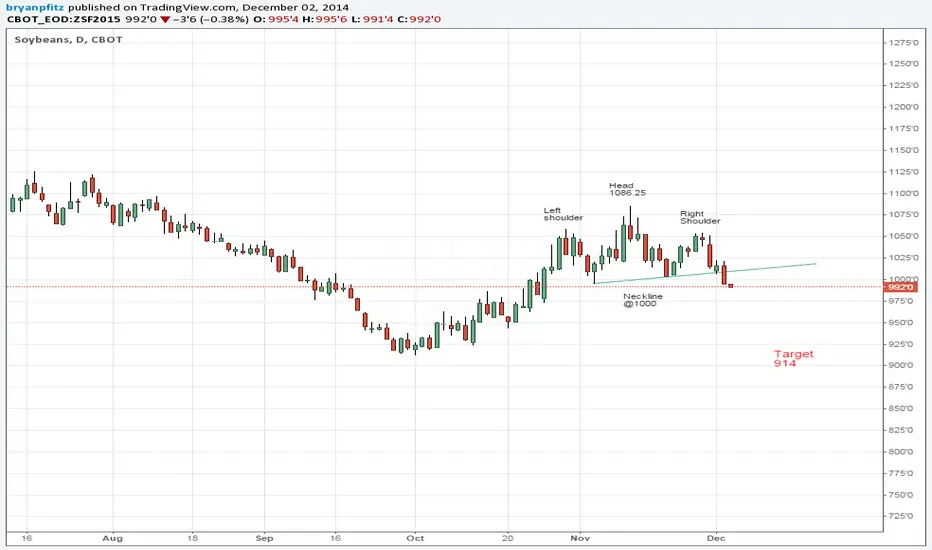
Soybeans breach neckline of Head and Shoulders top.Soybeans, technically, should be heading significantly lower in the short term. With the confirmation today of the head and shoulders top, the market should plummet by 8 - 9% by year end. This will put the soybeans smack down at year lows. The pattern took about a month to develop and should take about that long to fully unfold. However, this is a scared market right now and most of the damage should be done in the next few sessions. Everyone know the fundamental story with beans. Record harvest, perfect crop conditions, too many beans, yadda yadda yadda. The story has been out there and played itself to be true all year. It appeared as the market had finally found a bottom. Not so fast. Shorts have taken control of this market once again. All contracts are under attack as of this writing. The necklines have been breached and settled below in each of the expiring contracts out to Nov '15(that's as far dated as I checked). Here are the target prices for the next six expiring Soybean contracts.
SF15- 914 SH15 - 920 SK15- 930 SN15- 939 SQ15- 949 SU15- 931 SX15- 919
SOY.CME1! trade ideas
Soybeans (ZS) Bottoming on Weekly ChartZS has found major support at around the 900 level, as seen by the weekly RSI, Stochastics and MACD all turning up from oversold levels. The 900 round figure coincides with major bottoms in 2009 and 2010, along with near bottoming activity in late 2008. ZS appears to want to target roughly 1000 in the near-term where downchannel resistance can be expected to hold initially. Feel free to visit stks.co for today's technical analysis on $ZS_F, $ZW_F, $CT_F, $ZC_F, $NG_F, $SI_F, $EURUSD, $GBPUSD, $USDX, $BUXL, $KC_F, $NFLX.
Website: tradablepatterns.com
FB: facebook.com
Stocktwits: stocktwits.com
Twitter: twitter.com
Linkedin: www.linkedin.com
YouTube: www.youtube.com
Google+: google.com
Email: info@tradablepatterns.com

Favorite patternThis is one of our favorite patterns. It usually suckers people into believing we will see more downside. The larger players will usually dip below the wedge and get new shorts stuck and then squeeze them. (similar to Corn recently) If they break it to the upside we should see a quick move due to weak shorts being stopped. This is high on our watch list.

Soybeans moving lowerSee link to related idea for the overall view. This seems to be a continuation pattern. I'll short below the pivot low (1054.0). ZSX14 contract.

Soybeans counter trend trade (just in case)ZSU2014. I'm bearish here but if we trade above 1300.0 we could see a tunaround. Day trade.

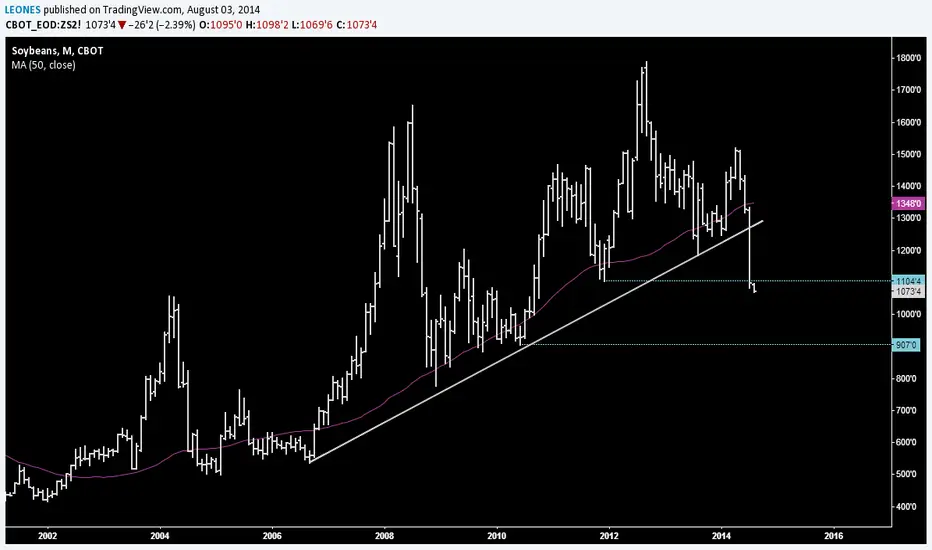
Soybeans moving lowerMonthly chart of the Soybean showing a major trendline broken to the downside. Next support 907.0. Look for selling opportunities
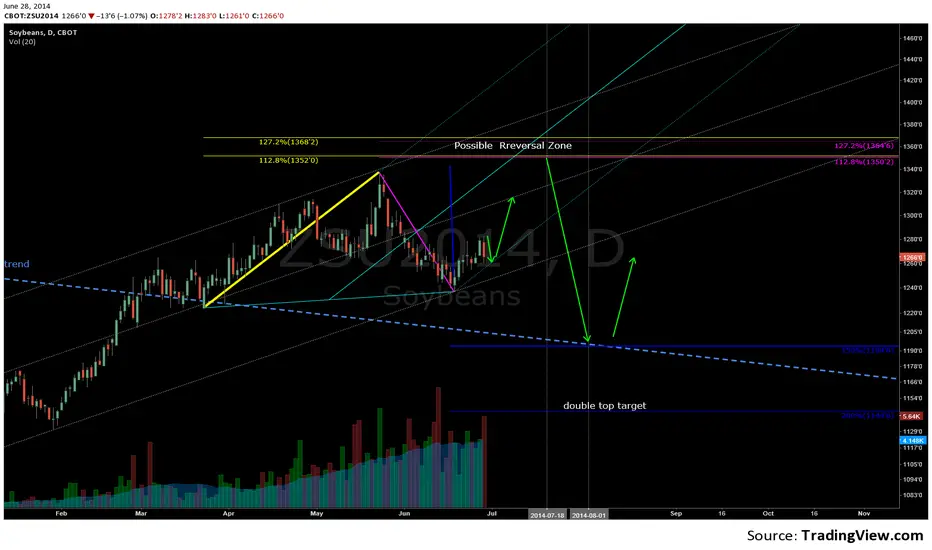
The Soybeans (ZSU2014)The soybean tend to peak Mid-July
And baced on soybeans pattern
Short term longside looks possible
Or sit on the side line looks best.
Soybeans peaking (update)Soybeans ZSN are forming a top. Typical seasonal peak is in June/July but this might be earlier. Chart pattern (M top) and RSI divergences are supportive. Targeting 1394.0 in one week time.

Soybeans peakingSoybeans ZSN are forming a top. Typical season peak in in June/July but this might be earlier. Chart pattern and RSI divergences are supportive. Targeting 1429 in one week time.
Fundamentals can be found in the USDA (US department of agriculture) reports:
www.usda.gov

zs1!The beans are a bit long in the tooth. A topping pattern is playing out. We want to be short (small size) for a short term reversal.

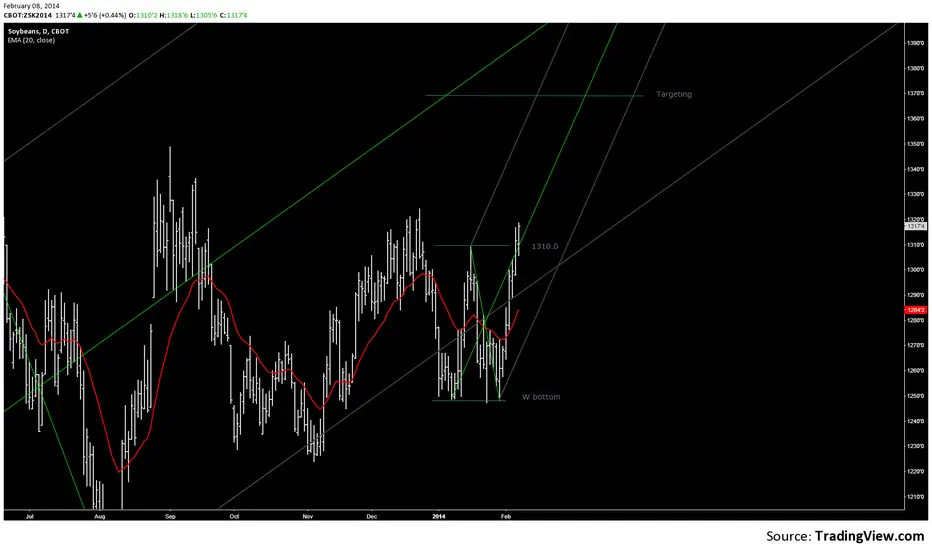
Strength in SoybeansWell, I was trying to sell it but the 1250.0 support is working quite well. W bottom formation now completed. Target should be 1370.0. I'll wait a pull-back to the 20MA to enter long.
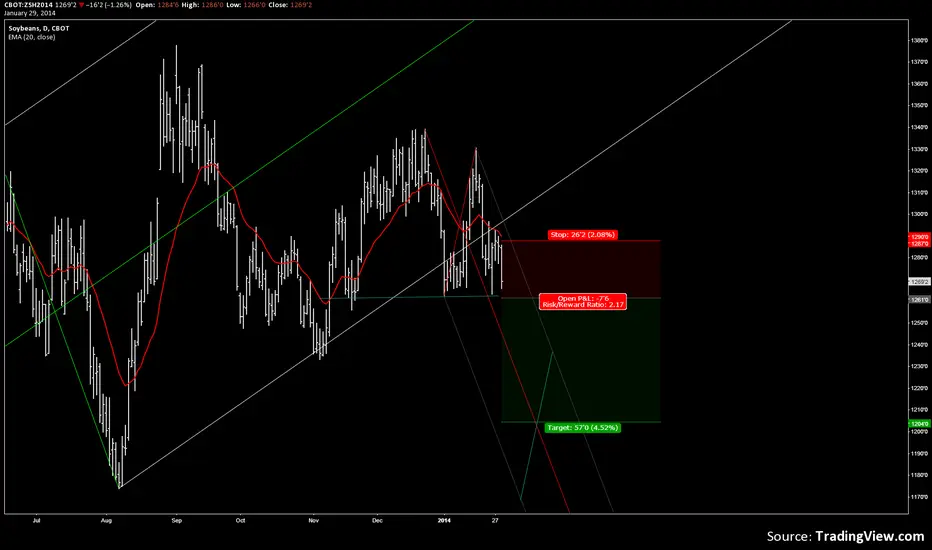
SELL BEANS WEAR DIAMONDS (revised)?Moving to May contract. Beans are at a critical juncture here. A trade below the pivot low posted on the 24jan2014 is going to trigger sell orders and project the price lower. The target is around 1200. where we could post the typical seasonal low.
Educational video
www.youtube.com

Sell beans wear diamonds?Beans are at a critical juncture here. A trade below the pivot low posted on the 27jan2014 is going to trigger sell orders and project the price lower. The target is around 1200. where we could post the typical seasonal low
Educational video
www.youtube.com

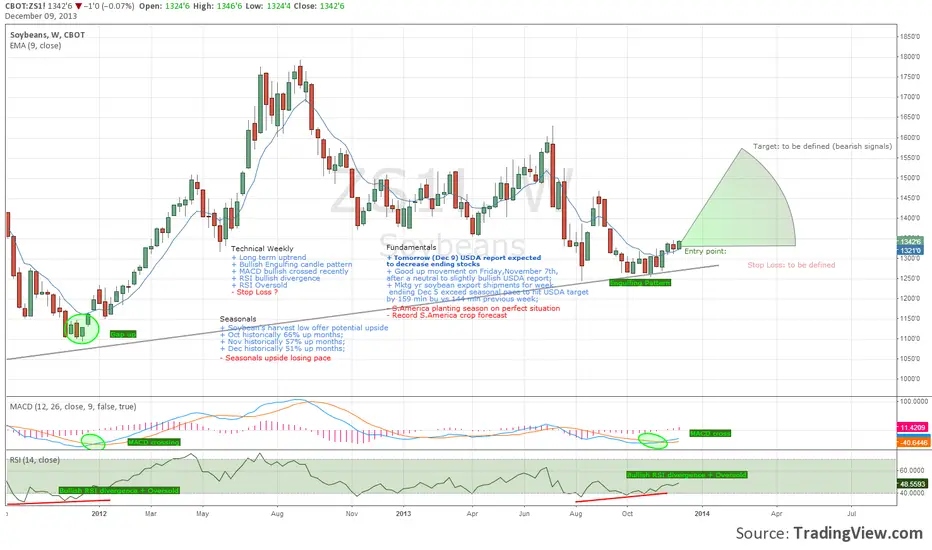
A new good entry point for SoybeansA good entry point might develop tomorrow if this prospect confirms.
US soybeans exports shipments have accelerated and to date exceed seasonal pace to hit USDA target by 159 mln bu vs 144 mln previous week. Tomorrow (Dec 10) USDA report is expected to decrease US ending stocks to a even more critical level, and recent price action, especially today, seems to reinforce that. Watch market reaction to the report.
...this added to some technicals, seasonals and fundamentals drivers displayed on the chart.
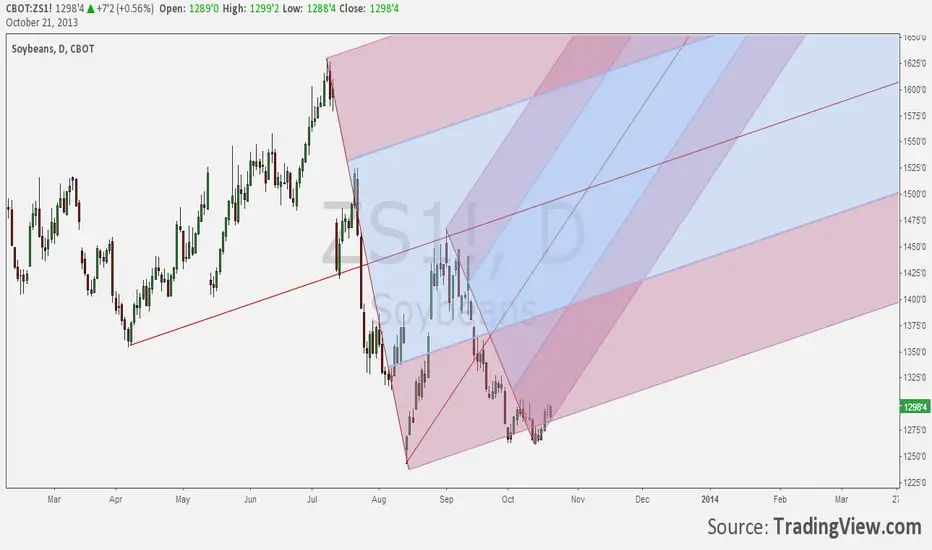
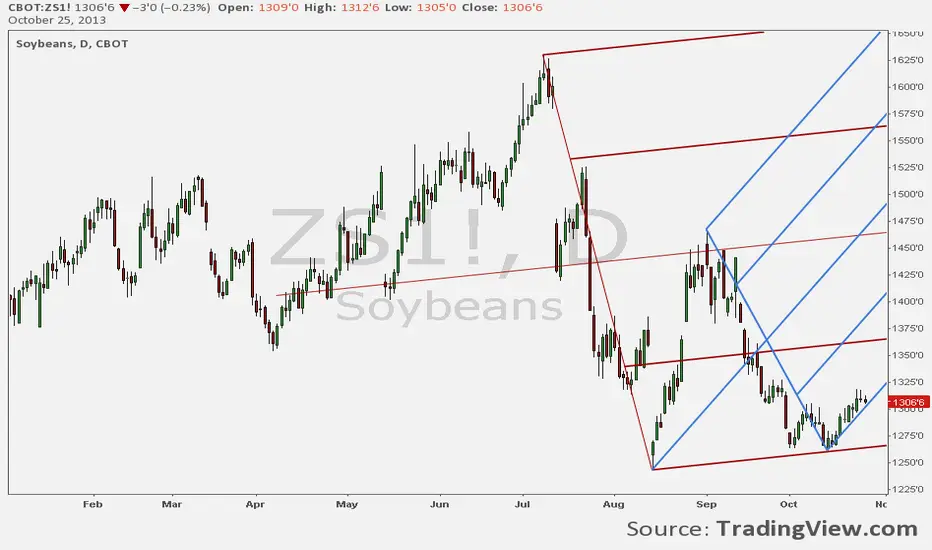
Soybean coilingSoybean has been coiling during the last month. The coil is expanding and seems ready to break out to the upside. Price should project to the median line in relative short time.


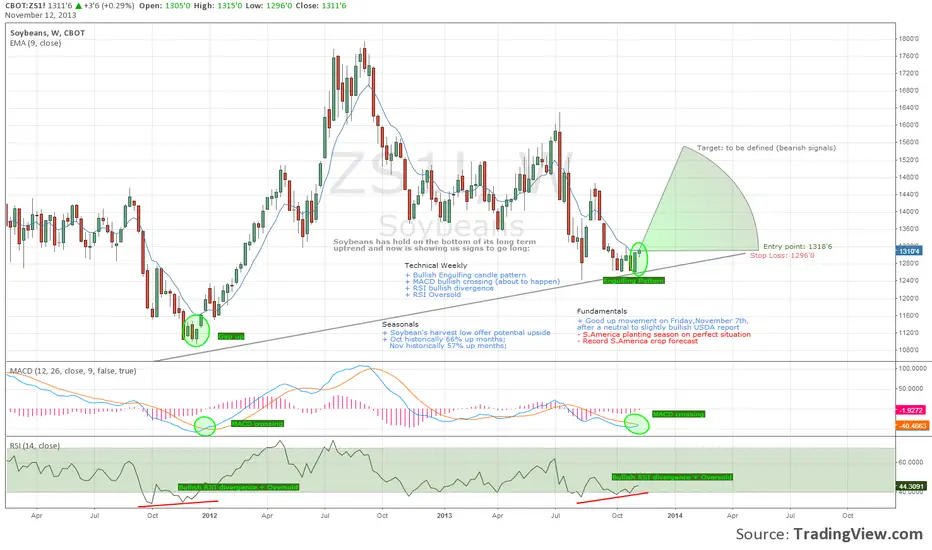
Soybean's harvest low offer potential upsideSoybeans has hold on the bottom of its long term uptrend and now is showing us signs to go long:
Technical Weekly
+ Bullish Engulfing candle pattern
+ MACD bullish crossing (about to happen)
+ RSI bullish divergence
+ RSI Oversold
Technical Daily
+ MACD bullish crossing
+ MACD divergence
+ RSI above 40
+ RSI bullish divergence
+ Stochastics bullish crossing
Fundamentals
+ Good up movement on Friday,November 7th, after a neutral to slightly bullish USDA report
- S.America planting season on perfect situation
- Record S.America crop
Seasonals
+ Soybean's harvest low offer potential upside
+ Oct historically 66% up months; Nov historically 57% up months
Entry point: a daily close above 1318'6
Stop: a daily close below 1296'0
Target: after bearish signals (to be defined)
Any other idea ?
Please, feel welcome to share.
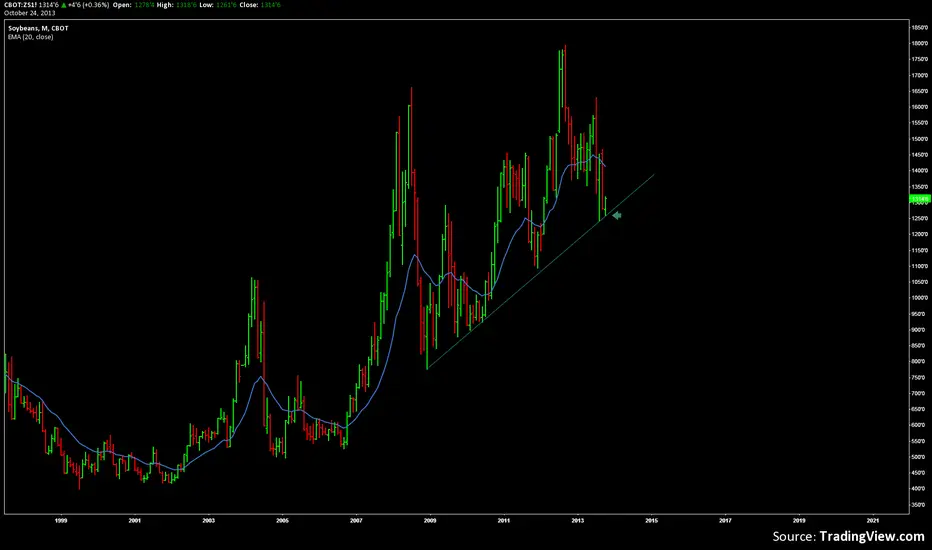
Soybeans broking its long term uptrend ?Soybeans broking its long term uptrend ?
Will it hold ?
By now, I still do not know what to do with that, but, a good clear opportunity is about to develop.
Worth keeping an eye on it.
How about you ? Any ideas ?
Thanks,

Soybeans harvest low offers potential free mealMonthly chart showing support line. Typically this is the time of the year when soybeans post the so called harvest lows. Look for longs. I will post possible entry points in the daily charts.