A-Book vs B-Book: What Every Retail Trader Needs to Know█ A-Book vs B-Book: What Every Retail Trader Needs to Know
Most retail CFD traders have never even heard the terms “A-Book” and “B-Book,” yet almost all of them are directly affected by how these models work. Your broker’s choice between the two can change the prices you see, how your orders are filled, and even whether your stop loss gets hit. Let’s break it down so you know exactly what’s going on behind the scenes.
█ What is A-Book?
An A-Book broker routes your orders straight to external liquidity providers, such as banks, market makers, or directly to an exchange in the case of futures or spot markets. Your broker is essentially the middleman, passing your trade along and matching it with a real counterparty.
⚪ How they make money:
Spreads (the difference between the bid and ask prices).
Commissions on each trade.
Occasionally a small markup on the feed.
Because they don’t profit when you lose, an A-Book broker’s ideal client is a trader who trades frequently and consistently, your activity is their revenue stream.
█ What is B-Book?
A B-Book broker keeps your trades “in-house,” meaning they take the other side of your position. If you buy, they sell; if you sell, they buy, but all within their own system. Your trades don’t reach the real market at all.
⚪ How they make money:
Your losses are their profits.
They may still earn on spreads and commissions, but the main income is the net loss of their client base.
Because the broker profits from losing clients, there’s an inherent conflict of interest. It’s not that every B-Book broker is out to get you, but the incentive structure is very different from A-Book.
█ Hybrid Models – The Modern Reality
Today, many CFD brokers use a hybrid model. This means small accounts or “unprofitable” clients might be B-Booked, while larger or riskier trades are hedged via A-Book routing. This approach balances their risk and maximizes profits.
█ The Stop Loss Mystery – Why It Sometimes Gets Hit When It “Shouldn’t”
A common complaint among retail traders is this:
“My stop loss was triggered on my CFD broker’s chart, but the real market price never touched it.”
⚪ Here’s why this happens:
B-Book influence: If your trade is kept in-house, the price you see is the broker’s internal feed, not the pure exchange price. Minor spikes or wicks can appear that don’t exist on the actual CME or underlying market.
Different price feeds: Even A-Book brokers often aggregate liquidity from multiple sources, leading to small discrepancies from the official exchange price.
Overnight sessions: Many CFD brokers price products nearly 24 hours a day, even when the underlying market is closed. This “synthetic” pricing can produce moves that never happened in the actual market.
The result? You might see your stop hit during quiet, low-volume hours when the real market was nowhere near that level.
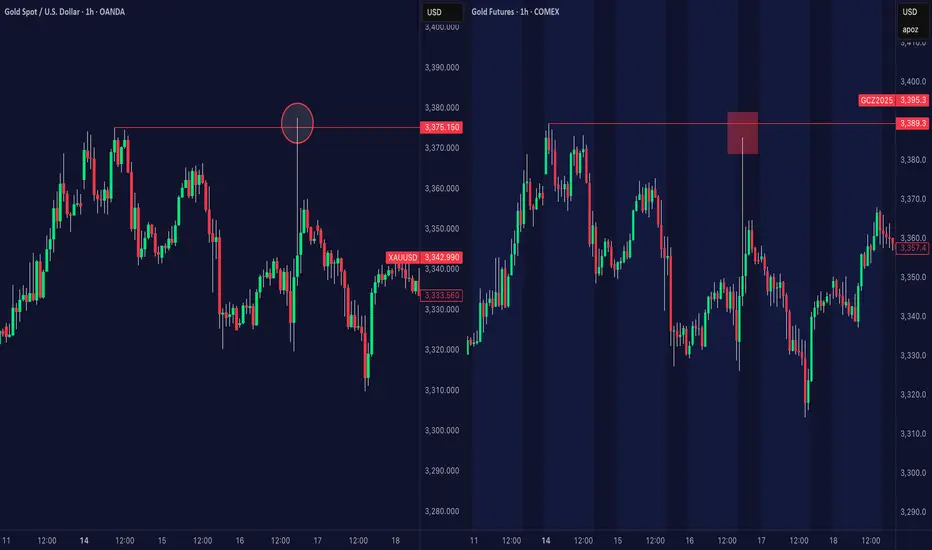
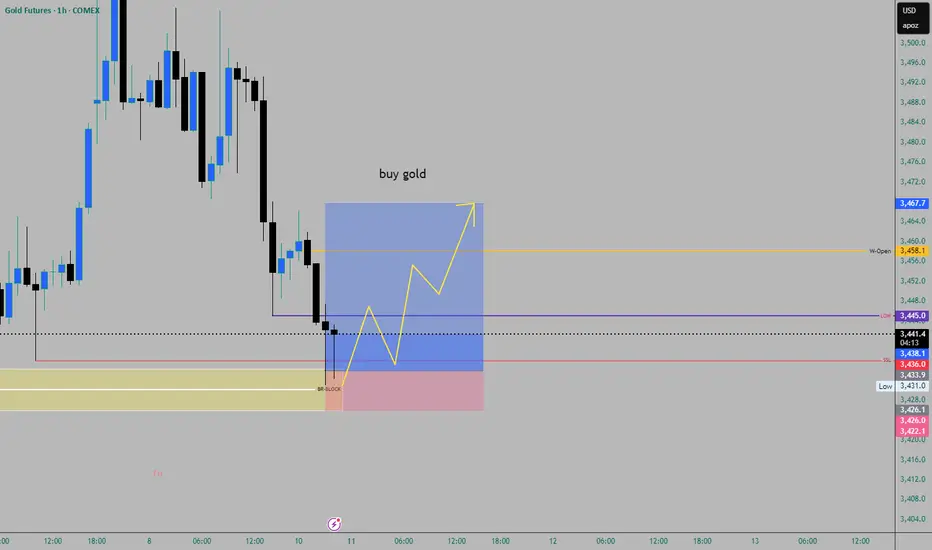
Side-by-side comparison showing a large wick on a CFD gold chart (left) that never occurred on the actual CME gold futures market (right). This kind of discrepancy can trigger stop losses on CFD platforms, even though the real market price never reached that level — a classic example of the Stop Loss Mystery.
█ Stop Hunting – When the Market Seems Out to Get You
Closely related to the stop-loss mystery is stop hunting, when price spikes just far enough to trigger a cluster of stops before reversing sharply.
In a pure B-Book setup, your broker isn’t just your counterparty, they can also see exactly where all their clients’ stops are placed. If they control the price feed, even the smallest manufactured move in their internal system can sweep through those levels. This can happen intentionally to lock in profits from client losses, or simply as a by-product of how their system reacts during thin liquidity.
From your perspective, it feels like the market was “out to get you,” touching your stop and then running in your direction. But often, that move never existed in the real underlying market at all, it was born inside the broker’s own pricing environment. And while low-volume hours are prime time for this, it can still happen in the middle of the busiest trading sessions.
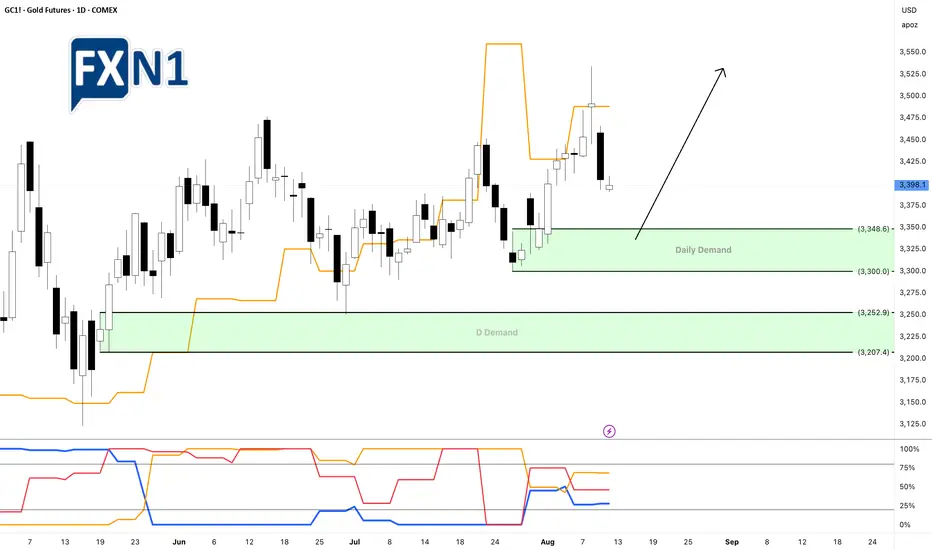
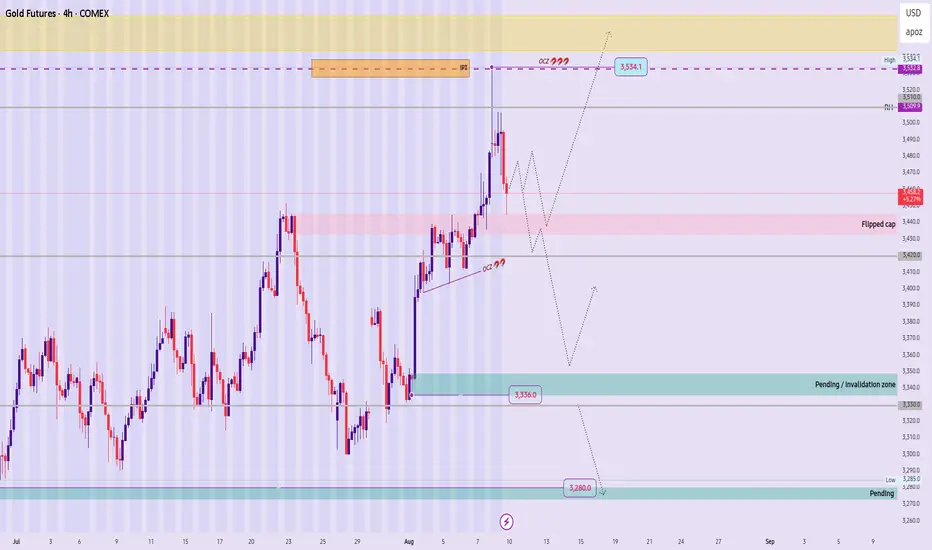
Comparison of gold CFD pricing (left) and CME gold futures (right). The CFD chart shows a wick that sweeps above previous highs, potentially triggering stop losses, while the real futures market shows no such move, a classic example of suspected stop hunting on CFD feeds.
█ Why This Matters for Retail Traders
Understanding whether your broker uses A-Book, B-Book, or hybrid execution changes how you view price discrepancies, stop-loss triggers, and even your broker’s incentives.
A-Book: Broker earns from your trading volume, not your losses.
B-Book: Broker earns directly from your losses.
Hybrid: They can switch between models depending on the trade and client profile.
Knowing this doesn’t just help you choose a broker, it helps you understand the “market” you’re actually trading in.
-----------------
Disclaimer
The content provided in my scripts, indicators, ideas, algorithms, and systems is for educational and informational purposes only. It does not constitute financial advice, investment recommendations, or a solicitation to buy or sell any financial instruments. I will not accept liability for any loss or damage, including without limitation any loss of profit, which may arise directly or indirectly from the use of or reliance on such information.
All investments involve risk, and the past performance of a security, industry, sector, market, financial product, trading strategy, backtest, or individual's trading does not guarantee future results or returns. Investors are fully responsible for any investment decisions they make. Such decisions should be based solely on an evaluation of their financial circumstances, investment objectives, risk tolerance, and liquidity needs.
Gold Futures
GOLDJ2022 trade ideas
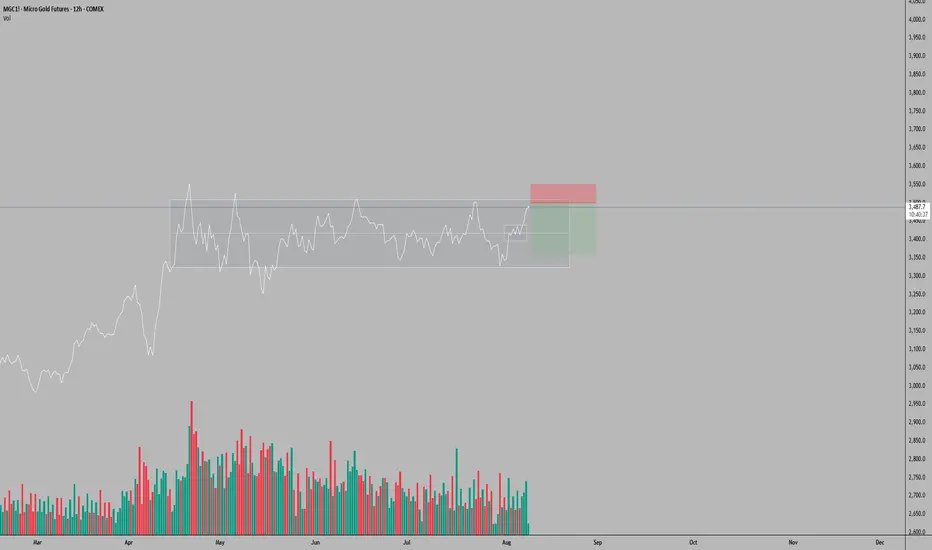
MGC (Micro Gold Futures) Trade Setup – 12H TimeframeOn the 12-hour timeframe, MGC has returned to the upper boundary of the horizontal range established since April 14, 2025. A surge in positive volume on August 7 was preceded by a sharp uptick beginning August 6, followed today by noticeably shallower volume—suggesting volume exhaustion and a potential pause or retracement.
Given today is Friday, profit-taking pressure may materialize following the rapid ascent that began with the breakout above the intermediate 3,400–3,440 zone on August 6. With no major macroeconomic events scheduled that could fuel further upside momentum, a pullback becomes a plausible scenario.
Illustrative Setup: A Sell Limit entry is considered around the 3,500 mark, with a Stop Loss at 3,550—matching the April 25 all-time high—and a Take Profit at 3,360, which aligns with intermediate support within the larger range. This setup offers a risk-reward ratio of approximately 2.8:1, assuming price reacts to overhead resistance and reverts toward the range’s mid-zone.
This analysis is provided solely for educational and entertainment purposes and does not constitute any form of financial or investment advice. Always manage your risk and trade responsibly.
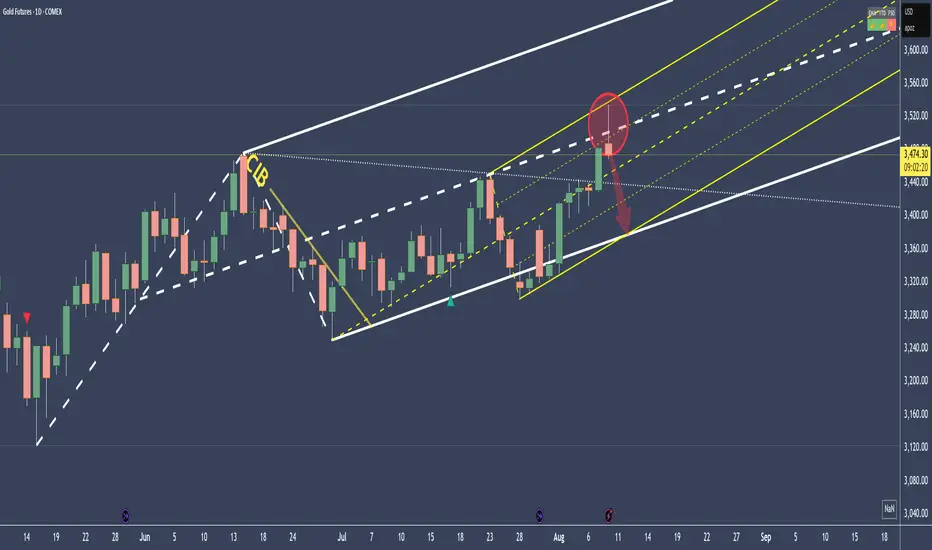
Gold explosion will be short livedThe price explosion in gold is solely due to the tariffs.
I don’t even want to go into detail about what impact this will have on the USA. I’ll just say this much: I feel sorry for the American people, and it’s not their fault.
And here, once again, we see the universal law of physics inherent in Median Lines/Forks at work. Right at the center line, the price will pull back and may drift toward the lower median line parallel, should the close occur below the center line.
It seems as though the basic rules of arithmetic are a foreign concept to those in leadership. There is a belief that billions of dollars will now suddenly flow into the U.S. Treasury overnight — which is, of course, complete nonsense. If that were truly the case, the price of gold in London would have risen in step with the U.S. gold price.
Instead, this madness will unfold as yet another act of monumental miscalculation, spreading across the U.S. economy and cementing the debt ledger as if it were the stone tablet of the Ten Commandments.
Let us see what our Median Line/Fork framework will reveal over the coming days.
…and I keep the world in my prayers, that peace may find its way into our thoughts.
GOLD: Still Bullish, But Is It Time For A Pullback?In this Weekly Market Forecast, we will analyze the Gold (XAUUSD) for the week of Aug 11 - 15th.
Gold is bullish on the Monthly, Neutral on the Weekly, Bullish on the Daily. Strong close to last week. Tariffs on Swiss Bars coming into the US sent prices higher, but Trump took some of the steam off late with statements of clarifying the misinformation about the tariffs.
Will this bullishness continue?
Look for prices to retrace further into the consolidation, as it started on Friday. There is a poi that price could target in discount of the range. There we could find a high probability buying opportunity.
Be wary of the pullback, as that move is likely to be corrected, but that would set up a great long opportunity!
Enjoy!
May profits be upon you.
Leave any questions or comments in the comment section.
I appreciate any feedback from my viewers!
Like and/or subscribe if you want more accurate analysis.
Thank you so much!
Disclaimer:
I do not provide personal investment advice and I am not a qualified licensed investment advisor.
All information found here, including any ideas, opinions, views, predictions, forecasts, commentaries, suggestions, expressed or implied herein, are for informational, entertainment or educational purposes only and should not be construed as personal investment advice. While the information provided is believed to be accurate, it may include errors or inaccuracies.
I will not and cannot be held liable for any actions you take as a result of anything you read here.
Conduct your own due diligence, or consult a licensed financial advisor or broker before making any and all investment decisions. Any investments, trades, speculations, or decisions made on the basis of any information found on this channel, expressed or implied herein, are committed at your own risk, financial or otherwise.

Gold Update 06AUG2025: Price Tests ResistanceThe Triangle pattern in gold futures remains highly reliable.
Wave E held above the low of Wave C, maintaining the structure.
Price is now testing the Triangle’s upper resistance.
A breakout above this level would confirm the bullish setup.
The target zone remains unchanged: $3,900–$4,300.

Gold Fails to Break Tuesday’s High – H4 FVG Still in SightGold continues to coil beneath Tuesday’s high, showing signs of failed bullish follow-through. Price attempted to press higher but couldn’t break out — a sign that sellers may still be in control. We’re still under key resistance at the Daily High, and that unfilled H4 Fair Value Gap below remains a prime draw.
🧠 My outlook:
Expecting price to run back down toward the H4 FVG.
Watching for a potential stop run above Tuesday’s high to clean up the lack of excess shown on the DOM.
Anticipating the cleanest LONG setup might appear during NY session, but a solid entry could develop during Asian or London for a short if we see early signs of rejection.
Key levels and reactions around D-H and the previous day’s high will be crucial. If the market tips its hand early, I’ll be looking to position short with that FVG as my magnet.
Let me know if you're seeing something different. This feels like a setup that rewards patience and precision.

Gold Prices Slide as Geopolitical Calm Sparks Market DivergenceIn a surprising turn of events, gold prices experienced a sharp decline on Monday, reflecting shifting investor sentiment driven by easing geopolitical concerns and evolving market dynamics. The precious metal fell approximately 1.65% overnight, with the current trading price around $3,399 as of this writing. This downtrend marks a significant departure from recent stability, highlighting the complex interplay of global events and market positioning.
Geopolitical Factors and US Dollar Dynamics
The primary catalyst behind the recent slump has been the easing of geopolitical tensions, particularly surrounding the ongoing Ukraine conflict. Investors are increasingly optimistic about the prospects of diplomatic resolution, bolstered by the upcoming US-Russian summit scheduled for Friday. Many market participants believe that this high-level meeting could pave the way for de-escalation and possibly bring an end to the prolonged war, reducing the perceived need for safe-haven assets like gold.
Simultaneously, a surge in US Dollar buying has contributed to gold's decline. As the dollar strengthens, the relative attractiveness of gold diminishes since it is priced in dollars, making it more expensive for holders of other currencies. This dynamic has compounded the downward pressure on gold prices, further amplifying the current bearish momentum.
Market Positioning: Divergence Between Retail and Institutional Traders
A noteworthy aspect of the current market landscape is the divergence observed between different trader groups. Non-commercial traders, often institutional investors and hedge funds, have increased their long positions on gold. This suggests a continued belief in the metal’s potential as a safe haven or a strategic asset. Conversely, retail traders appear to be shifting towards short positions, possibly reacting to the recent price decline or attempting to capitalize on a short-term correction.
This divergence signals a potential imbalance in market sentiment and could hint at an upcoming volatility spike. Typically, such divergences between large institutional positions and retail sentiment can precede significant price movements, either a reversal or a deeper correction.
Technical Outlook and Upcoming Data Releases
Looking ahead, technical analysts are eyeing the possibility of a further spike down in gold prices before any potential rebound. The current trend suggests a bearish movement, but a volatile market environment could see a sharp correction or a "spike down" between today and the end of the week.
Adding to the market's uncertainty are upcoming macroeconomic data releases, notably the Core Consumer Price Index (CPI) month-over-month and the overall CPI figures. These indicators are critical as they influence expectations regarding Federal Reserve policies and can significantly impact dollar strength and precious metals’ prices. A surprise in these data points could either reinforce the bearish trend or trigger a reversal, especially if inflation figures diverge from consensus estimates.
Trading Strategy: Looking for a Long Setup
Despite the current bearish tone, there is a strategic opportunity for traders to position themselves for a potential rebound. Given the divergence and upcoming data releases, many are eyeing a long setup—buying opportunities that could capitalize on a short-term correction or a reversal once market fears subside.
Traders should monitor key support levels around current prices and watch for confirmation signals in price action and volume. A strong bounce or reversal pattern following the release of inflation data could present an ideal entry point for long positions, aligning with the broader view of a potential spike down followed by a recovery.
Conclusion
Gold remains a dynamic asset influenced by geopolitical developments, currency movements, and trader positioning. While the recent decline signals caution, the divergence in trader sentiment and upcoming economic data provide traders with a strategic landscape ripe for potential opportunities. As always, careful analysis and risk management are paramount in navigating these volatile markets.
✅ Please share your thoughts about GC1! in the comments section below and HIT LIKE if you appreciate my analysis. Don't forget to FOLLOW ME; you will help us a lot with this small contribution.
Gold Setting the Trap: Fake Rally Before the Fall?Gold (GC) Futures are showing signs of a potential reversal after a surprise bullish NY session, likely sparked by headline sentiment (Trump-related news). While the impulse looked strong, we remain below the previous daily high, and structure may still favor a deeper move south.
🔍 Key Notes:
Price is stalling near a high-volume node (~3436–3445).
Possible liquidity sweep above NY highs before reversal.
Watching for confirmation during Asian or London killzone.
Bearish continuation becomes more likely if we break below NY session lows and hold.
Bias: Bearish, targeting rebalancing of the H4 FVG if structure confirms.
Sharing this to track how the algo reacts inside upcoming killzones. Open to thoughts, breakdowns, and alternate reads 👇

Gold at All-Time Highs – Blow-Off or Breakdown?Gold has just printed new all-time highs, but I’m approaching with caution. At these levels, everyone long is in profit — leaving no trapped buyers above and only liquidity for smart money to grab.
We kicked off the session with an impulsive spike higher, but this may have been a stop run and liquidity sweep rather than the start of another leg up. If price struggles to hold above that spike or fails on a re-test, we could see sellers step in, targeting the 4H FVG zone below.
For now, I’m watching:
A possible revisit of yesterday’s high to “fix” lack of excess on the DOM
London session reaction to today’s spike high
Potential short setups if buy-side momentum stalls
NY session might deliver the day’s best move, but we could see early opportunities in the Asian and London sessions if price confirms a shift in order flow.
What do you think? Is this a blow-off top in the making, or do buyers have one more push?

GOLD | NEW WEEK TECHNICAL BIAS (MARKET OPEN)
HTF Bias (Daily/Weekly):
Macro trend remains bullish — recent impulsive leg to fresh highs confirms strong upside momentum. However, price is currently extended and undergoing a corrective pullback.
4H Context:
After a sharp rally into 3,534 (primary impulse target), gold is retracing into the Flipped Cap Zone at 3,430–3,445 — a prior resistance now acting as support. Holding this band keeps the bullish continuation scenario intact.
Key Zones & Levels:
Primary Liquidity: Above 3,534.1 (OCZ — main upside target)
Buy Zone : 3,430–3,445 (Flipped Cap / potential re-entry base)
Invalidation: Daily/4H close below 3,420 → shifts bias bearish toward 3,389–3,350 PIZ
Secondary Liquidity: 3,420–3,397 (intermediate OCZs)
Deeper Bearish Trigger: Break below 3,336.0 opens path to 3,280 and lower.
Bias Outlook:
Bullish continuation favored if 3,430–3,445 holds, targeting liquidity above the 3,534 OCZ. Break and close below 3,420 tilts the odds toward a deeper correction.
⚠️ Purely technical – no fundamentals.
📌 This is a strategic directional bias, not financial advice. Execute only with confirmation and proper risk management.
Gold completing a 4-month Bull Flag consolidation, 3800 next! We can see the classic bull flag consolidation pattern which has been going on ever since the stock market decided to go on a rager!
Even with that going on, smart money continues to buy gold on the dips as you should too.
Once Trump installs a phoney new BLS chief and moves to pressure the Fed by nominating a new governor after Kugler's departure the message will be clear:
1) the BLS and the Fed are no longer independent
2) the US dollar is going to tank
3) Gold is going to boom!
Good luck and happy trading!
Gold Futures: Short-Term Bounce Before Bigger Play?Gold Futures (MGC) has now reached the H4 + Daily FVG confluence zone we’ve been tracking over the past few days. Price action has been decisively bearish, breaking key intraday supports and targeting liquidity below the weekly low.
On the 1H & 4H, the ADX > 25 confirms strong short-term momentum, but the higher timeframes (8H+) still lack the directional conviction for the “big play.” This suggests the current move may be part of a broader setup still in development.
Here’s the scenario I’m watching:
Asian Session: Potential bullish retracement toward the POC in the volume profile as buyers step in from current FVG support.
London Session: Opportunity for shorts if price tags the supply zone around 3,430–3,447 and fails to reclaim higher levels.
NY Session: Possible reaction inside the remaining bullish FVGs, especially if USD news catalysts shake up momentum.
📊 Key Levels:
Support: 3,397 (W-L), 3,385–3,350 (lower FVG & HVN).
Resistance: 3,432–3,447 (supply), 3,466 (D-H).
Bias: Short-term bounce → London short setup → watch for NY session reaction.
Tomorrow’s USD-heavy news cycle could be the volatility driver that determines whether we get a deeper drop into the 3,350s or a reclaim back toward the mid-3,400s.

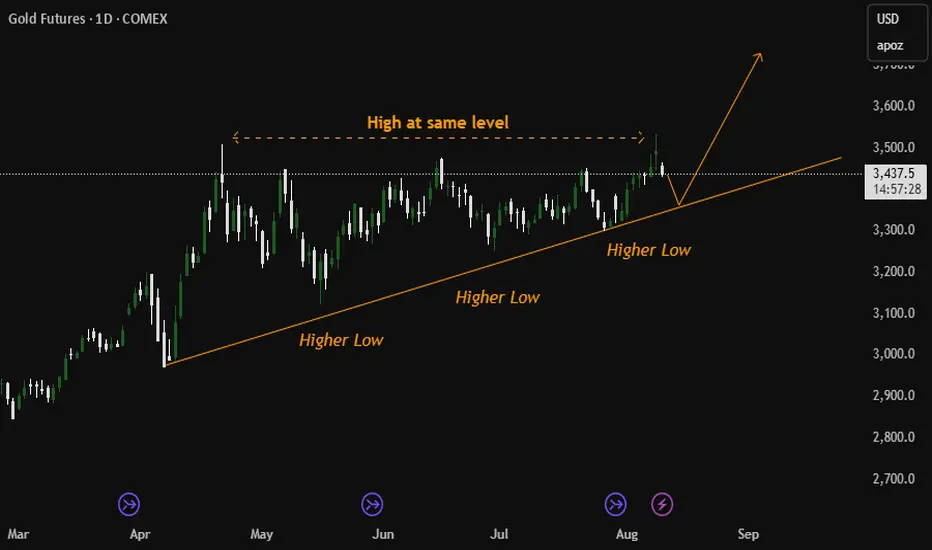
Gold Forms Triangle (Futures)Gold (Futures) contract appears to be forming a higher low pattern, with highs repeatedly testing the 3500 level. This indicates the formation of an ascending triangle. If the neckline breaks, the next upside targets would be 3572 and 3635. On the downside, a break below 3338 could lead to further declines.
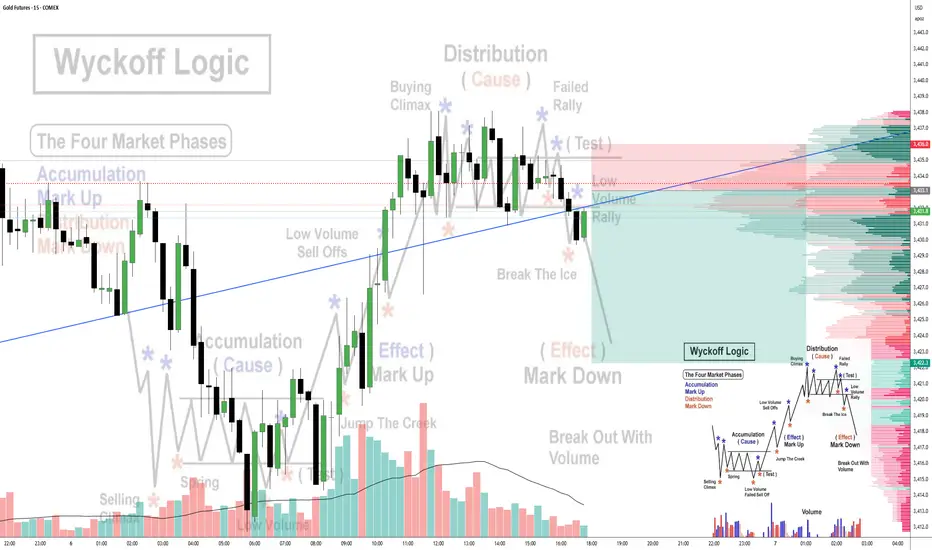
06-08-25 GC Wyckoff 5 minLet just see where this is going, same pattern on Daily and 5 min
Any of them could go up and this still would be Wyckoff theory, except Distribution would be called Reaccumulation
Gold is testing minor support and resistance I see gold trying to maintain above the $3400 level. I think today we will test $3390 - $3400 as a support level. If price breaks below $3388 I would entertain sells down to $3360 or $3350
If price bounces off the $3390 level, then I’m immediately looking for buys and looking to hold until $3480 or the end of the week. Which ever comes first.

Gold’s Two-Zone Patience Play – Wait for the FVGs to SpeakPrice action on GC is sitting in no-man’s land, caught between two key imbalances.
Above: 1H Bearish FVG at $3,470–$3,480.
Below: H4 Bullish FVG at $3,350–$3,375, aligned with the Weekly Low.
I’m waiting for price to step into one of these “Patience Zones” before committing.
A push up into the 1H FVG during a killzone could set up shorts targeting the W-L and the H4 FVG fill.
A drop into the H4 FVG first — especially with a sweep of $3,397 — could provide the low of the week and a strong bullish reversal.
No mid-range chasing here — let liquidity do the heavy lifting.

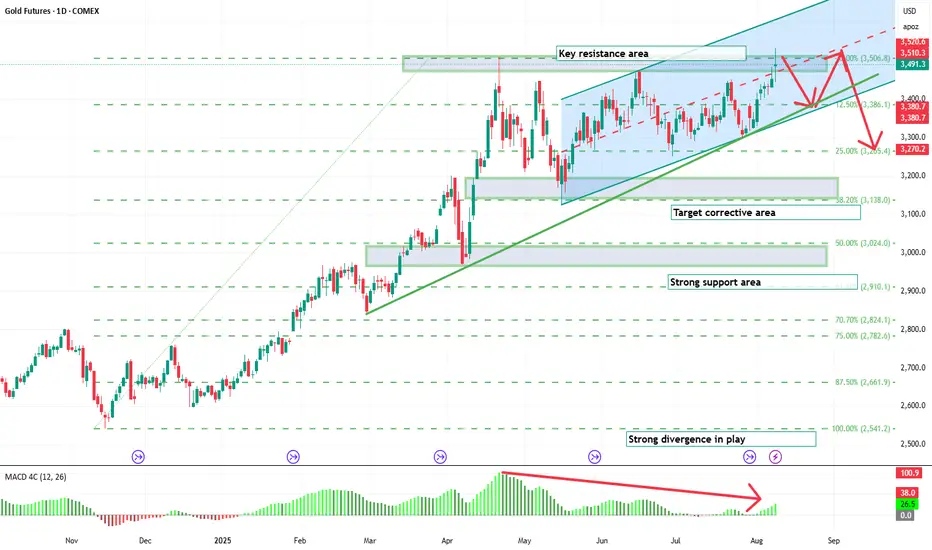
August Gold futures update Gold like equities is a tough one to call for decent corrective moves, far to many buyers sitting in wait, many central banks waiting to buy. But watch the indicated resistance for a reasonable corrective move to make the market decide on its next move.
GOLD !!! XAUUSD UPDATES \\Gold has yielded substantial returns (63%) since March 24, signaling a potential cooldown. Overbought RSI conditions suggest a likely 20-25% correction, potentially redirecting funds to recently corrected markets. Consider initiating short positions upon breaking today's low or the 101,000 level on MCX.

Gold Future MCXMarket is in Correction Phase If it Get Support At 100600, We can Expect Upto Again 102200,104000

Gold Weekly Outlook. 03.08.2025, SundayCOMEX:GC1!
Expecting a run up to daily BPR. Previous weekly closure suggesting bullish price action on Gold. Paytience is the key

Gold – Eyeing the H4 FVG Before the Next Bull RunPrice has been consolidating within the current Asian range after running last week’s high and today’s daily high. The move into D-H lacked strong momentum, and with a large unfilled H4 Fair Value Gap (3,350–3,372) below, I’m anticipating a retracement to rebalance liquidity before resuming the bullish trend.
Key Notes:
D-H (~3,436) acting as short-term resistance.
Watching for a sweep of D-H to create excess on the DOM, then a potential breakdown toward the H4 FVG.
Bearish path targets: 3,397 → 3,372 → 3,350.
Bullish continuation requires a clean breakout and hold above D-H with volume.
This scenario could set up a stronger bullish leg later in the week, especially if the retracement aligns with London or NY session volatility.

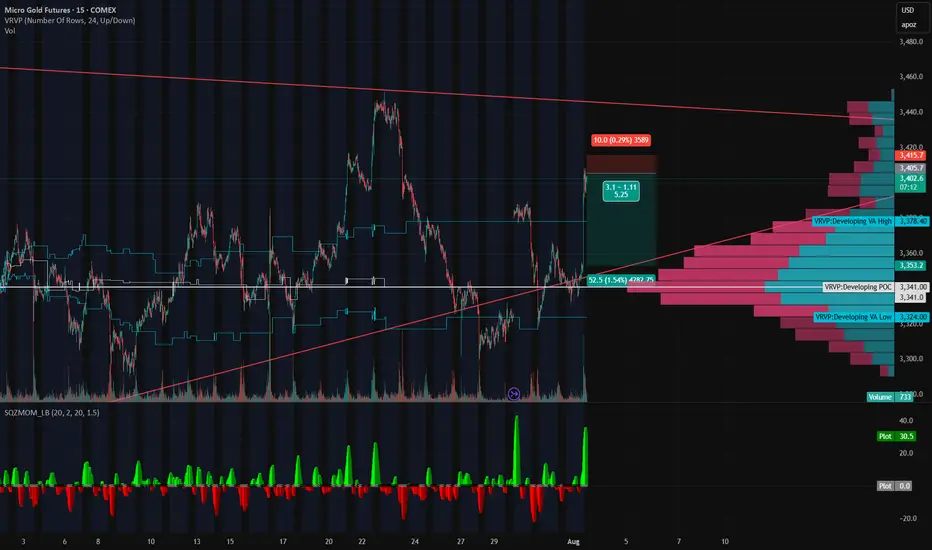
Gold’s on a Roller Coaster — and We’re Riding It Down🎢 Gold’s on a Roller Coaster — and We’re Riding It Down 🎢
Gold just snapped up like it saw Trump tweet “TARIFFS ARE BACK” — but the move smells like a knee-jerk algo pump, not real conviction. We just rejected right into a thin-volume imbalance zone and tagged the underside of a long-standing trendline.
📉 Short Setup Locked In:
💥 Entry: 3405
🛑 Stop: 3415
🎯 Target: 3353
💰 R:R ≈ 5:1
🔍 Why I'm In This Trade:
That rip? Total headline panic, not structural strength.
Low volume shelf above, with a massive POC magnet below at 3353.
We tapped the Developing VAH (3414) and got rejected — classic trap setup.
SQZMOM showing the energy is already fizzling. Green flash, no follow-through.
🧠 The Narrative:
Gold’s trying to price in volatility from every angle — Trump talk, tariffs, macro chaos — but under the hood, this pop looks unsustainable. If this is just a liquidity grab, we could see a flush back into the meat of value fast.
Grab your helmets — this roller coaster might just be heading downhill 🎢📉