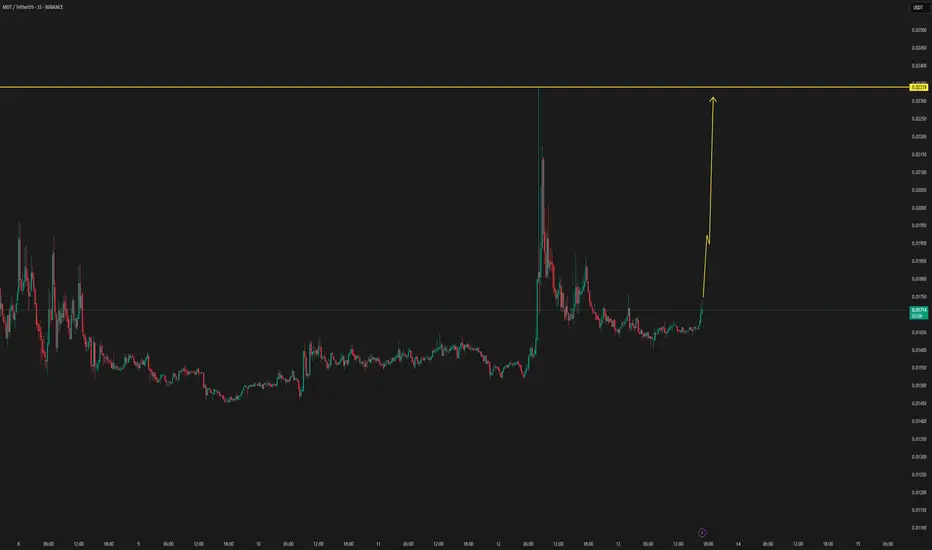
MDT NEW INCREASE VOLUMEMDT/USDT has new volume upcoming, which can be confirmed in the coming time frames. by new confirmations, the update will be followed below.
MDTUSDT trade ideas
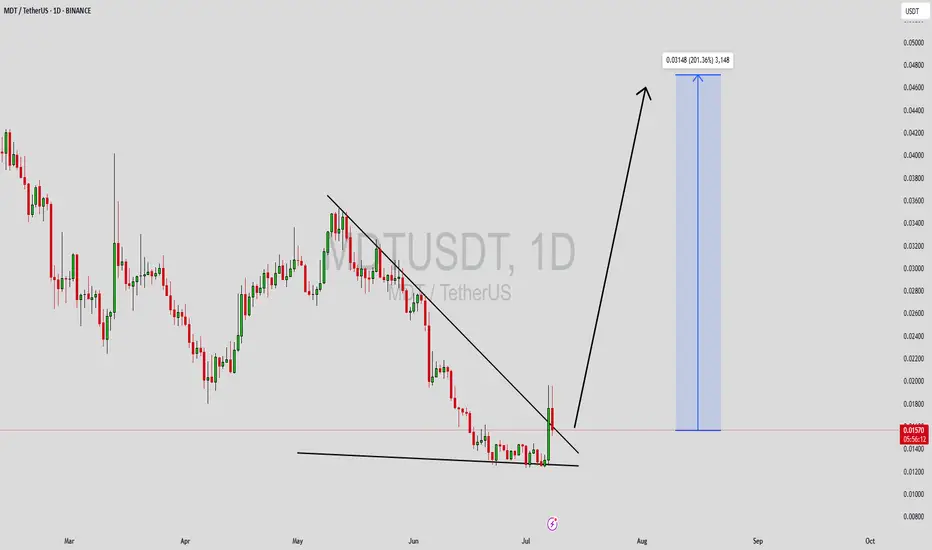
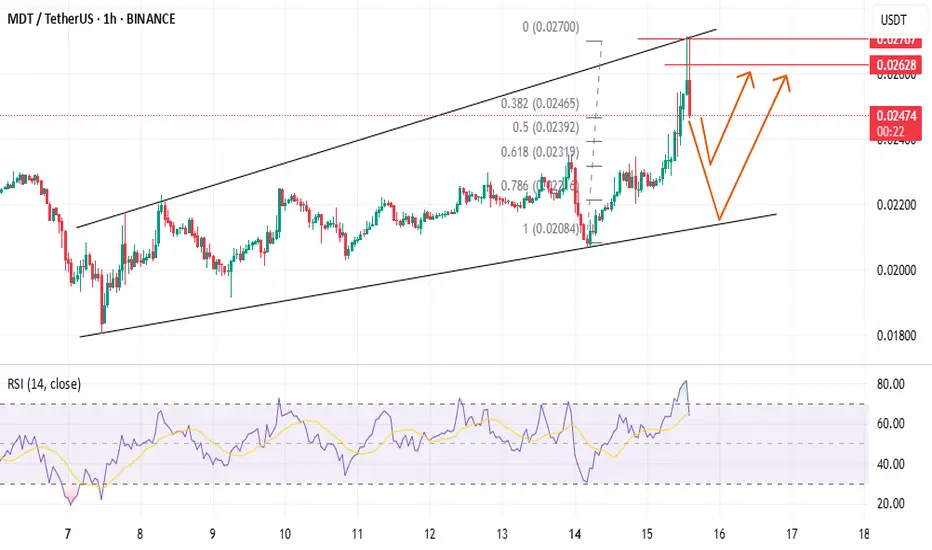
MDTUSDT Forming Bullish ReversalMDTUSDT is currently capturing the attention of crypto traders who are searching for high-risk, high-reward setups in the altcoin market. The chart shows MDTUSDT forming a clear falling wedge pattern that has now been broken to the upside, indicating a strong bullish reversal signal. With good volume supporting this breakout, the technical structure suggests that a massive price move could be on the horizon if momentum continues to build.
What’s particularly interesting about MDTUSDT is the significant upside potential traders are targeting, with an expected gain in the range of 190% to 200%+. This aligns with the measured move from the wedge pattern, giving bulls confidence that the current breakout could translate into sustained upward price action. As more traders recognize this setup, we could see increased buying pressure pushing MDTUSDT higher.
Investors are also showing renewed interest in the MDT project, adding a layer of fundamental support to the technical outlook. This blend of solid technicals and growing investor confidence makes MDTUSDT a compelling pick for anyone looking to catch a strong altcoin rally. Keep a close eye on follow-through volume and key resistance levels to confirm the strength of this breakout move.
✅ Show your support by hitting the like button and
✅ Leaving a comment below! (What is You opinion about this Coin)
Your feedback and engagement keep me inspired to share more insightful market analysis with you!
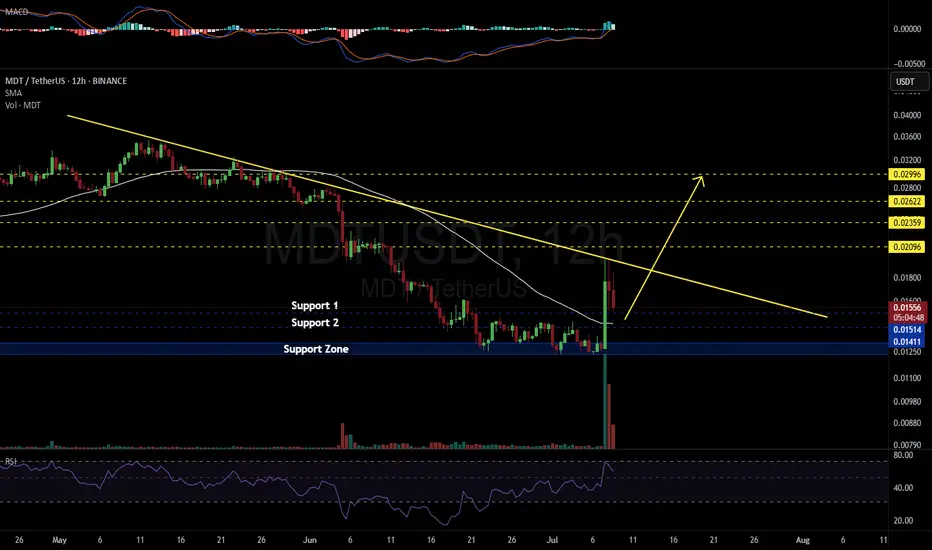
MDTUSDT 12H#MDT is currently holding Support 1 — consider buying a bag of it.
If it loses Support 1, enter gradually at the other support levels marked on the chart.
The 12H SMA50, which roughly aligns with Support 2, is a strong support zone.
In case of a breakout above the descending resistance, the targets are:
🎯 $0.02096
🎯 $0.02359
🎯 $0.02622
🎯 $0.02996
⚠️ As always, use a tight stop-loss and apply proper risk management.
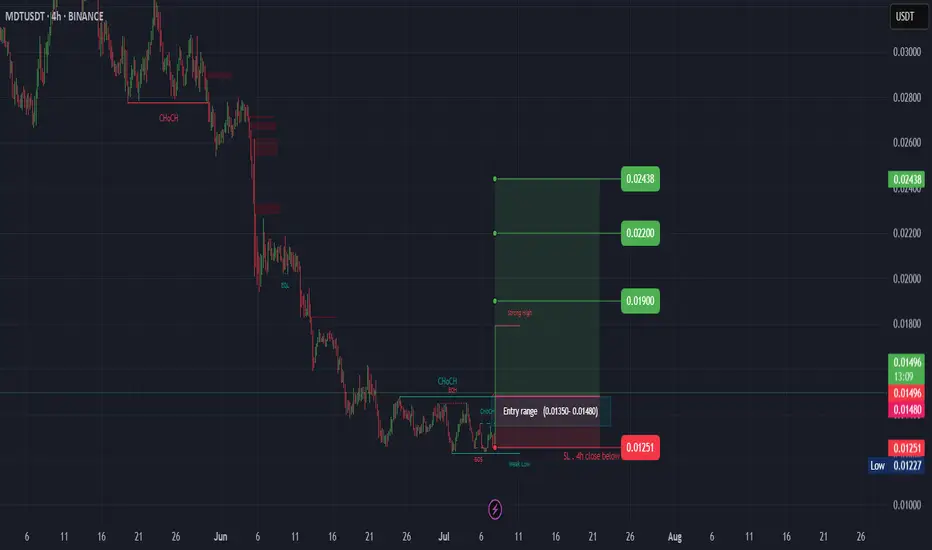
MDT (SPOT)BINANCE:MDTUSDT
#MDT/ USDT
Entry range (0.01350- 0.01480)
SL 4H close below 0.01251
T1 0.01900
T2 0.02200
T3 0.02438
_______________________________________________________
Golden Advices.
********************
* collect the coin slowly in the entry range.
* Please calculate your losses before the entry.
* Do not enter any trade you find it not suitable for you.
* No FOMO - No Rush , it is a long journey.
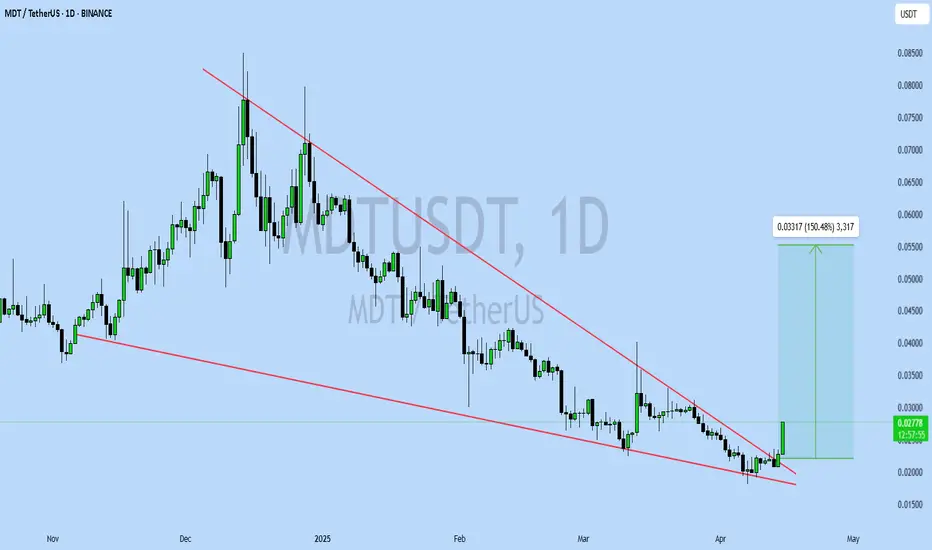
MDTUSDT UPDATEMDT/USDT Technical Setup
Pattern: Falling Wedge Breakout
Current Price: $0.02544
Target Price: $0.0586
Target % Gain: 150.48%
Technical Analysis: MDT has broken out of a falling wedge on the 1D chart with a strong bullish candle and an 11.82% daily gain, confirming momentum. Breakout volume and candle close above resistance support further upside.
Time Frame: 1D
Risk Management Tip: Always use proper risk management.
MDTUSDTWe can attempt to buy MDTUSDT from specified level as it make HL , also there is no bearish divergence occur indicate that it moves upward.
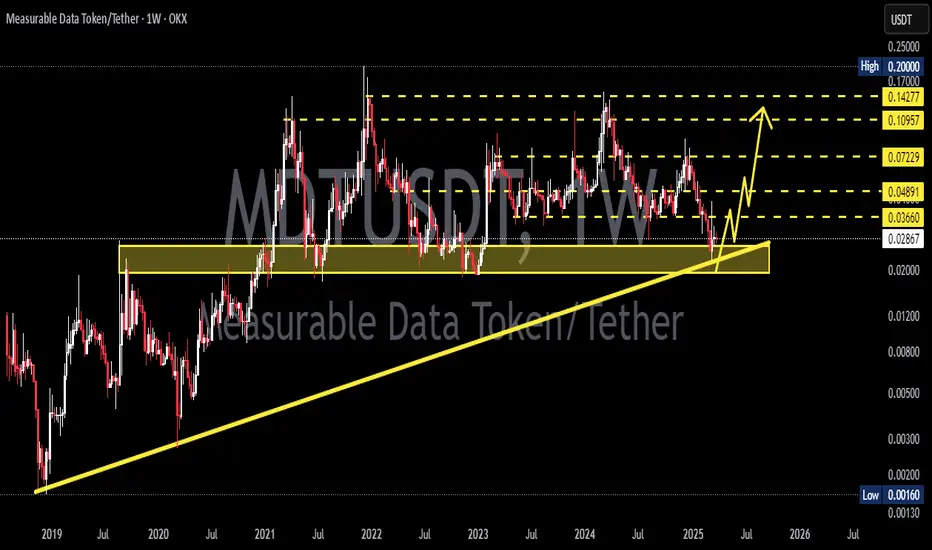
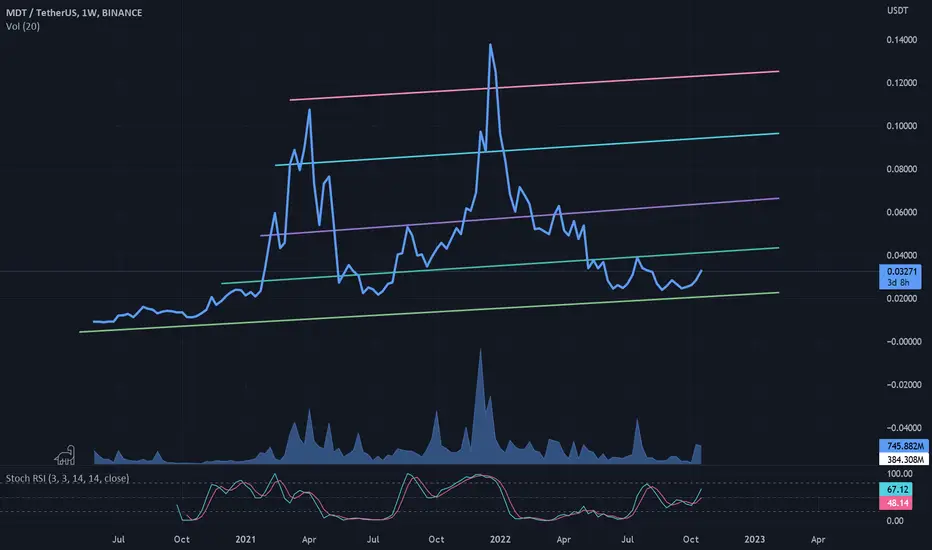
MDTUSDT 1WMDT ~ 1W Analysis
#MDT Trading is very high risk. Buy gradually from here with a short -term target of at least 20%+.
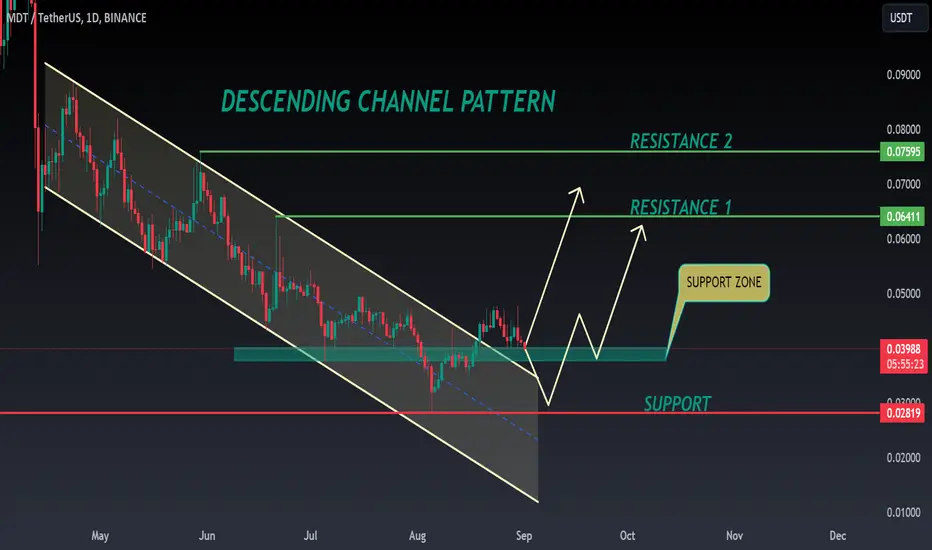
MDT ANALYSIS📊 #MDT Analysis
✅There is a formation of Descending Channel Pattern in daily chart. Currently #MDT is in bearish way.
After a breakout of the pattern and major resistance level we would see a bullish momentum otherwise the price will drop more 🧐
👀Current Price: $0.02980
⚡️What to do ?
👀Keep an eye on #MDT price action and volume. We can trade according to the chart and make some profits⚡️⚡️
#MDT #Cryptocurrency #Breakout #TechnicalAnalysis #DYOR

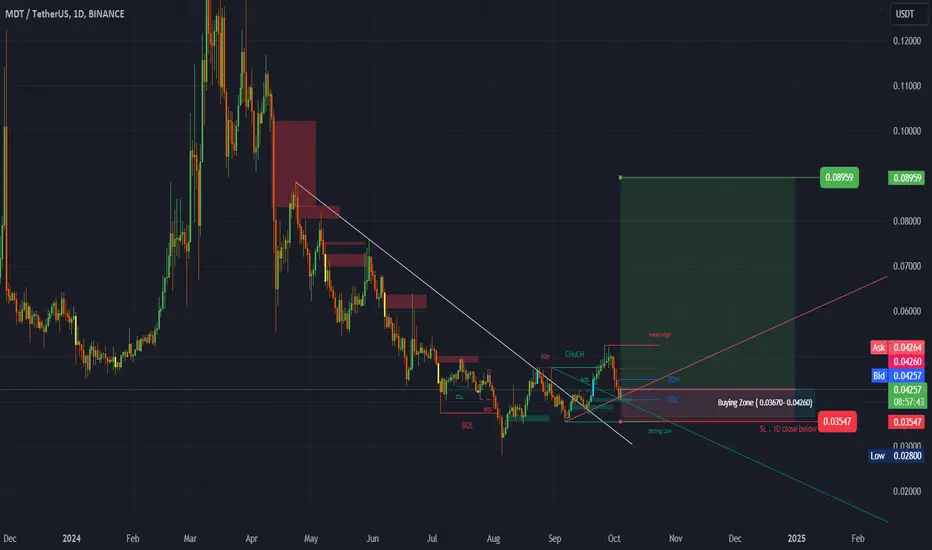
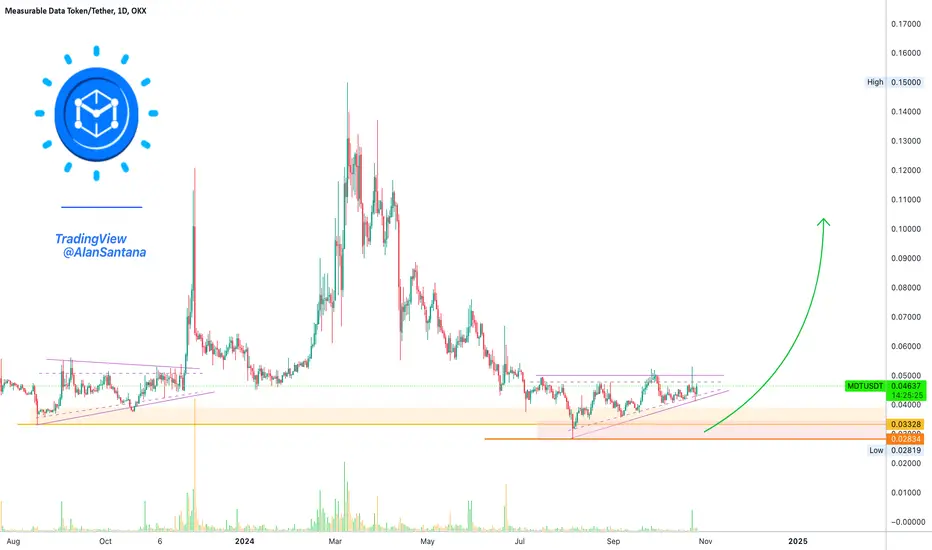
#MDT(SPOT) entry ( 0.03670- 0.04260) T.(0.08959) SL(0.03547)BINANCE:MDTUSDT
entry range ( 0.03670- 0.04260)
Target (0.08959)
SL .1D close below (0.03547)
*** collect the coin slowly in the entry range ***
*** No FOMO - No Rush , it is a long journey ***
**** #Manta ,#OMNI, #DYM, #AI, #IO, #XAI , #ACE #NFP #RAD #WLD #ORDI #BLUR #SUI #Voxel #AEVO #VITE #APE #RDNT #FLUX #NMR #VANRY #TRB #HBAR #DGB #XEC #ERN #ALT #IO #ACA #HIVE #ASTR #ARDR #PIXEL #LTO #AERGO #SCRT #ATA #HOOK #FLOW #KSM #HFT #MINA #DATA #SC #JOE #RDNT #IQ #CFX #BICO #CTSI #KMD #FXS #DEGO #FORTH # AST #PORTAL #CYBER #CLV #RIF #ENJ #ZIL #APT #GALA #STEEM #ONE #LINK #MDT ****
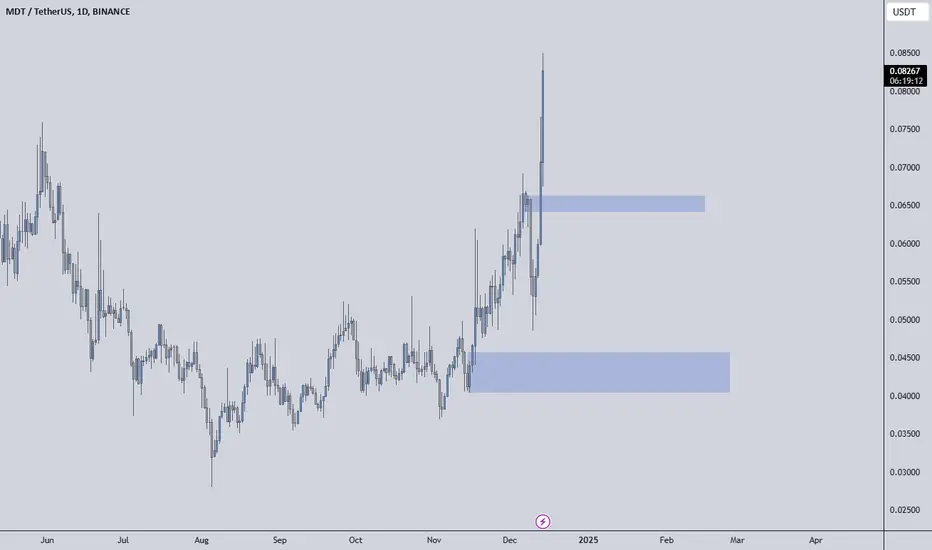
%570 Daily Volume Increase, Huge Opportunity
MDTUSDT is showing a 570% increase in daily volume, indicating a surge in trading activity and presenting a huge opportunity. The blue boxes highlight the best demand zones, where strong buying interest is expected.
Monitor these zones for price reactions or lower time frame market structure breaks to confirm entries. Always trade with proper risk management.
I keep my charts clean and simple because I believe clarity leads to better decisions.
My approach is built on years of experience and a solid track record. I don’t claim to know it all, but I’m confident in my ability to spot high-probability setups.
My Previous Analysis
🐶 DOGEUSDT.P: Next Move
🎨 RENDERUSDT.P: Opportunity of the Month
💎 ETHUSDT.P: Where to Retrace
🟢 BNBUSDT.P: Potential Surge
📊 BTC Dominance: Reaction Zone
🌊 WAVESUSDT.P: Demand Zone Potential
🟣 UNIUSDT.P: Long-Term Trade
🔵 XRPUSDT.P: Entry Zones
🔗 LINKUSDT.P: Follow The River
📈 BTCUSDT.P: Two Key Demand Zones
🟩 POLUSDT: Bullish Momentum
🌟 PENDLEUSDT: Where Opportunity Meets Precision
🔥 BTCUSDT.P: Liquidation of Highly Leveraged Longs
🌊 SOLUSDT.P: SOL's Dip - Your Opportunity
🐸 1000PEPEUSDT.P: Prime Bounce Zone Unlocked
🚀 ETHUSDT.P: Set to Explode - Don't Miss This Game Changer
🤖 IQUSDT: Smart Plan
⚡️ PONDUSDT: A Trade Not Taken Is Better Than a Losing One
💼 STMXUSDT: 2 Buying Areas
🐢 TURBOUSDT: Buy Zones and Buyer Presence
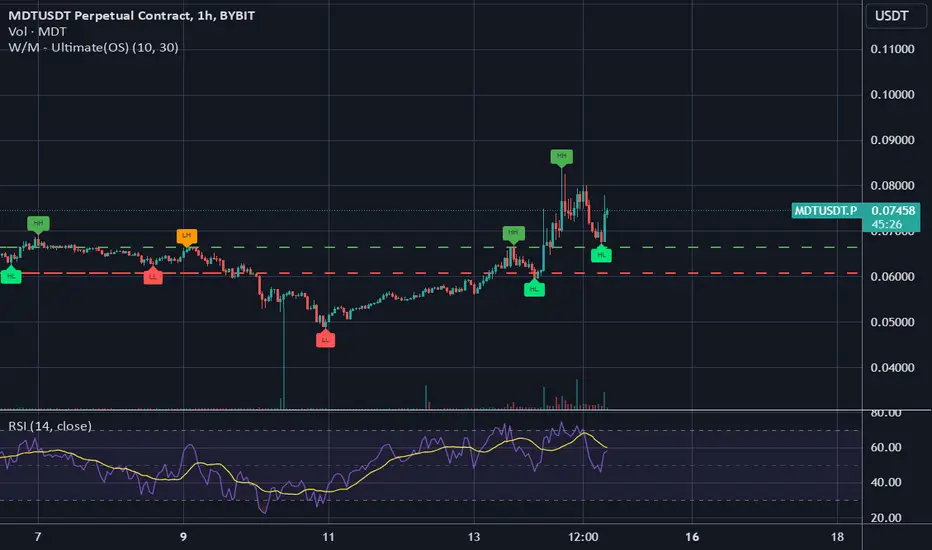
MDT looks very Bullish MDT looking very bullish for target 0.1 and 0.2
MDT is making HH and HL it now is in the bullish phase can give up to 500% return on the principle investments.
The market moves in cycles, which confirms the bullish trend... Up and down, up and down. It has been going down for a year, which is plenty red for the majority of us. When the down-wave is over, a powerful up-wave arrives to balance things out; we should expect higher prices next.
Low risk with high potential return
MDT/USDT #MDT/USDT
NYSE:MDT has broken out of a long-term descending wedge pattern, signaling the potential for a bullish continuation. The breakout above the consolidation area confirms renewed buying interest.
MDT is trading at $0.06341, up 9.55%, reflecting strong bullish momentum.
T1: $0.10352
T2: $0.13328
T3: $0.16583

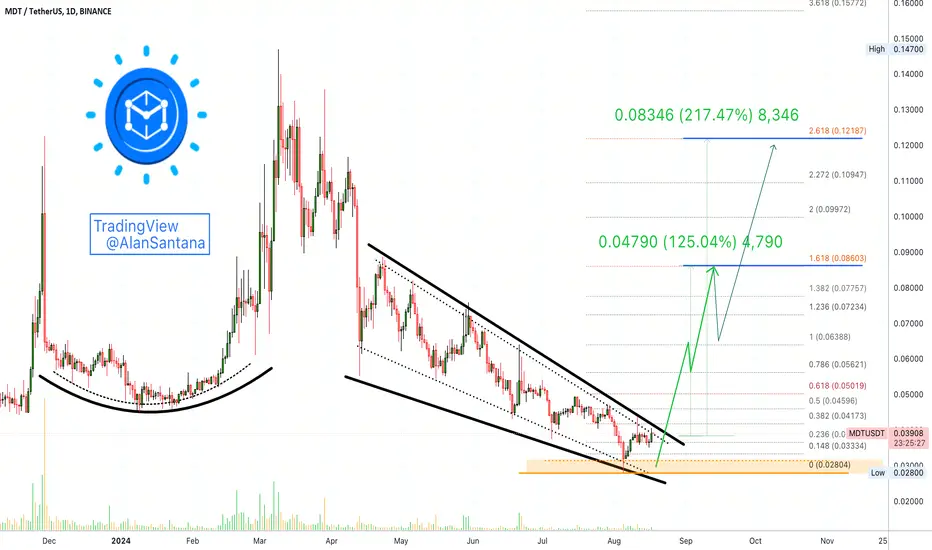
MDT Bullish Wave Can Last 30 Days... ???Since the bullish wave will last only a few weeks, it should be fast and strong; and that's great.
Imagine, 125% or 200%+ within a few days or weeks. RARE grew more than 150% within two days, so everything is possible.
We are looking at a medium-sized relief rally. This is will be the last before the real, the true, 2025 bull-market.
So the rally will lead to another correction and the correction will set the market low. Can be either a higher low or lower low; not much relevance at this point.
After this bottom is in, we will see sustained long-term growth, that is, potentially 8-10 months straight up or even more.
For this present situation, the details are clearly depicted on the chart.
One last thought before leaving: Some of the altcoins mid-size and small, already hit bottom and can be purchased with the major long-term targets in mind. This can be important if you are going to leverage your position. These will produce a higher low in the incoming correction so the position can be built at length starting now. Discernment is important because many will hit a lower low on the next drop and this can be detrimental to your portfolio if not spot.
I will always be available to clear your doubts and to answer your questions if necessary. You do not need to ask, just put the doubt in your mind as you read-me and I shall post a trade-idea with the answer; everything is shared in these trade-ideas.
Namaste.
Measurable Data (MDT)MDT is a decentralized data exchange economy built on the Ethereum Blockchain.
mdt token is a standard ERC 20 token and facilitates the economy of the MDT ecosystem, It denominates the value of big data and serves as mechanism for utility in the ecosystem.
recently Chain announced the acquisition of the MeasurableData platform in a deal worth over $100 million
in a month MDT price moved from 0.025 to 0.036 and today we had 80 million volume
short tg 0.039 , 0.043 , 0.051
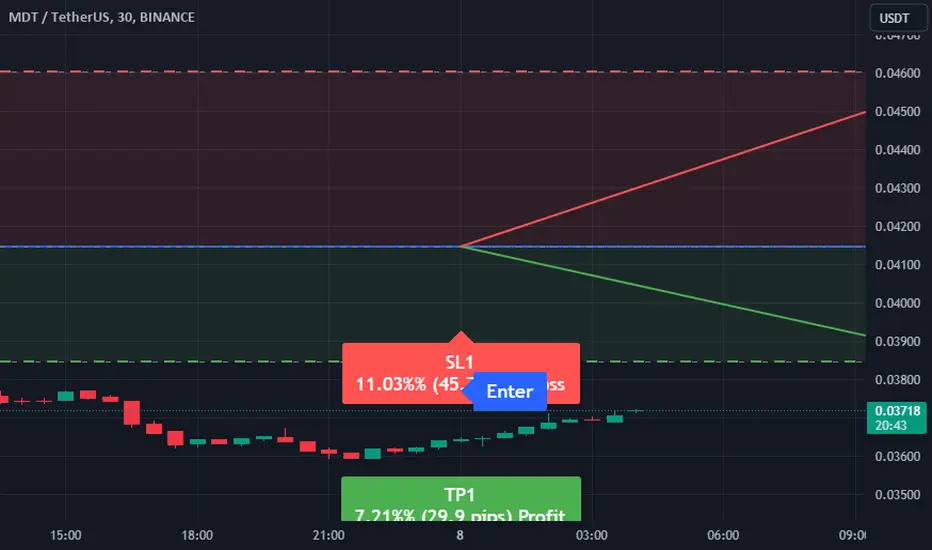
#MDT #USDT Long Set UpLooks like a double bottom with bullish divergence. Short term reversal possible.
Entry - 0.04222
Stoploss - 0.04094
TP-1 - 0.04352
TP-2 - 0.04483

Trade Signal for MDT/USDT: Buy RecommendationDirection: Buy
Enter Price: 0.03997
Take Profit: 0.04076667
Stop Loss: 0.03873667
Analysis and Justification:
Our recommendation to enter a Buy position for the MDT/USDT trading pair is based on the comprehensive assessment provided by our strategy, EASY Quantum Ai. Here are the factors that contributed to our decision:
1. Technical Indicators: Our analysis identified a bullish trend in MDT/USDT, with key technical indicators such as the Moving Average Convergence Divergence (MACD) and Relative Strength Index (RSI) showing upwards momentum. This suggests a strong likelihood of continued upward movement.
2. Market Sentiment: Current market sentiment is favorable for MDT, supported by positive developments surrounding the project and increased trading volumes. This sentiment tends to drive the price higher.
3. Support and Resistance Levels: The entry price is strategically placed above a strong support level, which provides a cushion against downward volatility. The Take Profit target aligns with a significant resistance level, optimizing profit potential while the Stop Loss is set conservatively to manage risk.
By leveraging the EASY Quantum Ai strategy, this signal aims to capitalize on anticipated market movements with a calculated approach to risk and reward. Always ensure to do your own due diligence and be mindful of market volatility.

Measurable Data Token Ready To Move Forward: Easy ProfitsMDTUSDT is done with its consolidation. It has been sideways for more than 2.5 months. This pair recently produced a reversal pattern, the exact same price dynamics produced in late 2023. Needless to say, after the reversal pattern and consolidation phase in 2023, a strong bullish wave followed. Seeing all of the same signals coming up now can alert us of a strong breakout, a strong bullish wave.
This pair can easily double or triple in value in a matter of days/weeks. The double-up can happen fast, as a strong initial bullish breakout. The triple or more can take a while because after the initial breakout there is always a retrace that ends in a higher low before additional growth, like November 2023.
This will be a nice one. Easy profits.
Namaste.
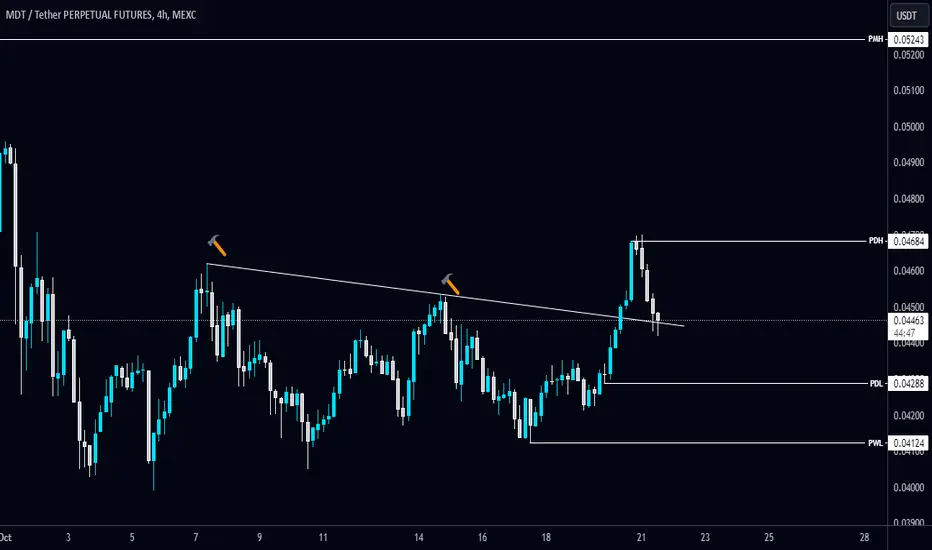
#MDT/USDT breaks the Diagonal Trendline and holds above it in 4-#MDT/USDT breaks the Diagonal Trendline and holds above it in 4-Hour TF!
NYSE:MDT needs to hold this trendline to remain bullish. The local resistance level is PMH $0.05243, and the support level is PWL $0.04124.
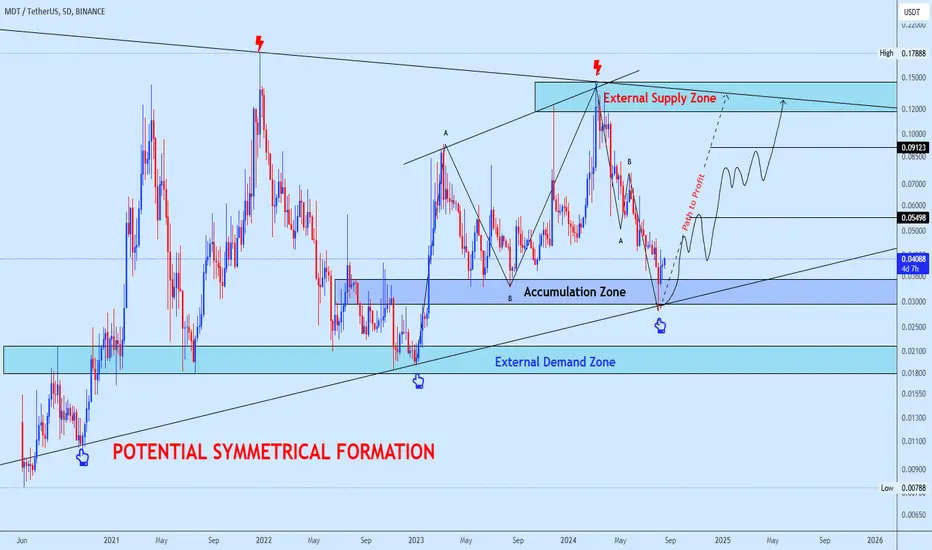
MDTUSDT Buy opportunityMDT/USDT is forming a potential symmetrical triangle, with the price bouncing off the bottom trendline. This current zone serves as a favorable buy-back area, with the expected price movement outlined on the chart. Enjoy!
Trading Signal for MDTUSDT: Sell OpportunityAttention traders! We have identified a potential SELL opportunity for the currency pair MDTUSDT based on our analysis.
Specifications of the trade are as follows:
- Direction: Sell
- Enter Price: 0.04145
- Take Profit: 0.03846
- Stop Loss: 0.04602
Our forecast suggests that the price movement for MDTUSDT is expected to trend downwards. This analysis has been conducted using the EASY Quantum Ai strategy. Several key factors contribute to this projection:
1. Technical Indicators: Our AI has identified a convergence of multiple bearish signals, including moving average crossovers and momentum indicators showing downward pressure.
2. Market Sentiment: Current market sentiment and trading volume trends indicate a higher number of sell orders compared to buy orders, suggesting bearish market dynamics.
3. Support and Resistance Levels: The identified enter price lies close to a pivot zone that has historically seen resistance, making it an optimal point for initiating a sell position.
4. Risk Management: The defined Take Profit and Stop Loss levels ensure that the trade has a favorable risk-to-reward ratio, maximizing potential gains while limiting losses.
Stay vigilant and make sure to execute the trade at the specified enter price for optimal outcomes. Always manage your risk appropriately and adapt to any market changes swiftly.
Happy Trading!
Your Trading Team
MDT ANALYSIS🔮 #MDT Analysis 🚀🚀
As we can see that #MDT was trading in a descending channel and given a breakout and also retesting the levels. We can see bullish movement or a reversal from its crucial support zone 💸 💯🚀
💸Current Price -- $0.03980
📈Target Price -- $0.07600
⁉️ What to do?
- We have marked crucial levels in the chart . We can trade according to the chart and make some profits. 🚀💸
#MDT #Cryptocurrency #DYOR
MDTUSDT.1DAnalyzing the daily chart of MDT/USDT (Measurable Data Token paired with US Dollar Tether), I note several key technical details and their implications on potential trading strategies:
Trend Analysis
The chart depicts an overarching bearish trend since April, with price peaks progressively declining. This downtrend was temporarily challenged by recent upward movements, but the price has yet to convincingly break the descending trendline (S1), which continues to act as dynamic resistance.
Support and Resistance Levels
R1 ($0.04800): This resistance level has been tested multiple times, most recently in early August. It's a crucial marker for any bullish reversal.
R2 ($0.05605): Slightly higher, R2 represents a significant historical resistance level. A break above R1 with substantial volume could see prices testing this higher resistance.
S2 ($0.03350): Currently acting as the nearest support. It's important because it held during the latest bearish momentum in July, suggesting a potential bounce-back point if retested.
Technical Indicators
MACD: The Moving Average Convergence Divergence is showing a slight bullish crossover, though the histogram is near zero, indicating a potential shift in momentum but with limited strength.
RSI: The Relative Strength Index is around 47.51, which is neutral. It neither suggests overbought nor oversold conditions, indicating a balance in buying and selling pressures.
Current Market Position
The price at around $0.04399 is slightly above S2 and below R1. The recent price action suggests a tentative recovery, but the ongoing pressure from the descending trendline (S1) and resistance at R1 caps upward movements.
Trading Strategy
Given the market's position, a cautious approach is warranted. Watching how the price behaves around the descending trendline S1 will be key. A breakout above this trendline with a clear close above R1 could signal a change in the prevailing bearish trend and might offer a buying opportunity with a target of R2, placing a stop-loss just below S2.
Conclusion
In summary, MDT exhibits signs of potential recovery within a broader bearish context. A conservative trading strategy would be to wait for a confirmed breakout above key resistance levels before entering long positions. Additionally, keeping an eye on the MACD and RSI for stronger bullish signals could help refine entry and exit points. As always, traders should be prepared to adjust their strategies based on evolving market conditions.
