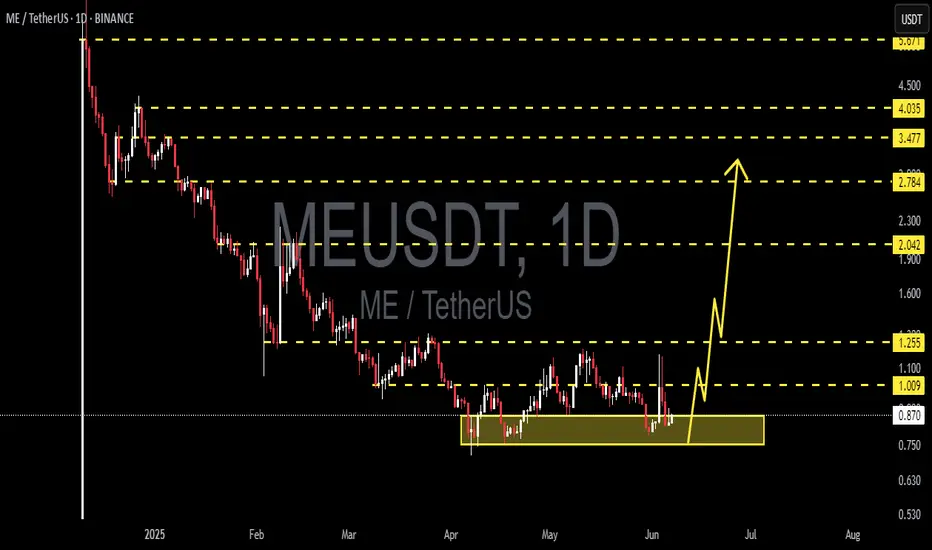
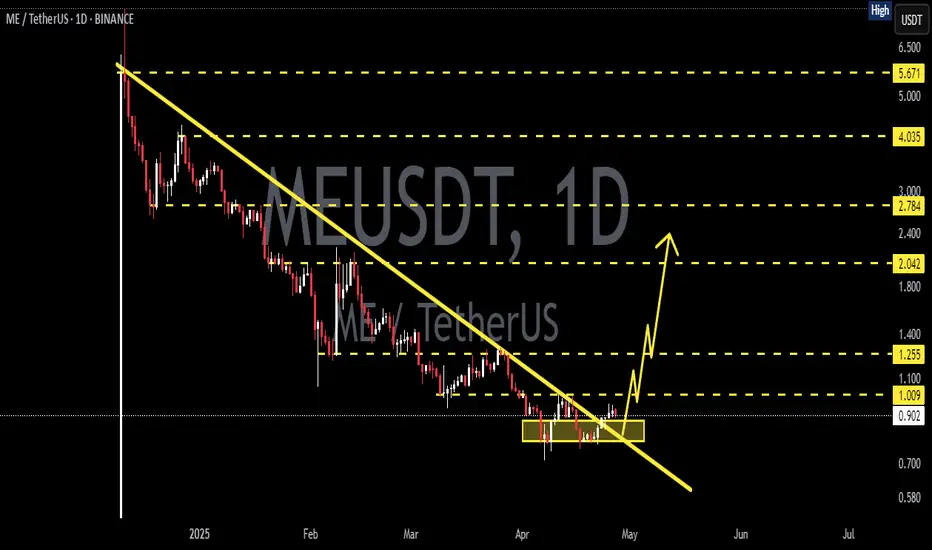
MEUSDT 1D AnalysisME ~ 1D Analysis
#ME This trade is very high risk
Buy gradually from here with a short term target of at least 15%+ from here.
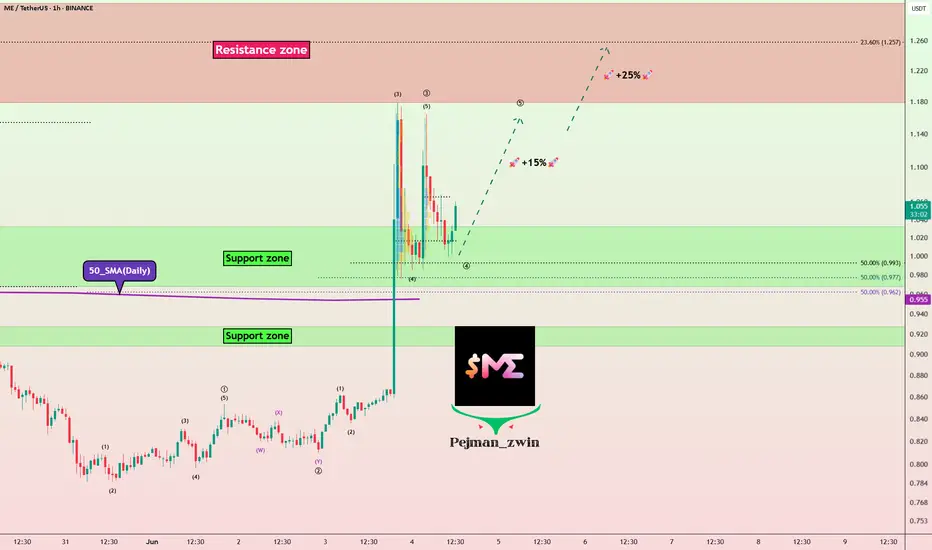
Magic Eden’s ME Token Eyes Bounce After Trump Wallet VolatilityOn June 3, , Magic Eden ( BINANCE:MEUSDT ) announced a collaboration with a project called to launch a new" Trump Wallet "
This announcement triggered a + 35% price increase , pushing the price of ME Token to approximately $1.17 .
However, shortly afterward, members of the Trump family, inclu
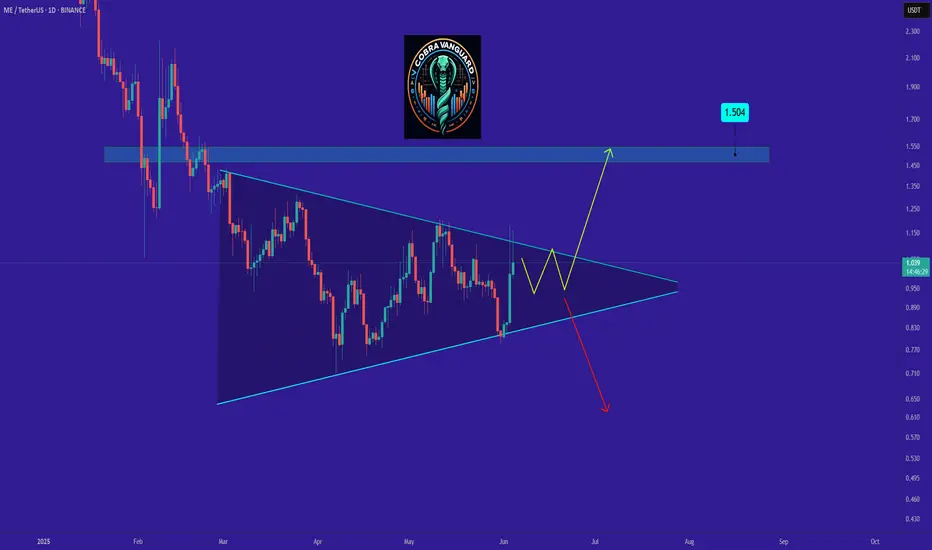
Me !!!The price on the daily timeframe is within a triangle, which can create some uncertainty about which direction it will move. Here, we should wait to see which side of the triangle the price breaks out from. Remember, the trend is our friend.
Best regards CobraVanguard.💚
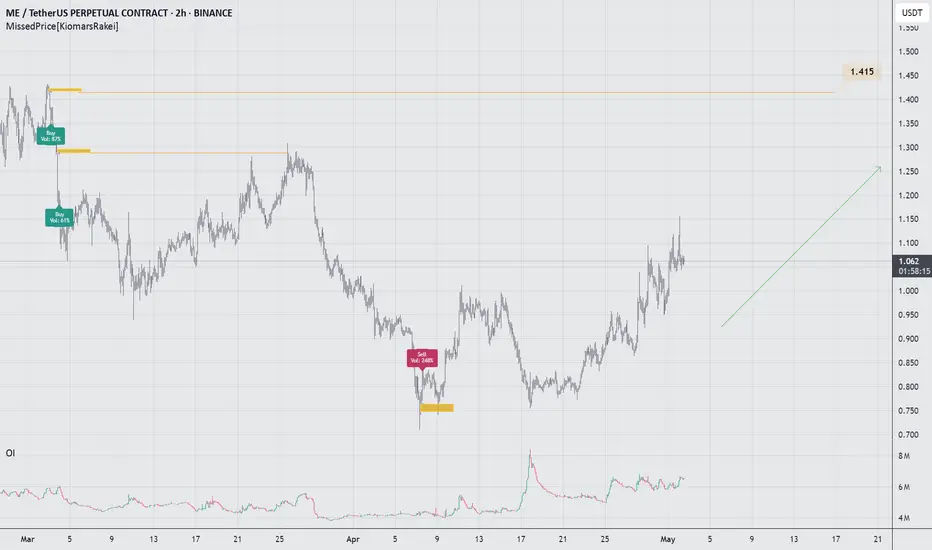
ME Likely to Revisit 1.415 ZoneBased on the MissedPrice concept, rapid price moves often skip levels that price later revisits. The 1.415 level shows an Open Interest leap, suggesting missed positions.
MEUSDT 1D AnalysisME ~ 1D Analysis
#ME This trade is very high risk
Buy from here if you still have a Conviction on this coin with a short -term target of at least 10%+.
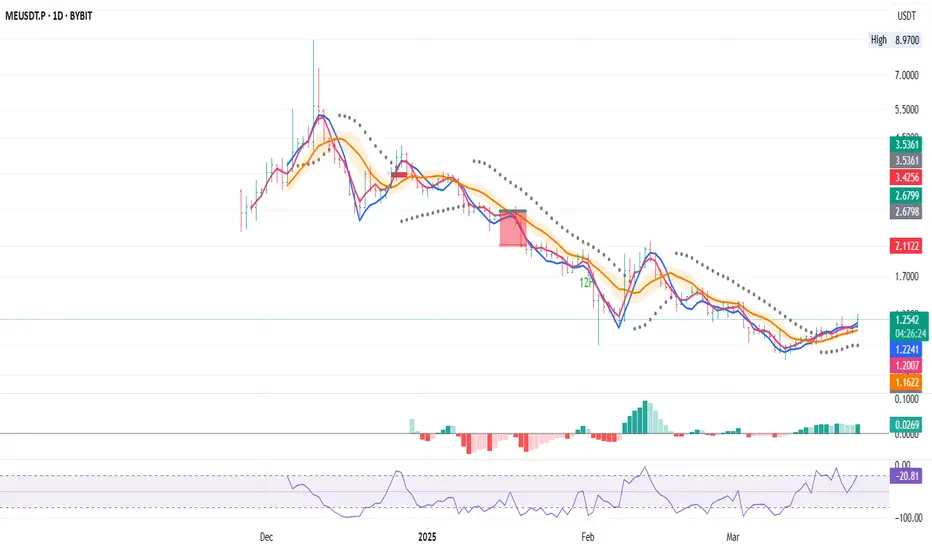
MetaUnit | Long Entry signal for MEU/USDT Analysis:
MLR > SMA: The MLR (blue) is above the SMA (pink), signaling a bullish trend.
MLR > BB Center: MLR exceeds the Bollinger Bands Center Line (orange), showing strong bullish momentum.
PSAR: PSAR dots (black) are below the price, reinforcing the uptrend.
No SMA 200: SMA 200 unavailable - p
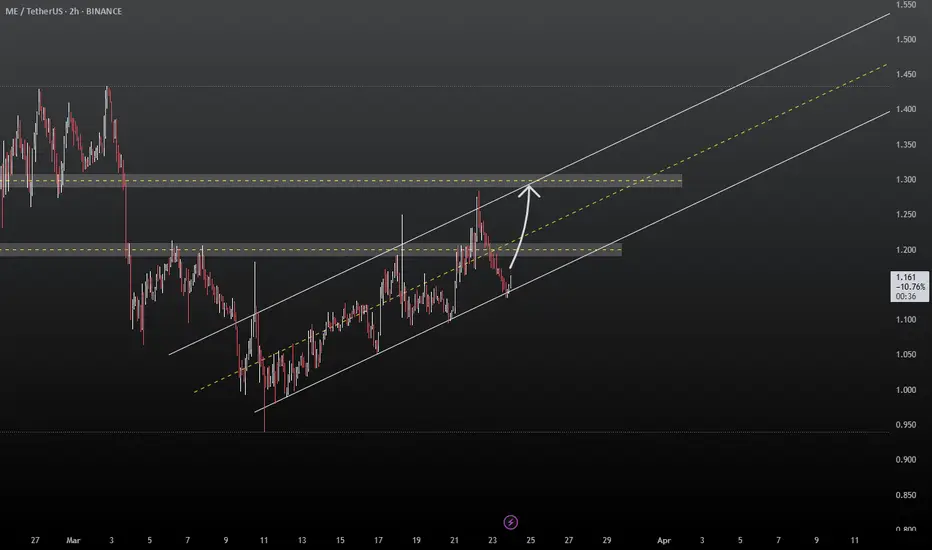
MEUSDT: Ascending Channel - Is $1.300 the Next Stop?Fellow traders!
MEUSDT is exhibiting classic ascending channel behavior. Having tested the lower channel boundary, the price is likely to advance towards the upper channel boundary, with a potential target near $1.300.
Implement prudent risk management.
BINANCE:MEUSDT
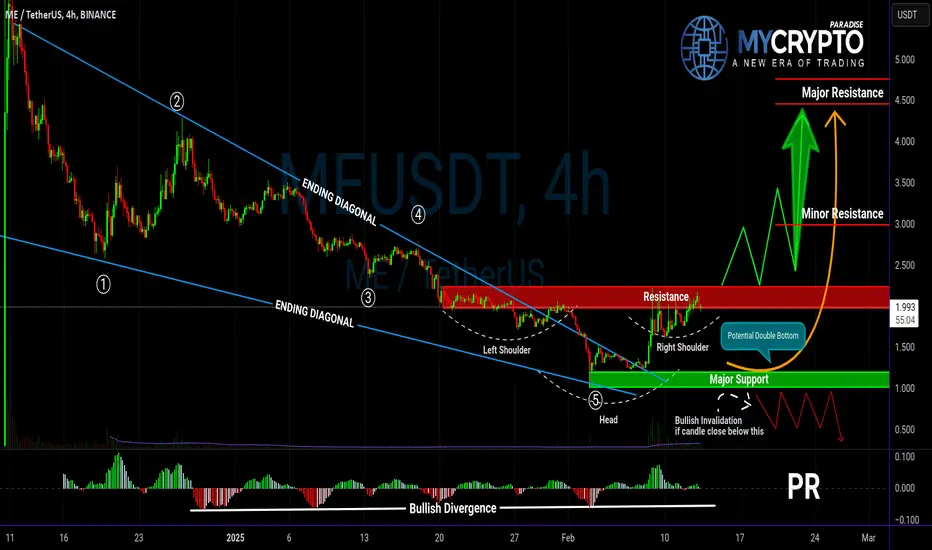
MEUSDT Ready to Explode or Another Bull Trap?Yello, Paradisers! Are we about to witness a strong bullish reversal on MEUSDT, or is another trap being set? Let’s break it down.
💎MEUSDT has formed a well-structured ending diagonal with a clear 5-wave pattern, increasing the probability of an upcoming bullish move. Additionally, the inverse head
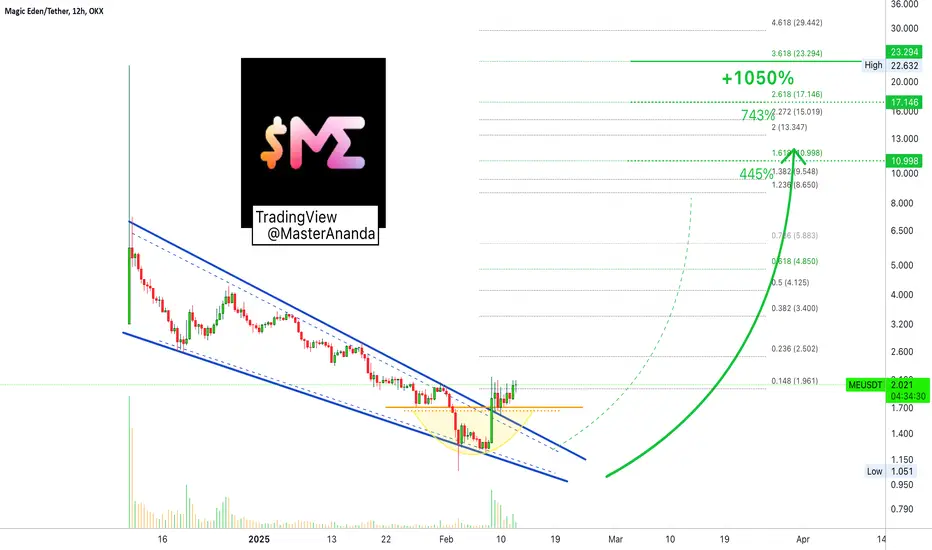
Magic Eden: Looks Promising (1,050% Potential Revealed/Mapped) This is a short-term chart but I don't care. It is very clear that MEUSDT (Magic Eden) broke out of a major downtrend. This downtrend was active since last December 2024.
Good afternoon living Spirit, how are you feeling now?
Notice the blue lines on the chart, a falling wedge pattern.
The upper l
MEUSDT Falling Pattern Breakout with 200%-250% Potential GainsMEUSDT has recently broken out of its Falling Pattern, signaling the potential for a strong price rally. A Falling Pattern often sets the stage for a reversal, and with the breakout now complete, MEUSDT is poised to enter a bullish phase. The pattern, which typically consists of lower lows and lower

See all ideas
Summarizing what the indicators are suggesting.
Oscillators
Neutral
SellBuy
Strong sellStrong buy
Strong sellSellNeutralBuyStrong buy
Oscillators
Neutral
SellBuy
Strong sellStrong buy
Strong sellSellNeutralBuyStrong buy
Summary
Neutral
SellBuy
Strong sellStrong buy
Strong sellSellNeutralBuyStrong buy
Summary
Neutral
SellBuy
Strong sellStrong buy
Strong sellSellNeutralBuyStrong buy
Summary
Neutral
SellBuy
Strong sellStrong buy
Strong sellSellNeutralBuyStrong buy
Moving Averages
Neutral
SellBuy
Strong sellStrong buy
Strong sellSellNeutralBuyStrong buy
Moving Averages
Neutral
SellBuy
Strong sellStrong buy
Strong sellSellNeutralBuyStrong buy
Displays a symbol's price movements over previous years to identify recurring trends.