Apple to $195ishApple has essentially rode the dip back down to previous highs. The next lowest high is around $195.34 or so.
Could that be the floor in this dip?
1AAPL trade ideas

APPLE STOCK , we are in a good area to think in a buyIt is a good support area ( value area), and I will wait a bull candle with volume to buy this stock, for swing trade
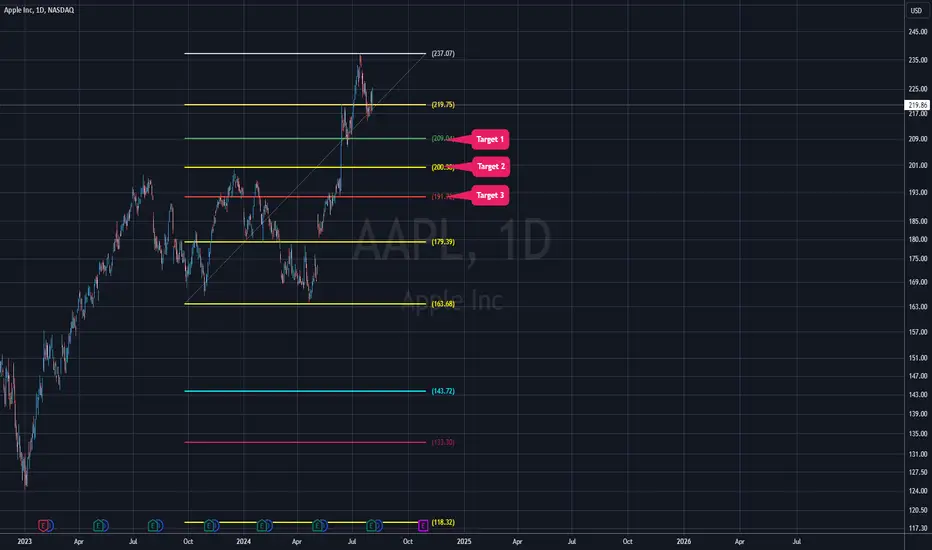
$AAPL Correction to persistI'm currently seeing a partial pullback,
gauging AAPL's current pullback and comparing it to historical pullbacks and current market conditions.
I forsee $appl at 209,
And quite possibly 200,
and even as step as 191
This will all depend on market's liquidity testing, but overall, I'd opt for aapl puts over aapl calls.
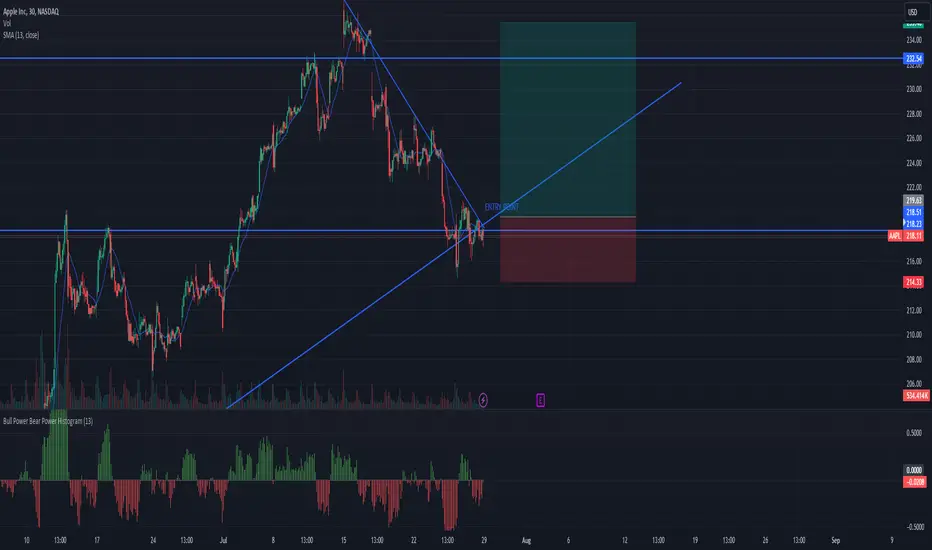
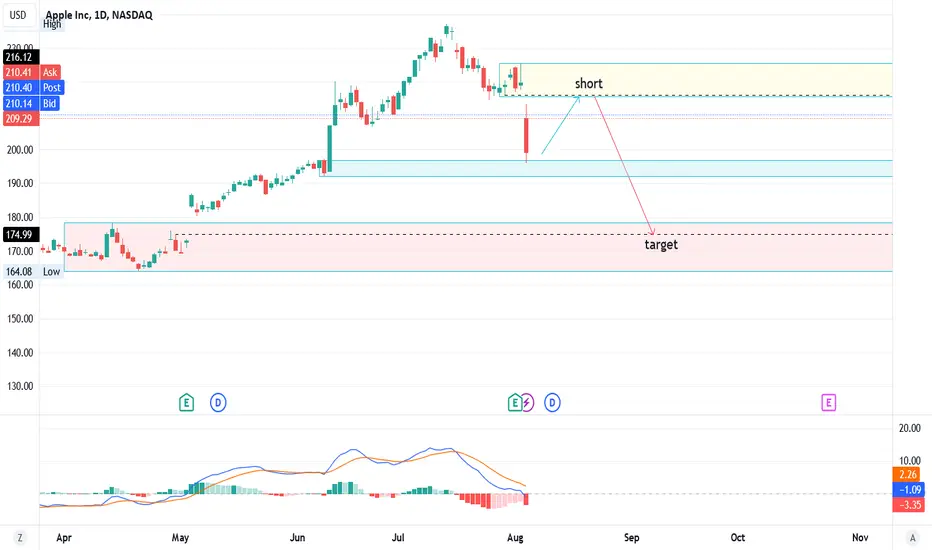
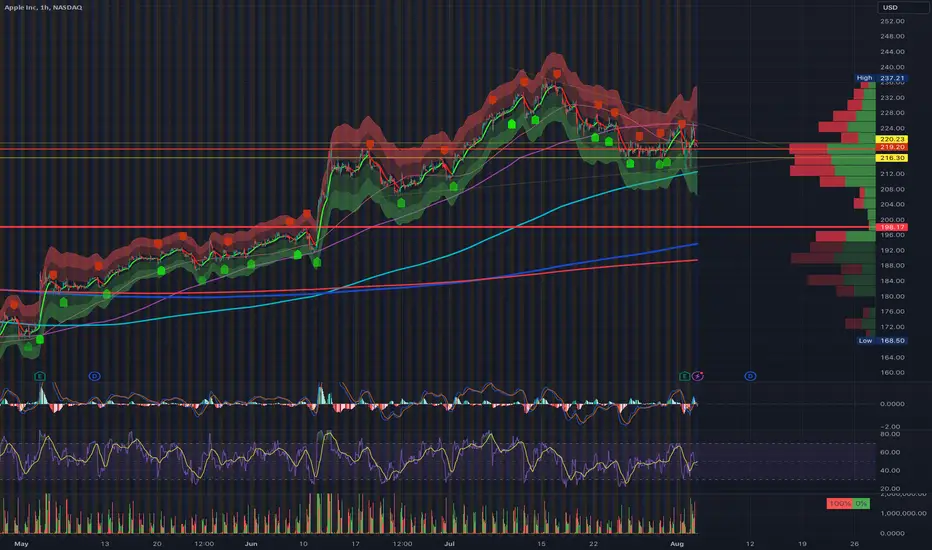
AAPL I expect an up correction to the short zoneAAPL I expect an up correction to the short zone, the price level of the zone is 216 to 225.6 and further down to the pink zone
Time to short, TP 208.53Following daily and got a short signal from my indicator.
TP1 214.62
TP2 208.53
SL Stop above 222 candle close.

Possible head & Shoulders AAPL Daily Head & Shoulders pattern possibility. Note pattern extension to $203.43 and Gap Fills above and below. Slight divergence. Bias 1.33/1 Sellers.
Good Luck Traders!

Is APPL priced to perfection?
NASDAQ:AAPL
It's really starting to feel like AAPL is getting ahead of itself here. Sure, their recent earnings report looked decent, but I think some big takeaways are the decrease in China sales and decrease in iPhone sales. Sure, their services revenue will continue to increase and their buyback props up the stock, but there has been no true innovation in this company. False hopes of an Apple car, now an overpriced VR headset, and iOS that will incorporate other companies' LLMs?
Everyone is talking about the next upgrade cycle like it's going to change the outlook of the company. Yeah, Siri might improve, but there won't be any drastic impact on productivity with this first iteration.
With all that said, it looks as though the stock is starting to settle down. Recent reports of Warren Buffett halving his stake in AAPL will likely translate to further downward pressure on this stock.
AAPL has recently broken below the 20-day MA, retested, but failed to break back above. Now it is sitting between the 20 and 50-day MA. If it breaks below its 50-day MA, it will likely retest previous ATH support.
My plan is to buy puts in the short term and hope for a pulldown towards $198.
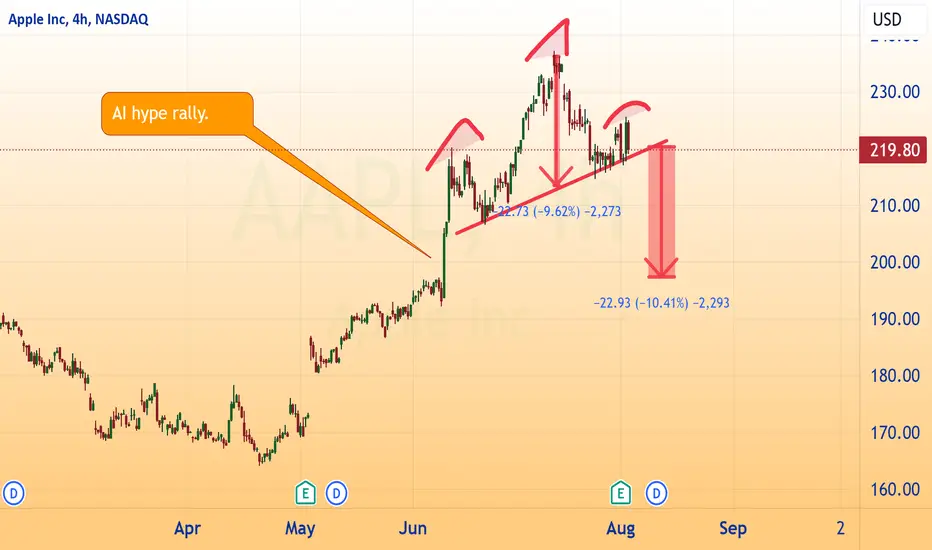
The H&S Top Projects to the Beginning of the AI Hype RallyThis weekend 2 bad news items came out about AAPL. Warren Buffett selling more stock than expected and the first AI reviews are lousy. Ironically, if the H&S does work, it projects to the beginning of the AI hype.
Apple - Technically OverboughtI saw in the news that Mr. Buffet sold half of his ownership stake in Apple. In reality, he made the perfect decision to sell his Apple stock at a time when the market was technically overbought. It is without question. When he believes the price of Apple stock is appropriate, he will most likely repurchase the shares.

Apple Roadmap Oct 2023Apple is the largest and most important stock in the market. It does appear with limited short term downside

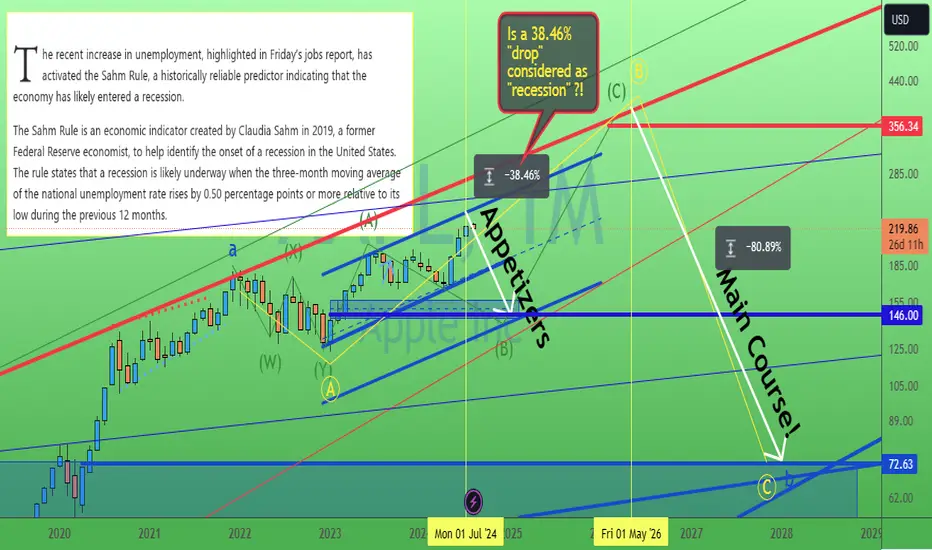
Apple. Oh My the apple appetizers served early on 2024 not 2025?APPL! Oh my god! Warren Buffett just "dumped" more than 50% of his "rotten" apple from his fruit basket. Sound good for "harvesting" time?! As told by Claudia Sahm rule?
H5 AAPL bearishI'm using the H5 timeframe to determine the POI for a long position. I estimate it will reach level 182 in the future.
Apple Stock Defies Market Downturn with Strong Q3 PerformanceIn a day marked by a broad-market selloff, Apple Inc. ( NASDAQ:AAPL ) stood out as a beacon of resilience and strength. The tech giant’s shares rose on Friday, buoyed by its impressive fiscal third-quarter results that surpassed Wall Street’s expectations. Here’s a closer look at Apple’s recent performance and what it means for investors.
Stellar Earnings Report
Apple reported a 4.9% year-over-year increase in revenue for the quarter ending June 29, reaching $85.8 billion. This growth was primarily driven by a 14.1% surge in services revenue, which hit $24.2 billion. Earnings per share (EPS) also saw a notable increase, rising 11.1% to $1.40, significantly above the anticipated $1.35 per share.
"During the quarter, our record business performance generated EPS growth of 11 percent and nearly $29 billion in operating cash flow, allowing us to return over $32 billion to shareholders," said Luca Maestri, Apple’s Chief Financial Officer. "We are also very pleased that our installed base of active devices reached a new all-time high in all geographic segments, thanks to very high levels of customer satisfaction and loyalty."
Key Performance Metrics
- Mac Sales: Increased by 2.5% to $7 billion.
- iPad Sales: Surged by 23.7% to $7.2 billion.
- iPhone Sales: Slight decline of 0.9% to $39.3 billion.
- Wearables, Home, and Accessories: Decreased by 2.2% to $8.1 billion.
The growth in services and devices sales highlights Apple's diverse revenue streams, which continue to drive overall financial health despite minor setbacks in iPhone sales.
Market Reactions and Future Outlook
Wall Street reacted positively to Apple’s robust financial performance, with the stock gaining ground in a market otherwise dominated by losses. Since early May, following the announcement of a substantial stock buyback program, Apple’s shares have climbed nearly 32%. The consensus among analysts remains bullish, with an average target price of $231.32, indicating a potential upside of about 4% from current levels. Notably, Needham has set a higher price target of $260, suggesting over 16% growth potential.
Needham analyst Laura Martin highlighted Apple’s strategic focus on leveraging its vast installed base of more than 1.25 billion wealthy consumers. "We believe Apple’s goal is to grow long-term volume through increasing the average revenue per user and lowering churn levels by up-selling its users into additional devices and services," Martin noted.
Strategic Initiatives
Apple’s strategy of enhancing its ecosystem through increased services and product integration continues to pay off. The company’s commitment to returning value to shareholders through stock buybacks and dividends further solidifies its position as a stable and attractive investment.
On the conference call, Maestri projected similar revenue growth rates for the fourth quarter, including double-digit growth in services. This positive outlook underscores the company’s ability to navigate economic uncertainties and maintain its growth trajectory.
Conclusion
Despite a turbulent market environment, Apple’s strong fiscal third-quarter results and strategic initiatives have positioned it well for continued success. The tech giant’s ability to deliver impressive earnings, maintain high customer loyalty, and execute effective growth strategies makes it a compelling stock for both current and potential investors.
As Apple continues to innovate and expand its services, it remains a cornerstone of stability and growth in the tech sector. With Wall Street's confidence and a solid roadmap ahead, Apple’s stock is poised to keep delivering value to its shareholders.

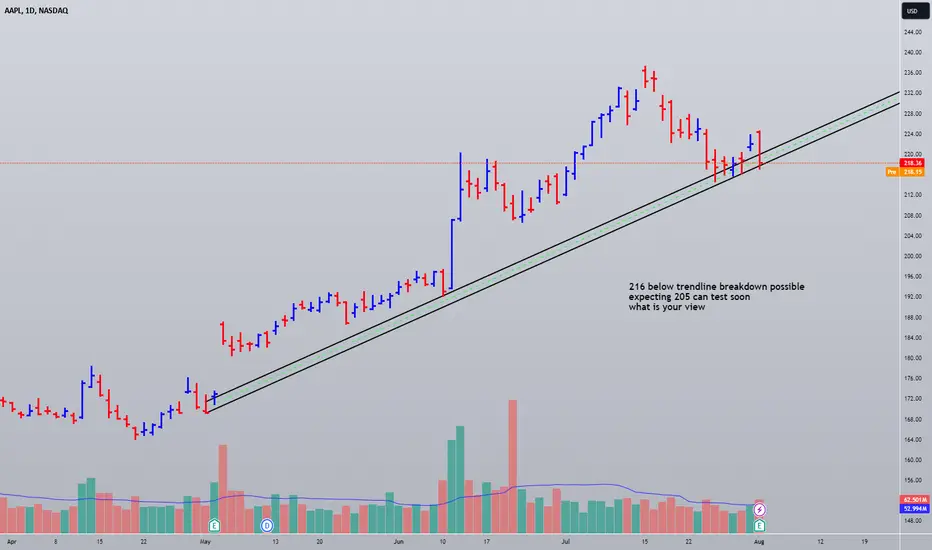
AAPL trendline breakdown possible . US Stock216 below trendline breakdown possible
expecting 205 can test soon
what is your view
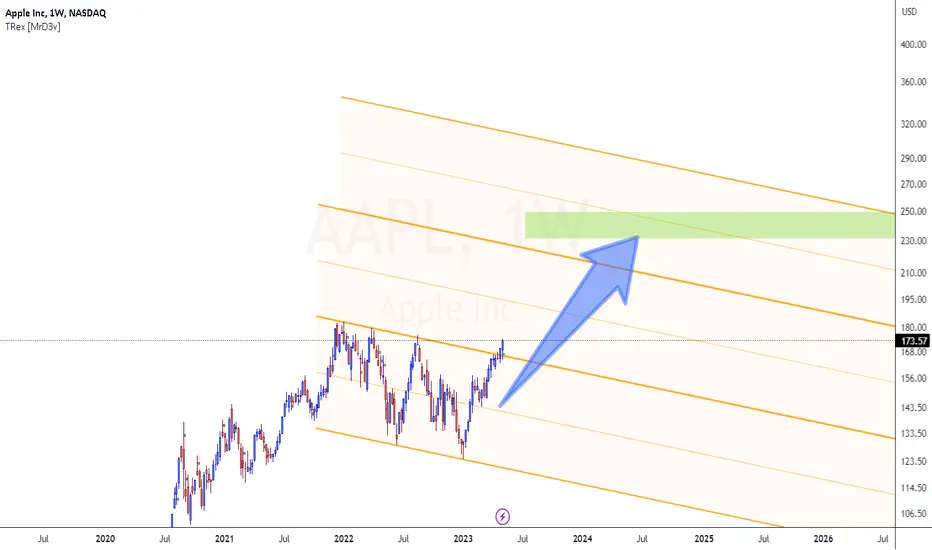
APPLE Dont get fooled by the short-term pull-back. $280 on trackExactly 3 months ago (May 02, see chart below), we called for a strong buy signal on Apple (AAPL) and it dully delivered as 2 days ago the stock completed three straight green months with a new All Time High (ATH):
The recent weekly pull-back shouldn't allow you to diverge from the bigger picture and on this analysis we look at it from a 1M time-frame perspective. As you can see, as long as the 1M MA50 (blue trend-line) holds, Apple will continue to be on a 15-year uptrend, which shows very distinct Phases.
Right now we are on the Channel Up that followed the 2022 Inflation Crisis, which was a similar correction to 2015 - 2016 (China's slowdown). The Channel Up that followed peaked at +161% before the next correction towards the 1M MA50. Even the 2013 - 2014 rise was still +145%.
As a result, we don't believe the current Channel Up to be over either, expecting a peak closer to 300. Our Target is marginally below it at $280.00.
-------------------------------------------------------------------------------
** Please LIKE 👍, FOLLOW ✅, SHARE 🙌 and COMMENT ✍ if you enjoy this idea! Also share your ideas and charts in the comments section below! This is best way to keep it relevant, support us, keep the content here free and allow the idea to reach as many people as possible. **
-------------------------------------------------------------------------------
💸💸💸💸💸💸
👇 👇 👇 👇 👇 👇