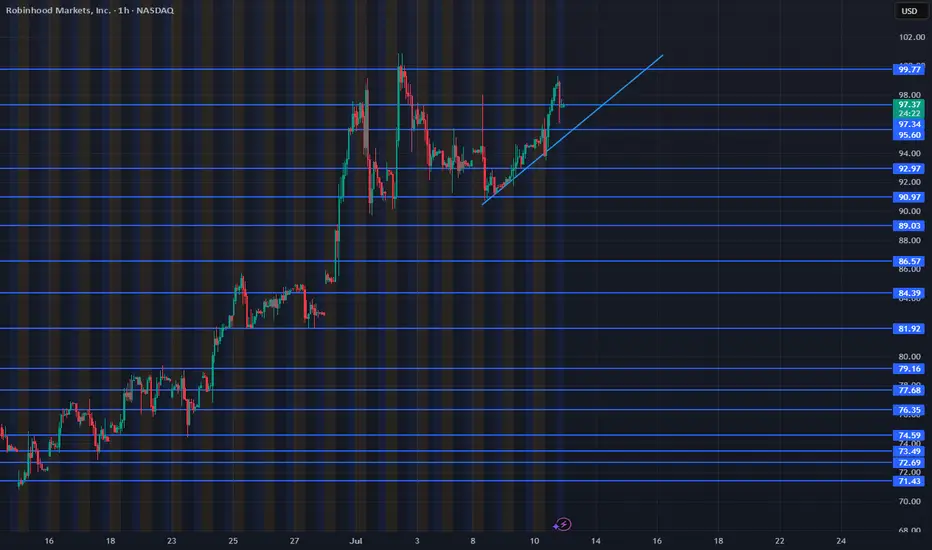
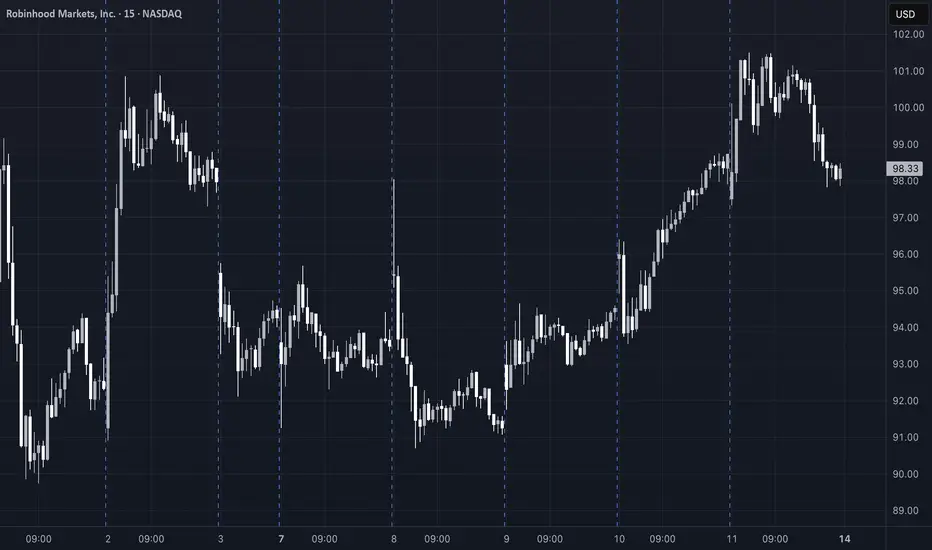
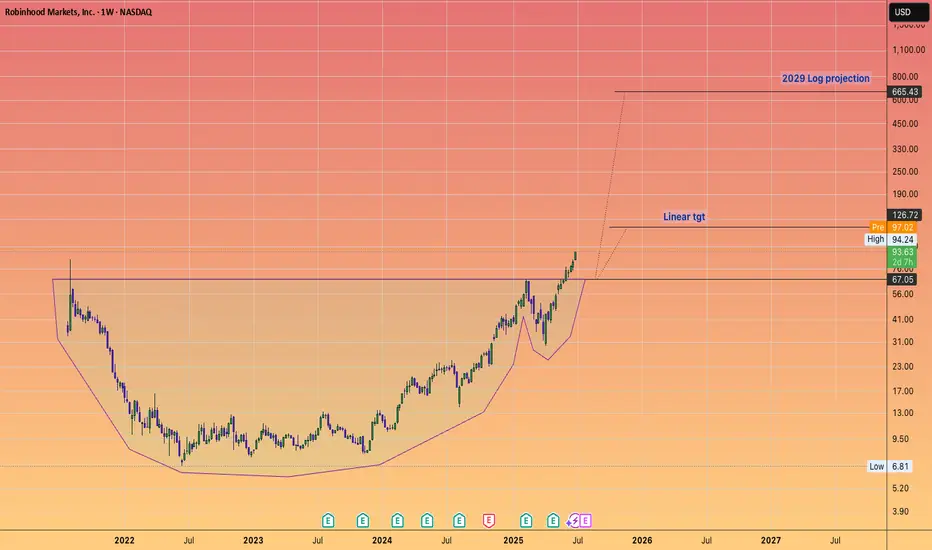
Trade Idea: $HOOD – $106C by 7/25 | Bullish Setup🧠 Thesis:
After topping out at $100, NASDAQ:HOOD pulled back ~10%. I believe this recent pullback sets up a healthy base for a continuation move back toward $100+ in the coming sessions. If momentum kicks in, we could see a push toward the $106 level by expiration.
📊 Key Levels:
Resistance: $95.60 → $97.34 → $99.77 → $102 → $106
Support: $94.00 (uptrend line), $92.97 (higher low), $90.97 (must hold for bulls)
📌 Trade Strategy:
I'm scaling into the $106 Calls expiring 7/25.
Looking for:
A breakout above $97.34 to trigger upside momentum
Profit-taking zones around $99.77 and $102
Final target near $106 (ITM zone)
Risk is managed below $92.97.
🧭 Notes:
Watching broader market sentiment and NASDAQ:QQQ correlation closely. Volume confirmation will be key on any breakout attempts.
1HOOD trade ideas
HOOD — In Key Macro Resistance ZonePrice has reached a major resistance zone, with the 110 level marking an ideal spot where downside pressure may begin to dominate and a mid-term top could start forming. Macro support for the macro-uptrend structure is at the 80–65 area.
Hedging near current levels may be prudent - especially ahead of earnings and while volatility remains relatively cheap.
Weekly view
Daily view:
Thank you for your attention and I wish you successful trading decisions!
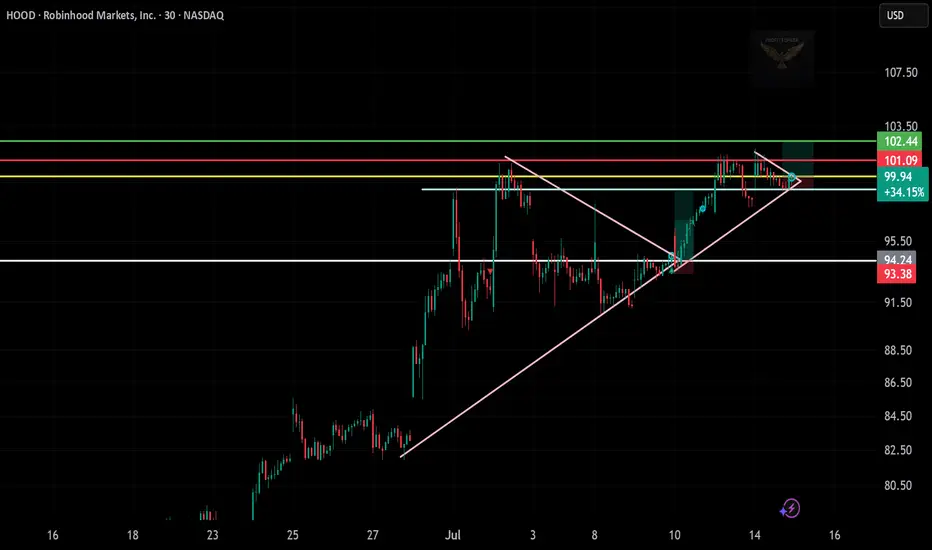
HOOD Breakout Watch – Eyeing $103+
🧠 Chart Breakdown:
Setup: Price broke out of a large ascending triangle and is now forming a mini symmetrical triangle — a consolidation before a possible continuation.
Current Price: $99.94
Breakout Zone: Near $100, close to decision point.
📊 Key Levels:
Immediate Resistance:
$101.09 (yellow)
$102.44 (first green target)
$103.50 (final target zone)
Support Levels:
$94.74 (white line)
$93.38 (stop-loss zone)
🎯 Trade Idea (Bullish Bias):
Entry: $100.00
Target 1: $102.44
Target 2: $103.50
Stop-Loss: Below $94.74
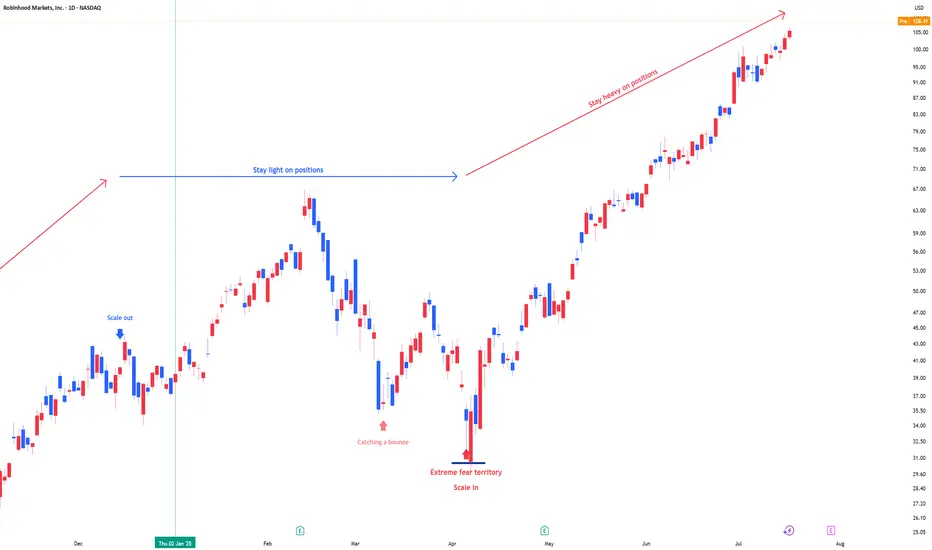
RobinHood Markets: Stay heavy on positionsHOOD position size is adjusted in line with US market signals for underweight or overweight allocations. During panic phases, 2x leverage ETFs are on the table
Stay heavy on positions.
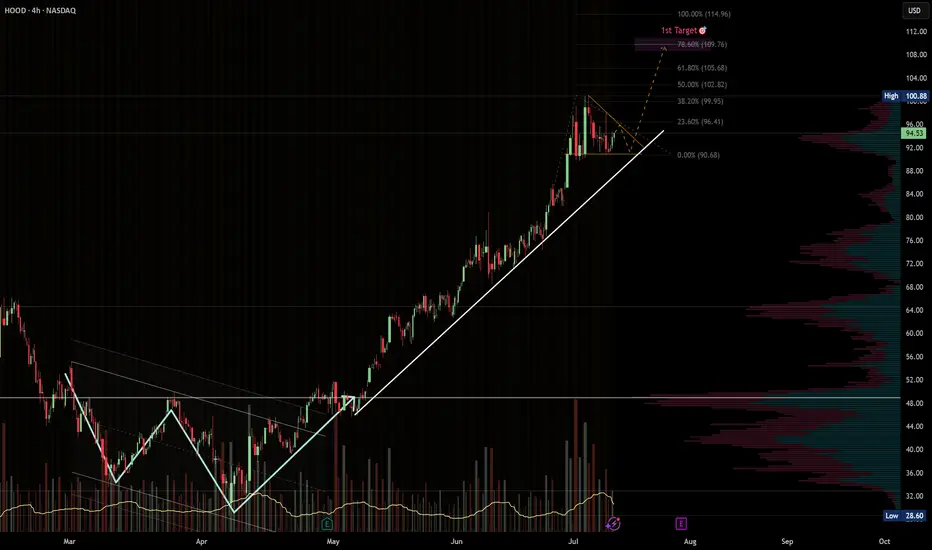
HOOD · 4H — Bullish Continuation Setup Targeting $109 → $115Pattern Overview
HOOD has been riding a strong ascending trendline since early May, respecting higher highs and higher lows all the way up.
After the most recent parabolic move from ~$90 to ~$101, price is now consolidating in a bullish pennant, just above key fib levels.
The setup looks primed for continuation if we see a breakout above $101 with confirming volume.
---
🎯 Target Zones
🎯 Target Level Why It Matters
Target 1 $109.76 78.6% Fibonacci extension from the previous leg. Common spot for intermediate take-profit. Also matches a soft VPVR resistance area.
Target 2 $114.96 100% measured-move projection of the prior rally. If momentum accelerates, this becomes a realistic stretch zone.
---
🛠️ Trade Plan (Example)
Component Level
Trigger Break and hold above $101 with volume ≥ 20-SMA.
Add-on Opportunity Pullback into $96–97 that respects the rising trendline.
Stop-loss Close < $92.5 invalidates trendline.
TP-1 $109–110 — take partials, move stop to breakeven.
TP-2 $114–115 — full exit or runner trail zone.
---
⚠️ Risk Notes
Watch for false breakouts — confirmation needs volume and price stability above $101.
Earnings or macro news could override technicals. Use tighter stops ahead of event dates.
If trendline fails, next key support sits at $89–90 (previous consolidation base).
---
✅ Trade Checklist
Bullish trendline intact
Continuation pennant forming
Fib & measured move confluence at $109–115
Volume profile supports clean move above $101
Clear invalidation under $92
> Disclaimer: This is not financial advice. Always trade your own plan and manage risk appropriately.
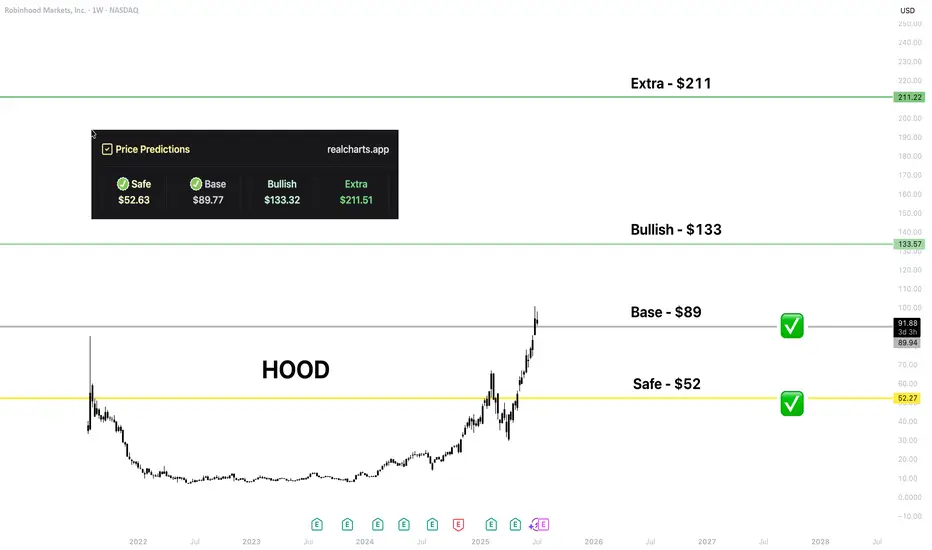
HOOD | Price PredictionI love that NASDAQ:HOOD has made a huge step in crypto integration.
That level is from my platform. I hope HOOD holders would be happy to get every level; time will show!
HOOD - Get Great PricingNASDAQ:HOOD and I have had a mixed relationship over the years. I have had my biggest win on the HOOD brokerage (5,000% options trade, $1200 into 60k) and at the same time I was present for the Derogatory removal of the GME button (of which I had sold before they took that button).
After many years and brokerages, I find myself returning to HOOD but this time much more experience... To my surprise, I love the platform, and I still recommend it for new traders for the ease and UI. Honestly, unless you are dealing with BIG Volume or Hot-Keying out of Low float Penny stocks, It will suit you just fine.
Now Let's Talk HOOD.
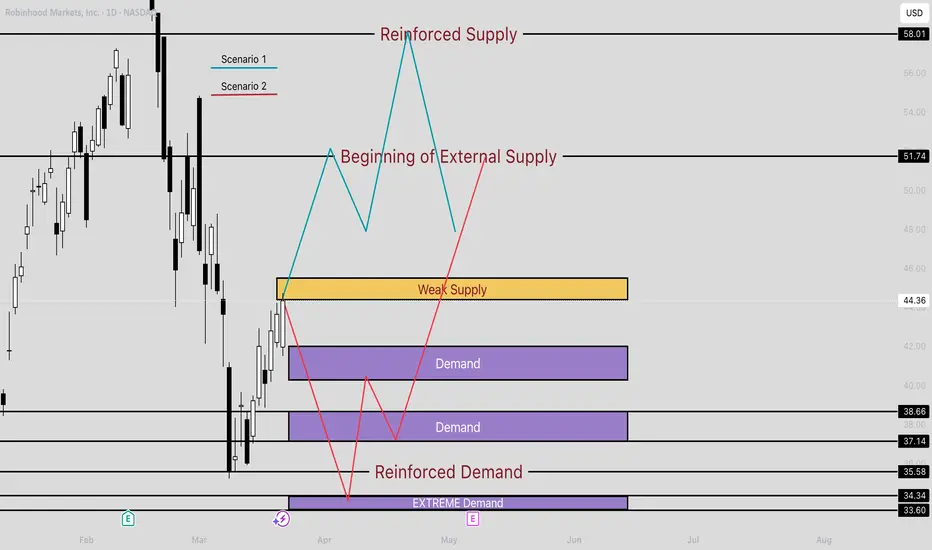
In this MASSIVE range we are looking at High $67, and a Low of $35. Thats a 47% drop!
Although we have recovered a bit, Many are eager to find a way to get in the range. Here I have put together 2 scenarios to help you play your position with confidence.
Better Price = Better psychology
Whether we are shopping at grocery store, or if we are buying a car. Getting a good deal feels better. But how do you feel when you know you overpaid?
TLDR: The best deals are the lowest purple zone "Extreme Demand" if you are Long, "Reinforced Supply" (at the top) if you are looking to get short or take profit.
Under the HOOD
Currently Robinghood is running into a little bit of a supply zone labelled "Weak Supply"
This is a new player, and we don't yet know how just how big this player is. So far they have absorbed some of that buying pressure coming in, but I would not be surprised if they we overtaken or even gapped above come Monday. This brings us to our first Scenario
Scenario 1: Blue line
With the break above "weak supply", there is headroom all the way until 51.74. This is where we will see some supply initially and maybe a small rejection.
Why would it not reject back down to a demand area like 41? Great question.
If this overtakes that "Weak Supply" zone, this will make a strong case that there is momentum behind the wheels here. I think there will be a new player reinforcing this buying if this happens all the way to the Finale at $58.01. From here I would consider taking some profits, maybe partials, or looking for some Puts.
Scenario 2: Red line
Getting Rejected by "Weak supply" would be evidence that this move was fluff. Those two demand zones may try to hold a bit, but with the lack of buying interest in the
$45 area, this won't make those buyers feel confident.
This is different story when comparing to the "Extreme Demand" zone (lowest purple zone). Buyers here have PROVEN that this is something they are very interested and they are not done accumulating yet. So from this location buyers feel confident that they are getting a good price*( see fn. )
From here this should drive demand up again, crushing shorts, and sending another nice squeeze to test that supply at 51.71
WHEW! if you made it this far, I appreciate your time!
Upvote/Follow if you enjoyed this idea, there are many more to come!
Happy trading!
* (This is a good price, because buyers are showing that it is. Although, if it did come down here, this would be the 4th test of this area. I still think there will be strong demand here, but this isn't the best tests. 2nd and 3rd were stronger.)
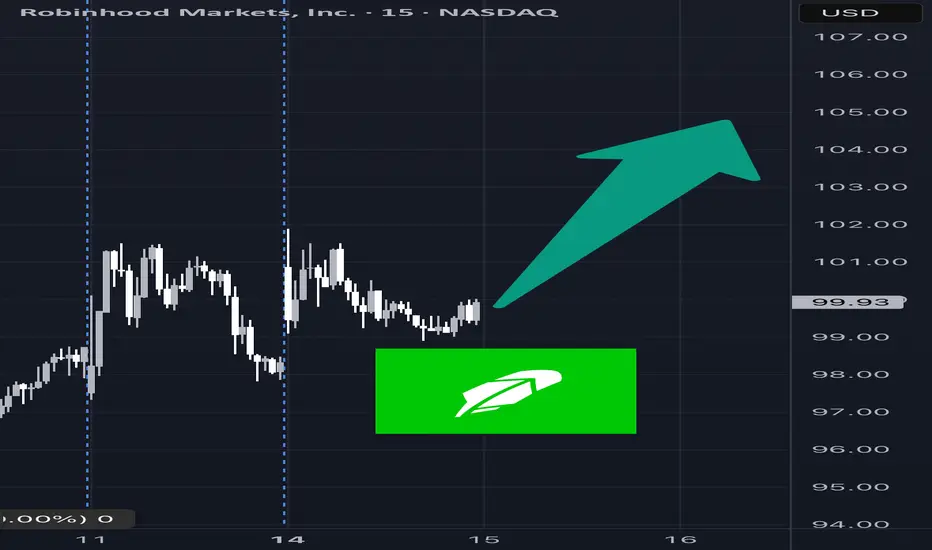
HOOD Weekly Call Option Setup – 07/14/2025 $106C | Exp. July 18
📈 HOOD Weekly Call Option Setup – 07/14/2025
$106C | Exp. July 18 | Breakout Watch Above $100 👀
⸻
🔥 BULLISH MOMENTUM BUILDING
🟢 HOOD is pushing hard into $100 resistance — price riding above 10/50/200 EMAs on all timeframes.
📊 RSI hot (65.6 on 5m / 71.6 daily), but not maxed out — short-term pullback possible, but trend still bullish.
💰 Volume + call flow favor more upside.
⸻
📰 Catalyst:
Positive crypto market sentiment = increased trading activity = good for HOOD’s core business.
VIX at 16.40 = risk-on environment = perfect for high-beta names like this one.
⸻
🎯 Trade Plan – High R/R Call Setup
Clean structure, riding sentiment — but be quick around $100.
{
"ticker": "HOOD",
"type": "CALL",
"strike": 106,
"exp": "2025-07-18",
"entry": 0.92,
"target": 1.38,
"stop": 0.46,
"size": 1,
"confidence": "70%",
"entry_timing": "market open"
}
🔹 Entry: $0.92
🎯 Target: $1.38 (+50%)
🛑 Stop: $0.46 (-50%)
📅 Expiry: 07/18/25
📈 Confidence: 70%
💼 Strategy: Naked Call
⸻
💬 Model Consensus:
“Moderately Bullish” — clean momentum + bullish call flow = good entry.
⚠️ Watch RSI + $100 resistance — quick rejection is possible.
⸻
📌 Why $106C?
🔸 OI building there → potential magnet
🔸 Cheaper than ATM but within reach
🔸 High gamma setup if we break $100 early
⸻
💡 Trade Smart:
🏃 Get in early → fade into strength
🧠 Position size accordingly → don’t get greedy
📢 Tag your trading buddy who’s still ignoring HOOD 😏
#HOOD #OptionsTrading #BreakoutSetup #CryptoMomentum #AITrading #CallOptions #FlowPlay #TradingView #0DTE #
What’s Your Catalyst?
Lately, many QS members have been DM’ing me asking:
“What do you think of this trade idea?”
“Should I go long here?”
“Do you think this setup looks good?”
And my go-to response is always the same:
“What’s your catalyst?”
Because without a catalyst, you’re not trading — you’re guessing.
---
🎮 Trading Is Not a Video Game
New traders often treat the market like it’s a video game.
As long as they “crack the code” of green arrows and red arrows on the chart, they believe they’ll make infinite money.
But that’s not trading.
That’s fantasy.
The harsh truth? Most of these traders haven’t paid their tuition yet.
Some are still in the honeymoon phase.
But the market always gets paid — in blood, time, or money.
---
💀 Real Trading Is Financial Warfare
Trading is not a game.
It’s war.
Behind every price tick, every candle, every fill — is another trader fighting for their financial life.
It’s a sword-to-sword battle. Just because you see it on your phone doesn’t mean it’s not real.
Real trading is life and death for hedge funds, prop firms, and even retail traders trying to survive.
Yet so many jump in, chasing arrows and patterns like they’re spinning a slot machine.
---
🎲 Why You’re Losing with “Green Arrow, Red Arrow”
No offense to TA — it has value. But let’s be honest:
If you’re blindly betting off green and red signals without context, you’re gambling.
You’re just hoping that one of those arrows lines up with a rare, random outlier move — so your one win is big enough to cover all your prior losses.
That’s not strategy.
That’s survival through luck.
---
🔍 What Real Traders Do Differently
To stand out, you need more than pretty charts.
You need information. Insight. Intent.
You need to answer questions like:
Why is this price movement happening?
How far can it go?
What’s driving this move — and what’s the broader context?
You won’t find those answers in price and volume alone.
---
💡 The 4D Framework of Modern Trading
To get an edge, you need to think in 4 dimensions — beyond what most retail traders see:
Market Data – price, volume, trends
Fundamentals – earnings, balance sheets, growth
Macro Forces – rates, inflation, policy, geopolitics
Catalysts – news, events, industry changes
Options Data – implied vol, skew, positioning
This 4D perspective is how modern trading works — and it’s exactly what AI is built to do better than any one trader.
You’re not going to out-research Goldman Sachs.
You’re not going to manually read every 10-K, earnings call, tweet, and Fed update.
But AI can.
---
🤖 AI Isn’t Perfect — But It’s Better Than Gambling
Is AI trading the ultimate answer?
No.
But it’s the closest thing we have to a scalable edge — because it combines massive information processing with human-level reasoning.
The choice is yours:
Stick with “green arrow, red arrow” and hope for Vegas-style luck
Or embrace AI tools that give you a fighting chance through context and analysis
I’ve made my choice.
And every day, my tools — and my edge — get better.
---
🧠 So Next Time You Trade, Ask Yourself
What’s your catalyst?
If you don’t have one, you don’t have a trade.
You have a lottery ticket.
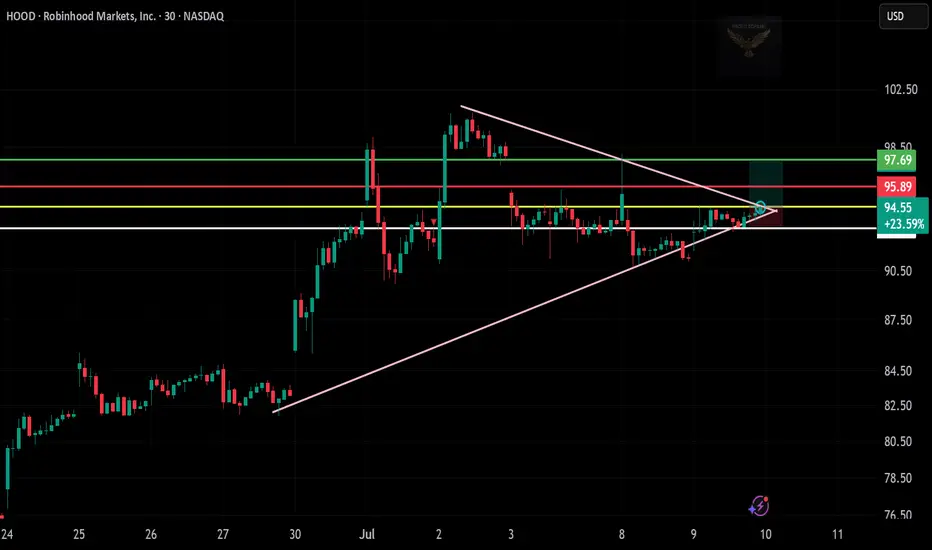
$HOOD Long Trade Setup – July 10📊
Price is squeezing inside a triangle — and today it broke out!
Volume picking up, and it’s holding above trendline support.
📌 Entry: $94.55
🎯 Target: $97.69
🛑 Stop Loss: Below $93.50
⏱️ Timeframe: 30-min
🔍 Why I Like This Trade:
Symmetrical triangle breakout with strong candle
Clean support build-up above $91.50
High R:R zone with room toward recent highs
Let’s see if momentum takes it to the target!
Logging every setup, win or lose, to sharpen the edge.
$BULL from $HOOD charting for maximum gains. 50$ reclaim this is a great risk to take here and i beleive can benefit alot of beginner traders to increase there first bag!
bag dad

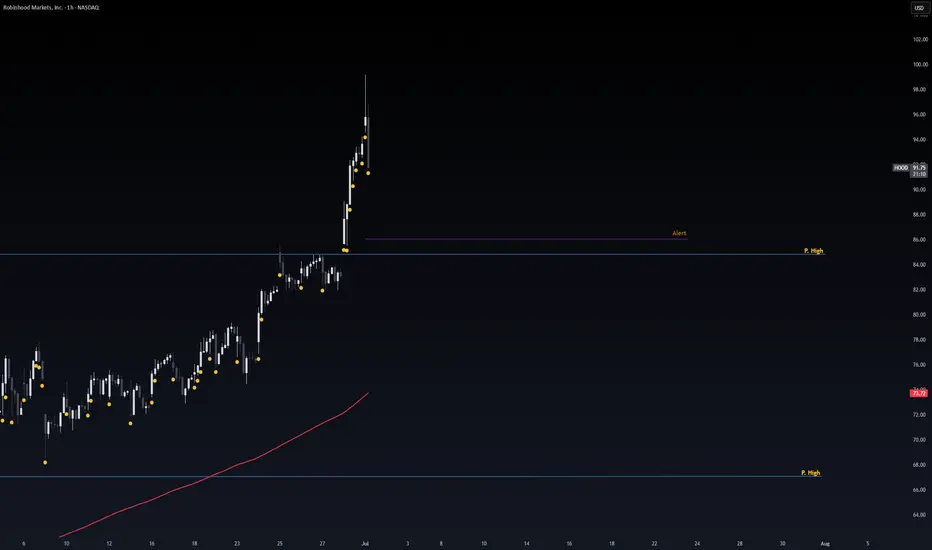
Safe Entry Zone HOODP.High (Previous High) Act as good support level.
Waiting for Buying Power to Stepin at P.High Line.
Note: 1- Potentional of Strong Buying Zone:
We have two scenarios must happen at The Mentioned Zone:
Scenarios One: strong buying volume with reversal Candle.
Scenarios Two: Fake Break-Out of The Buying Zone.
Both indicate buyers stepping in strongly. NEVER Join in unless one showed up.
2- How to Buy Stock:
On 1H TF when Marubozu/PinBar Candle show up which indicate strong buyers stepping-in.
Buy on 0.5 Fibo Level of the Marubozu Candle, because price will always and always re-test the imbalance.
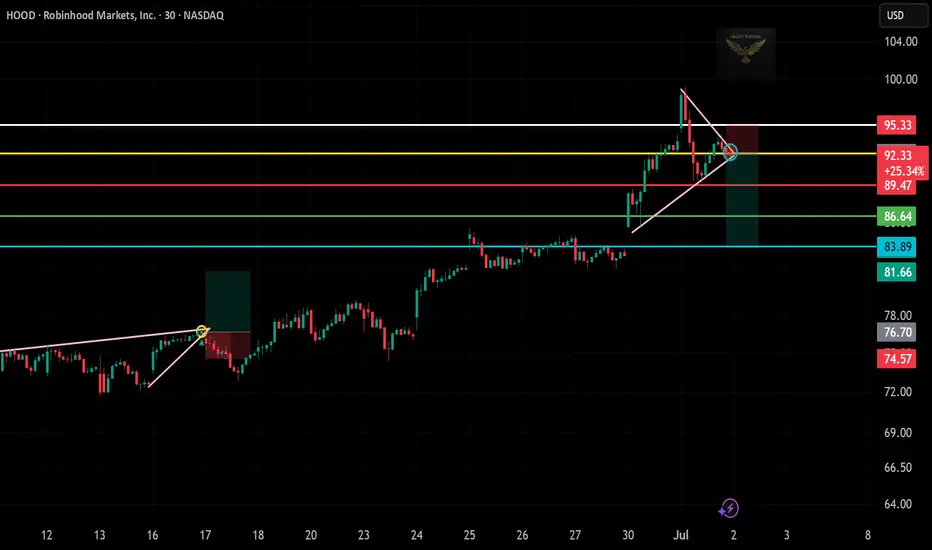
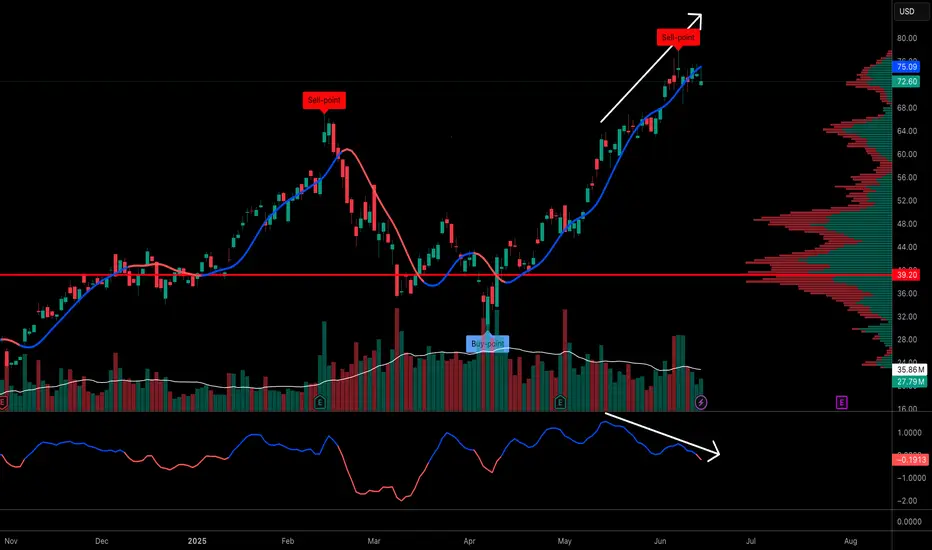
Short Trade Idea: HOOD (Robinhood Markets, Inc.)🧠
📅 Timeframe: 30-Minute
💼 Type: Short Position
📉 Setup: Triangle breakdown + Resistance rejection
📍 Trade Details:
Entry: $92.33 (bearish rejection candle at resistance + lower trendline break)
Stop Loss: $95.33 (above local high & upper trendline)
Target 1: $89.47 (previous support level)
Target 2: $86.64 (mid-support zone)
Target 3: $83.89 (key horizontal support)
Extended Target: $81.66 (major support from breakout zone)
🔎 Technical Breakdown:
Price formed a rising wedge/triangle and broke the lower trendline
After rejecting $95+ zone, it failed to hold above yellow resistance line
Bearish engulfing + retest of broken support confirms downside pressure
Momentum fading after a strong uptrend – ideal for a reversal trade
🎯 Risk/Reward Outlook:
RR Ratio: Favorable (min 2:1+ depending on targets)
Good structure for tight risk and wide target zone
VLAD impaling WALL ST!I believe Robinhood will achieve over One Trillion dollars in assets in very short order.
Giant Cup and Handle is your technical setup.
(I have covered hood at the low)
HOOD Got away #2I swear man, I said anything under 10 and I was loading up..... I did start but then I went all in on NASDAQ:TSLA and here she is another 10 bagger has come and gone. Lesson is Diversify, well sorta. If there's not catalyst for other stonks making big moves then put some here and there. I'm going to buy into this again in the future it's growing like a mofo.
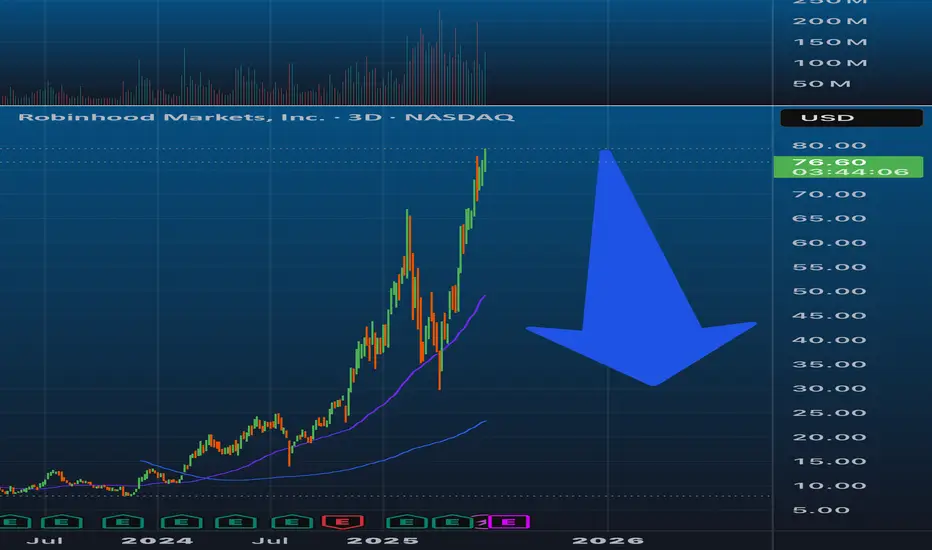
ROBINHOOD: from meme stock to margin call. ROBINHOOD: from meme stock to margin call. Parabolic moves end the same way — vertical down. Retail about to learn what “liquidity event” really means. Enjoy the round trip 📉
HOOD – Long Trade Setup!📈
🔍 Pattern: Ascending triangle breakout
📍 Entry: $76.75 (breakout candle confirmation)
🎯 Target: $81.59 (green resistance zone)
🛑 Stop-loss: $74.77 (below support trendline)
✅ Why this setup?
Clean breakout from multi-week consolidation
High volume push through resistance zone
Tight risk with large upside target
Strong bullish trend continuation
📊 Timeframe: 30-min chart
📈 Bias: Long / Momentum breakout

Time to take profits on Robinhood, it's extremely overboughtit's just about time for profit taking with summer here. Aiming for around $45-50 prior resistance turns to support, to buy back in at the 0.618 golden fib level as well.
Trump’s $1,000 baby accounts: what it means for markets President Trump’s “Trump Accounts” proposal would give every American newborn a $1,000 investment account placed in a stock market index fund, managed by the child’s guardians. The plan is part of the Big Beautiful Bill and has support from CEOs including Nvidia’s Jensen Huang, who called it “a seed fund for America’s next generation.”
If passed, the plan could drive consistent inflows into U.S. equity markets and benefit platforms like Robinhood, Vanguard, and BlackRock. Robinhood’s CEO will attend the White House event announcing the plan.
Robinhood shares are trading near multi-year highs, boosted by strong earnings and the acquisition of crypto exchange Bitstamp.
Shares also rallied recently on hopes the company would be added to the S&P 500, an inclusion that typically attracts passive fund inflows. While it wasn’t selected in the latest rebalancing, continued growth keeps it on watch for future inclusion.

HOOD (Robinhood) - Price Above Bollinger Band and Shooting StarsHOOD (Robinhood) stock price has been in an uptrend since May 2025.
Recent fundamentals such as corporate earnings, EPS, Revenue, Acquisitions have been good in Q2 2025.
However currently, HOOD price has printed 2 shooting stars above the upper bollinger band and linear regression lines (blue arrow).
Potential selling and profit-taking could occur, especially if there is a significant bearish catalyst or news in the stock market.
A -4% or -8% move selloff could occur over time if the price gaps up to an overextended level too fast, such as $80 to $85.
Both the weekly and daily charts are starting to show bearish divergence so I am watching both the technicals and fundamentals this month.

Doji on top of the hillDoji on top of the hill — on the daily chart, we observe a doji candle printed at the top of a strong uptrend, situated in a heavily overbought zone, as confirmed by both RSI and Stochastic RSI. This suggests potential for a pullback. If price moves below $73.21 with strong volume and conviction, the decline may extend to $72.07 (structural CHoCH) and possibly to the $68 support area. On the other hand, if price breaks above $78 with strong bullish momentum, we could see continuation toward the $84 resistance zone. Traders should remain cautious and watch for fakeouts, especially within this tight range and at key breakout levels."

HOOD Swing Trade Plan – 2025-06-06🚀 HOOD Swing Trade Plan – 2025-06-06
Bias: Bullish (High Momentum + Catalyst)
Timeframe: 5–10 days
Catalyst: S&P 500 inclusion speculation, crypto rally, retail momentum
Trade Type: High-conviction naked call option
🧠 Model Summary Table
Model Direction Strike Entry Price Target(s) Stop Confidence
Grok Strongly Bullish $80 $3.90 +100% -50% 85%
Claude Moderately Bullish $78 $4.67 +50–150% -40% 75%
Llama Moderately Bullish $80 ~$3.85 $5.00+ < $75 or -50% 80%
Gemini Strongly Bullish $80 ~$3.88 $5.00 / $7.00+ < $75 or -50% 70%
DeepSeek Moderately Bearish $70 PUT $1.70 $2.50 / $3.40 > $79.17 or -50% 75%
✅ Consensus: Strong bullish trend supported by technicals and macro catalysts
⚠️ Bearish Divergence: DeepSeek warns of exhaustion risk
📈 Technical & Sentiment Summary
Price Action: Trading above all EMAs; price extended above upper Bollinger Bands
RSI: Extreme overbought across daily timeframes (RSI > 80)
MACD: Strongly positive on all models (15m, daily, weekly)
Sentiment: Positive S&P 500 inclusion buzz, retail FOMO, and crypto tailwinds
VIX: Falling → favorable for long calls
Max Pain: $66 (could cause pull later in expiry week)
✅ Final Trade Setup
Parameter Value
Instrument HOOD
Direction CALL (LONG)
Strike $80.00
Expiry 2025-06-20
Entry Price $3.90
Profit Target $5.85 (50% gain)
Stop Loss $1.95 (50% loss) or HOOD < $75
Size 1 contract
Entry Timing At market open
Confidence 75%
💡 Rationale: Aligns with dominant trend and event-driven momentum. Best R/R with defined risk on extreme FOMO move.
⚠️ Risks & Trade Watchouts
RSI overbought → any market pullback could hit stop quickly
S&P inclusion may trigger “sell the news” reaction
Theta decay risk intensifies late next week
Max pain at $66 could drag prices if momentum fades mid-week

RobinHood - Urgent News - Afterhours SelloffOn June 6, 2025, S&P Dow Jones Indices announced no changes to the S&P 500 index in its quarterly rebalance, marking the first such instance since March 2022. This decision notably excluded Robinhood Markets Inc., despite speculation that it might be included due to its market capitalization exceeding $20.5 billion and recent strong performance. Following the announcement, Robinhood's stock declined over 5% in after-hours trading
The next S&P500 quarterly rebalancing is set for September 2025....perhaps the next leg higher needs to wait until them
As of June 6, market close, Robinhood's stock is trading at $74.88, with a market capitalization of approximately $36.85 billion. The company has experienced significant growth, with a 365% increase in stock price over the past 12 months and a 50% surge to start 2025. Analysts project continued revenue and earnings growth, with an average one-year price target of $51.19 per share
We issued put option alerts to our members and shorted this live stream on Friday afternoon.
