TSLA: 305.30
This idea is supported by entry price and institutional rebound.
Strong institutional breakout. Bullish Entry 2 — Institutional breakout + momentum.
Entrada: 310.00/317.00
SL: 308.00
TP1: 314.00
TP2: 316.00
Bearish Entry 2 — Strong institutional breakout
Entry: 300.00
SL: 302.00
TP1: 296.00
TP2: 292.00
1TSLA trade ideas

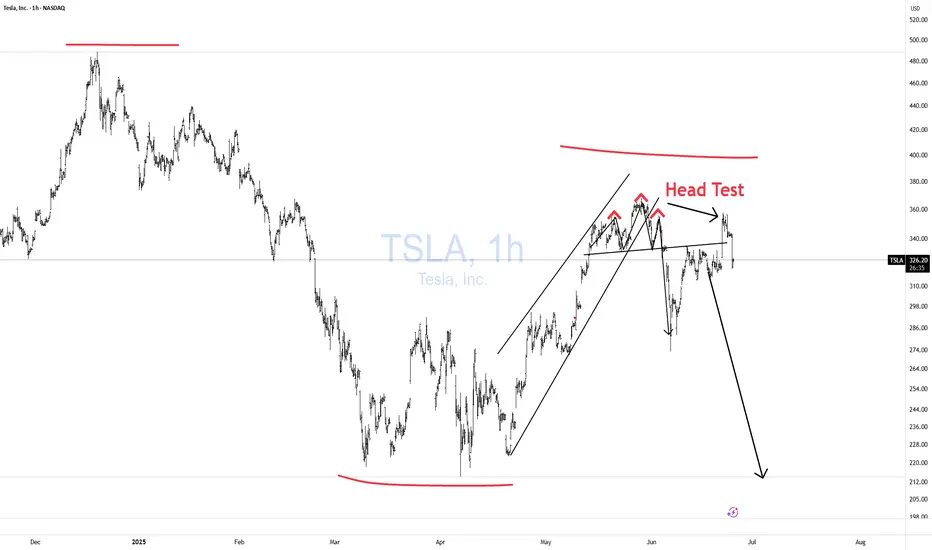
TSLA: Sell ideaHigh probability of a decline in TSLA according to the pattern shown on the chart. Target 271.62.

Bitcoin, SPX, Ethereum, Tesla: Whats Next? BTC appears to be showing distribution signs.
I do believe BTC local top is in, but alt coins like Ethereum can still push a bit higher.
Ethereum short around 3900-4000 looks promising
Tesla fell sharply on the back of cash flow burn and expenditures.
Investors are also fearful of sales decline and loss of EV credits.
SPX hit major long term resistance today. Coupling this with a depressed Vix we are likely setting up for a pullback in the market.
Small caps saw distribution today on the back of rising yields. A failed breakout observed on IWM chart.

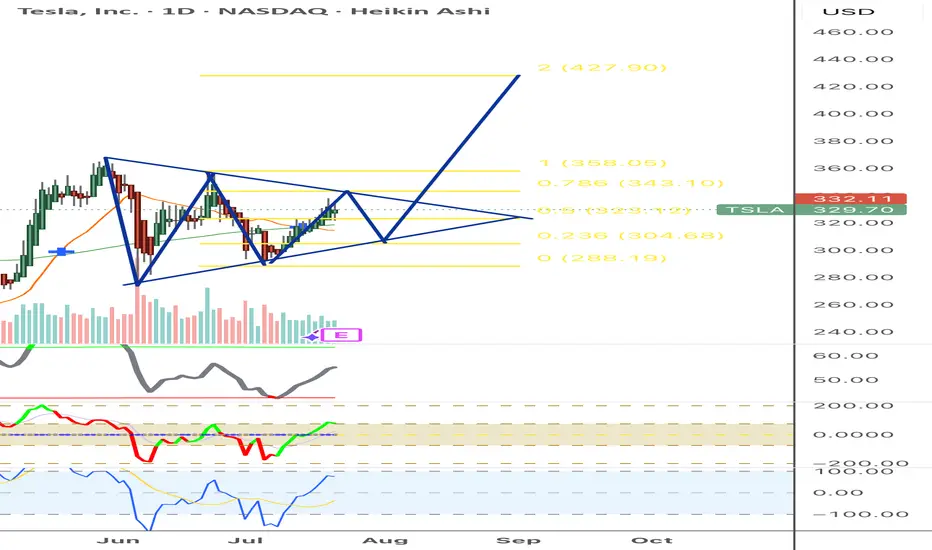
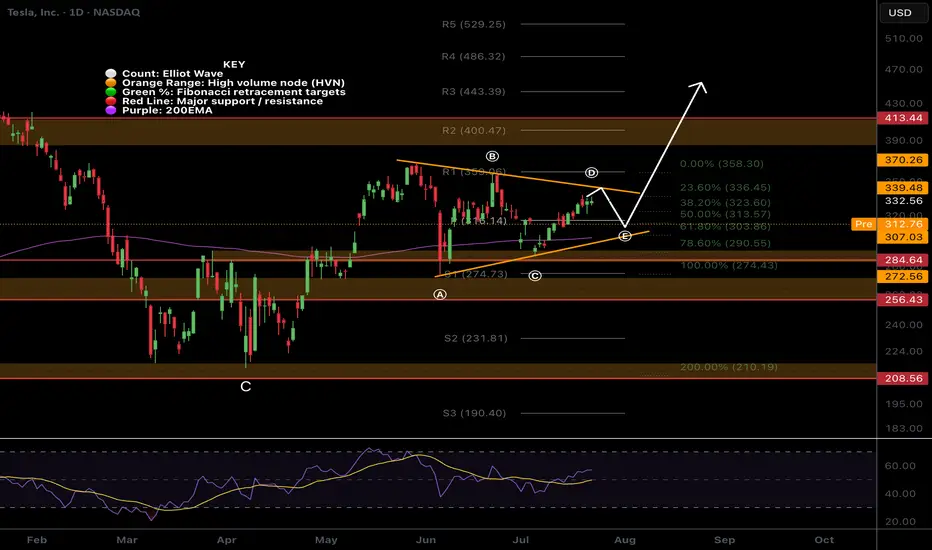
$TSLA Triangle?NASDAQ:TSLA triangle has presented itself with the recent price action. Triangle pattern target is $443 at the R3 daily pivot.
Wave e is expected to end at the daily pivot and wave d break is the signal to go long.
Analysis is invalidated below wave c.
TSLA, revenue decline/textbook technical setup.TSLA, revenue decline/textbook technical setup.
Confluence of major levels, how to take a well defined short trade with puts.
Clean as it gets.
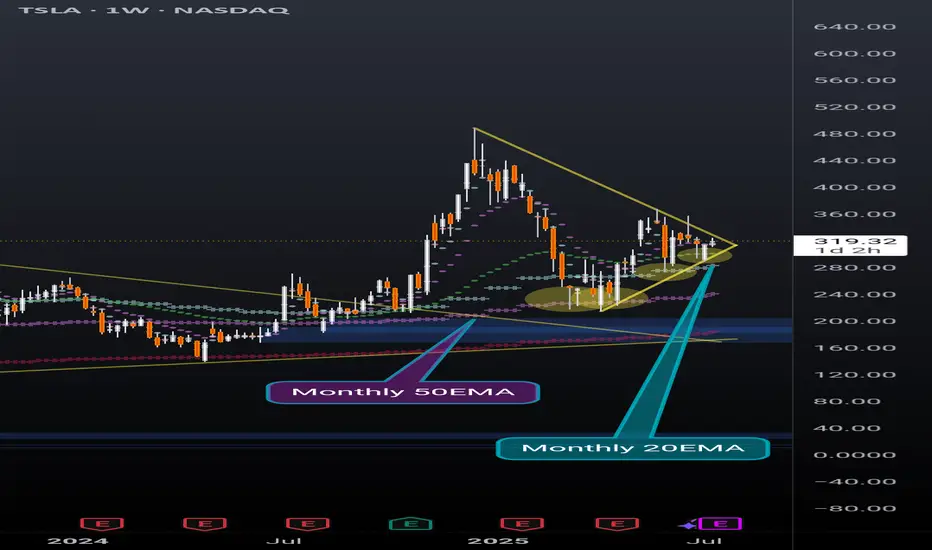
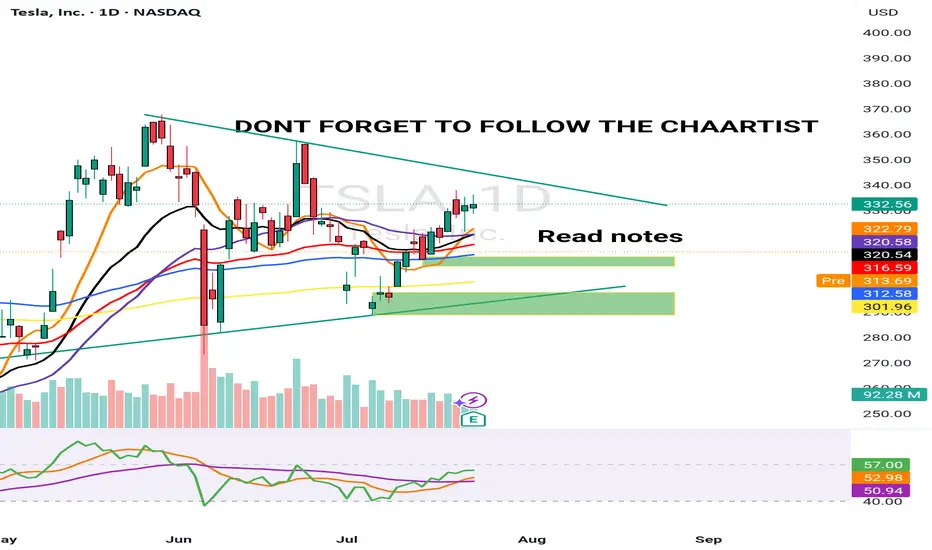
TSLA weekly coiling into something powerfulNever doubt the power of TSLA. Recently broke out of a huge pennant, and now nearing the end of another pennant while simultaneously holding support above the daily 20EMA(overlayed on this weekly chart).
Also recently found support off of the monthly 20EMA (overlayed on this weekly chart) and took 2 direct hits on the monthly 50EMA (overlayed on this weekly chart) before that and rallied up. It will take a lot to crush this setup but anything can happen. Possibly a longer pennant formation.
I'm just a cat not a financial advisor.
TSLA Honey Ticking Bull Trap! UPDATE 1This is an updated chart, as I keep being prompted to reach "My Target" by TV.
No matter how bad things get for Elona and TSLA, there are always people who are willing to pile in and buy at any price. The problem is the chart is showing lower highs, as TSLA no longer attracts the people needed to boost price, just like TSLA the brand. As a result, people keep getting honey ticked.
Don't Get HONEY TICKED!
As I always say, never EVER!! Invest in toxic people like Elona. They always blow themselves up in the end. It's in their nature!
Click Boost, Follow, subscribe, and let's reach 5,000 followers. ;)
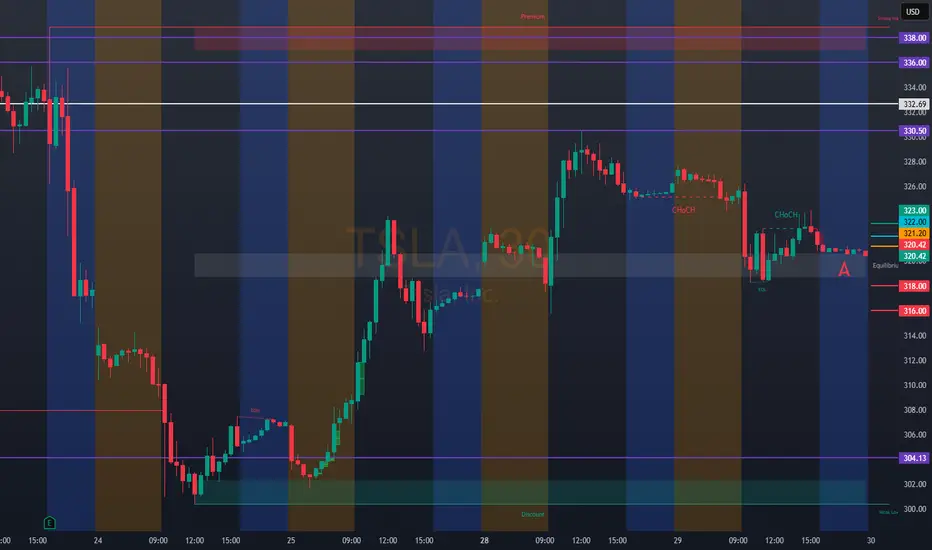
TSLA 24 JULY 2025I have marked 2 levels in green boxes. Price is inside this box pre market and TSLA is down -8.5% from the highs of $338 post market till $310 & -7.5% down from yesterday's close
A better level is the lower demand zone but its not the best. Price has not hit any major resistance.
My job is to read the data & trade. I am still bullish & 10% up down move is normal for Tesla &
This could be a "BEAR TRAP".
Tesla Shares (TSLA) Drop Following Earnings ReportTesla Shares (TSLA) Drop Following Earnings Report
Yesterday, after the close of the main trading session on the stock market, Tesla released its quarterly earnings report. While both earnings per share (EPS) and gross profit slightly exceeded analysts’ expectations, the results reflected a negative trend driven by declining sales. This decline is being influenced by intensifying competition from Chinese EV manufacturers as well as Elon Musk’s political activity.
According to Elon Musk:
→ The company is facing “a few tough quarters” due to the withdrawal of electric vehicle incentives in the US;
→ The more affordable Tesla model (mass production expected in the second half of 2025) will resemble the Model Y;
→ By the end of next year, Tesla's financials should become "highly compelling".
Tesla’s share price (TSLA) fell by approximately 4.5% in after-hours trading, clearly reflecting the market’s reaction to the report. Today, the stock is likely to open around the $317 level, down from over $330 just the day before.
Technical Analysis of TSLA Stock Chart
In our analysis of TSLA charts dated 2 July and 8 July, we outlined a scenario in which the stock price could form a broad contracting triangle, with its axis around the $317 level.
The new candlesticks that have appeared on the chart since then have reinforced the relevance of this triangle, as the price rebounded from the lower boundary (as indicated by the arrow) and headed towards the upper boundary. However, yesterday’s earnings report disrupted this upward move.
Thus, while the broader stock market is trending higher (with the S&P 500 reaching a historic high yesterday), TSLA may remain "stuck" in a consolidation phase, fluctuating around the $317 level—at least until new fundamental drivers shift market sentiment.
This article represents the opinion of the Companies operating under the FXOpen brand only. It is not to be construed as an offer, solicitation, or recommendation with respect to products and services provided by the Companies operating under the FXOpen brand, nor is it to be considered financial advice.

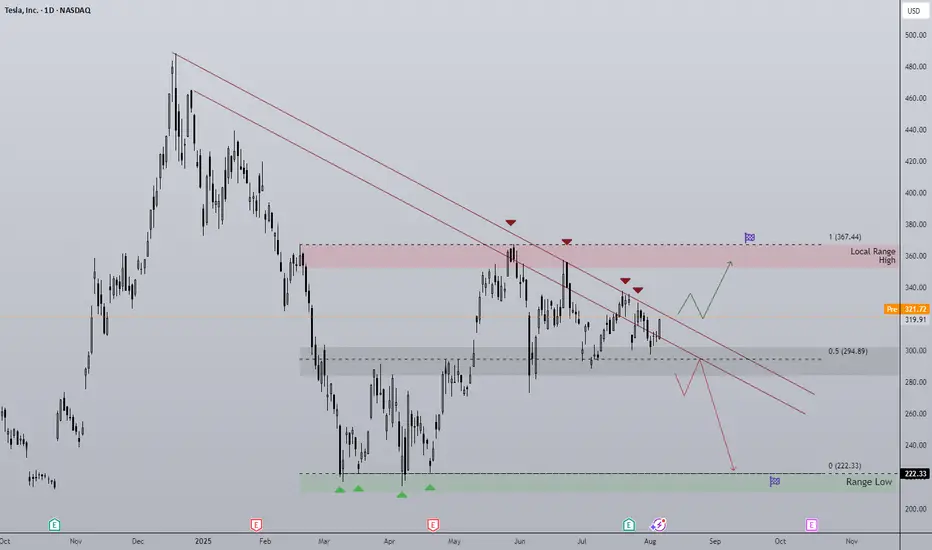
Tesla Breakout? For the majority of the calendar year TESLA has been in a range between $220 - $365 with a clear midpoint of $295.
From March to the beginning of May TESLA bounced between range low and the midpoint until finally breaking through into the upper half of the range where it has stayed ever since. However, there is a clear diagonal resistance level that is preventing higher highs.
So will TESLA breakout, or will it lose the midpoint? Structurally it is clear that the bulls have a set level they are happy to buy at (Midpoint) but the bears are getting more aggressive with their selling, hence the lower highs. This compression inevitably leads to an impulse move but the direction is not so clear.
Bullish scenario: A clean breakout with volume that makes a new higher high, signaling a shift in structure. A pullback and retest of the breakout would be an ideal opportunity to go long and aim for that range high before expecting resistance.
Bearish scenario: The lower highs keep printing until the midpoint is lost and price accepts below it, that would then signify to me the new trading range is between Range Low and Midpoint.
The fakeout scenario is a risk but with price so close to the midpoint already it follows the same invalidation criteria as the bullish scenario, the midpoint is vital to both sides.
TSLA pivot points suggesting imminent breakoutTSLA is in a tightening pattern, which can of course break either bullish or bearish. given the overall trend and market conditions, I have a bullish lean on it. After doing some pivot point analysis this evening I have shifted the bull break odds even higher in my mind, and not only that, I believe the bull break may be imminent this week.

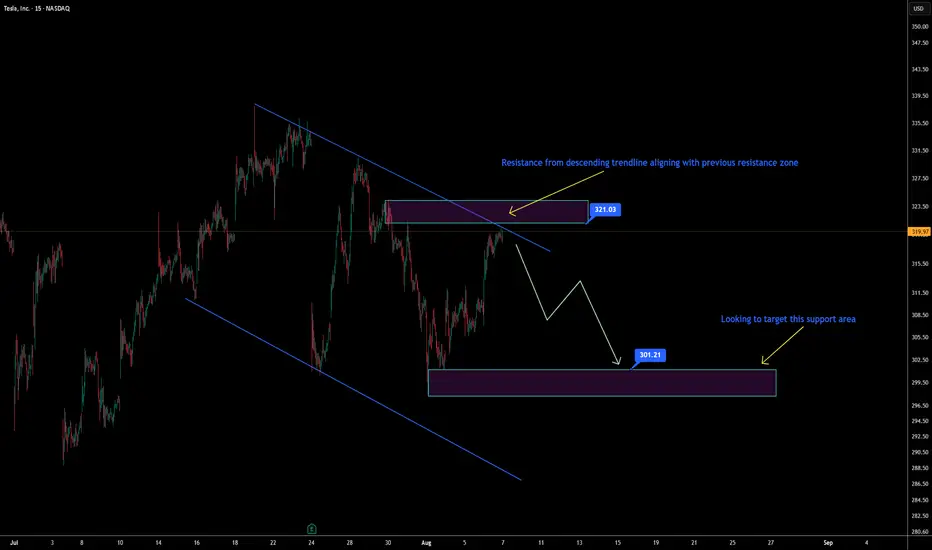
TSLA Facing Key Resistance – Short Setup Targeting 301 SupportTesla is currently testing a key resistance area formed by the intersection of a descending trendline and a previously tested supply zone around 321.
Price action in this region may lead to a potential rejection.
**Forecast:**
If the rejection is confirmed, I expect a move toward the 301–300 support zone.
This area aligns with prior demand and a technical timing window from my harmonic model.
Trade idea based on trend structure, liquidity zones, and time-based forecast methodology.
📅 Watch price behavior around 321 for confirmation.
📉 Target: 301 support area
TSLA, Beyond the candlesTSLA has been printing back-to-back bounce signals, with higher lows forming consistently.
Hoping this leads to a sustained uptrend.

TSLA: 321.20Bullish Entries: 322.00 / 323.00 (high activity) Target:
328.00 / 330.00 Stop:
319.00 TSLA needs to close the earning gap at 332.69. Its continuation price of 332.00/336.00 is within the supply zone. Be very careful.
TSLA WEEKLY OPTIONS SETUP
### 🚗 TSLA WEEKLY OPTIONS SETUP (2025-07-28)
**Big Call Flow. Low VIX. Can Bulls Hold \$325?**
---
📊 **Momentum Overview:**
* **Daily RSI:** 48.2 🔻 → *Neutral-to-Weak*
* **Weekly RSI:** 57.1 🔻 → *Still bullish zone, but falling*
⚠️ **Interpretation:** Momentum is softening, trend in question.
📉 **Volume Context:**
* **Volume Ratio:** 1.3x ⬆️ (vs. last week)
* **Price Change:** -0.77% despite that volume
🔍 *Distribution Alert:* Institutions may be selling into strength.
📈 **Options Flow:**
* **Call/Put Ratio:** **1.70** = 🚨 *Bullish flow confirmed*
* **Volatility (VIX):** 15.16 🟢 Favorable for directional plays
✅ Strong setup for options traders riding short-term momentum
---
### 🧠 **Weekly Sentiment Scorecard:**
* ✅ **Bullish Signals (2):** Options Flow, Volatility
* ⚠️ **Neutral Signals (2):** Daily & Weekly RSI
* ❌ **Bearish Signal (1):** Volume pattern = distribution risk
**Overall Bias:** 🟢 *Moderate Bullish*
---
### 🔥 **TRADE SETUP IDEA:**
🎯 **Strategy:** Long Call Option
* 📌 **Instrument:** TSLA
* 💵 **Strike:** \$355C
* 📅 **Expiry:** Aug 1, 2025
* 💸 **Entry:** \~\$0.75
* 🎯 **Profit Target:** \$1.50
* 🛑 **Stop Loss:** \$0.45
* 🔒 **Key Support to Watch:** \$327.50 — lose that = exit fast
📈 **Confidence Level:** 65%
⚠️ **Gamma Risk:** High → trade small, manage tight.
---
### 📦 TRADE\_DETAILS (JSON Format for Algo/Backtest):
```json
{
"instrument": "TSLA",
"direction": "call",
"strike": 355.0,
"expiry": "2025-08-01",
"confidence": 0.65,
"profit_target": 1.50,
"stop_loss": 0.45,
"size": 1,
"entry_price": 0.75,
"entry_timing": "open",
"signal_publish_time": "2025-08-01 09:30:00 UTC-04:00"
}
```
---
### 🧭 **Quick Notes for Traders:**
* ✅ Bulls have short-term edge — but **momentum is fading**
* ⚠️ If TSLA breaks below **\$325**, exit fast.
* 🔍 Watch for fakeouts: options flow is bullish, but volume says “not so fast.”
---
📊 TSLA \$355C → Risk \$0.75 to potentially double 📈
💬 Will this hold, or is it a bull trap before a dump? 👀
Comment below ⬇️ and follow for Monday updates!
---
**#TSLA #OptionsFlow #WeeklyTrade #TradingSetup #GammaRisk #AITrading #TeslaStock #UnusualOptionsActivity #SmartMoneyMoves**

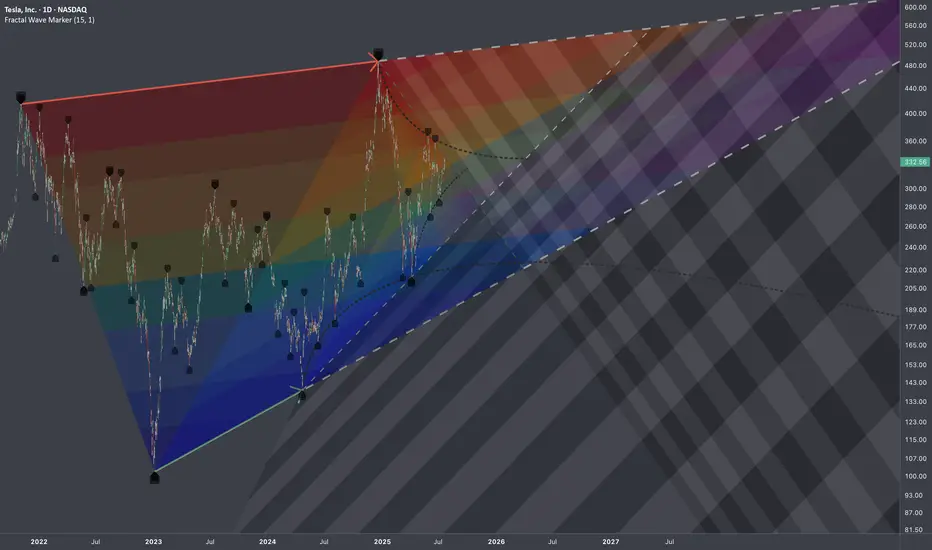
$TSLA: Multi-Scale DensityResearch Notes
Identified structural compressions happening within two periods:
This set has provided a perfect opportunity to study exponential fibs with growth rate starting from phi^1/4 applied to area of expression of squeeze.
Geometrically, gives a better sense of a continuity than regular fibs.
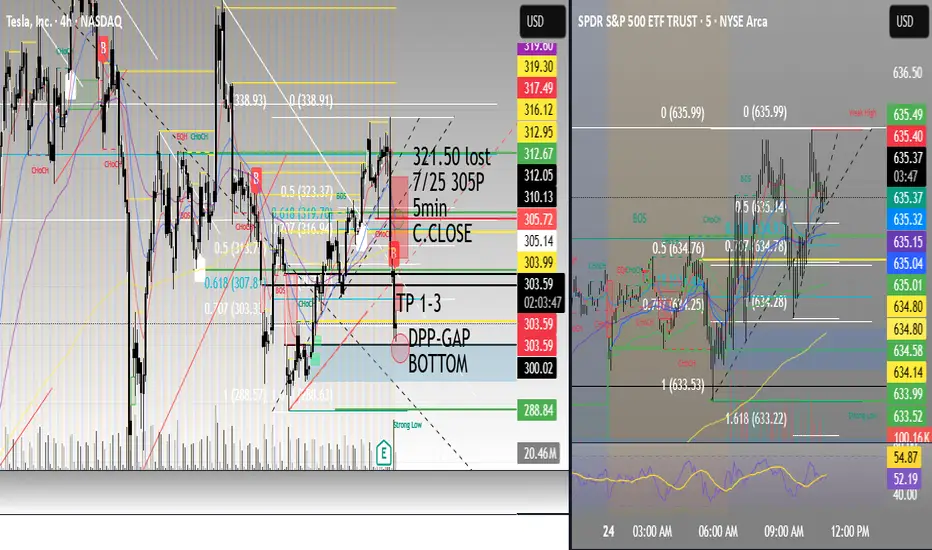
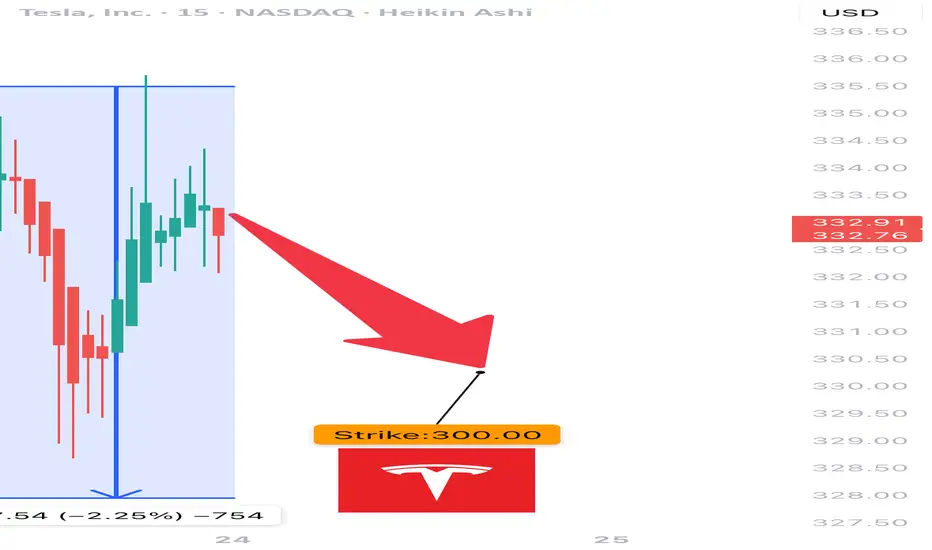
TSLA Earnings Play (Bearish Bias)
🚨 TSLA Earnings Play (Bearish Bias) 🚨
Earnings Date: July 23, 2025 (AMC)
🧠 Confidence: 75% Bearish | 🎯 Target Move: -10%
⸻
🔍 Key Takeaways:
• 📉 TTM Revenue Growth: -9.2% → EV demand weakness
• 🧾 Margins Under Pressure: Gross 17.7%, Operating 2.5%, Net 6.4%
• ❌ EPS Beat Rate: Only 25% in last 8 quarters
• 🐻 Options Flow: High put volume at $330 strike
• 🧊 Low Volume Drift: Trading above 20/50MA but losing steam
• 📉 Sector Macro: EV competition + cyclical headwinds
⸻
🧨 Earnings Trade Setup:
{
"instrument": "TSLA",
"direction": "put",
"strike": 300,
"expiry": "2025-07-25",
"entry_price": 2.02,
"confidence": 75,
"profit_target": 6.06,
"stop_loss": 1.01,
"entry_timing": "pre_earnings_close",
"expected_move": 7.1,
"iv_rank": 0.75
}
⸻
🛠️ Trade Details:
Parameter Value
🎯 Strike Price $300 PUT
💰 Premium Paid $2.02
📅 Expiry Date 2025-07-25
🛑 Stop Loss $1.01
🚀 Profit Target $6.06
📏 Size 1 Contract
⏱ Entry Timing Pre-Earnings
📊 IV Rank 75%
🕒 Signal Time 7/23 @ 14:14 EDT
⸻
📈 Strategy Notes:
• 🧯 IV Crush Risk: Exit within 2 hours post-earnings
• 🎲 Risk/Reward: 1:3 setup | Max Loss: $202 | Max Gain: $606+
• 🧭 Volume Weakness & put/call skew signal downside
• 🧩 Macro + Tech + Flow Alignment = Tactical bearish play
⸻
🧠 “Not all dips are worth buying — this might be one to short.”
📢 Drop your thoughts — would you take the trade or fade it?

TSLA WEEKLY CALL SETUP — 07/23/2025
🚀 TSLA WEEKLY CALL SETUP — 07/23/2025
📈 AI Consensus Signals 🔥 Bullish Move Incoming
⸻
🔍 SENTIMENT SNAPSHOT
5 AI Models (Grok, Gemini, Claude, Meta, DeepSeek) =
✅ MODERATE BULLISH BIAS
➡️ Why?
• ✅ RSI Momentum (Daily + Weekly = UP)
• ✅ Bullish VIX sentiment
• ⚠️ Weak volume + neutral options flow
• 🧠 No model signals bearish direction
⸻
🎯 TRADE IDEA — CALL OPTION PLAY
{
"instrument": "TSLA",
"direction": "CALL",
"strike": 380,
"entry_price": 0.88,
"profit_target": 1.76,
"stop_loss": 0.44,
"expiry": "2025-07-25",
"confidence": 65%,
"entry_timing": "Open",
"size": 1 contract
}
⸻
📊 TRADE PLAN
🔹 🔸
🎯 Strike 380 CALL
💵 Entry Price 0.88
🎯 Target 1.76 (2× gain)
🛑 Stop Loss 0.44
📅 Expiry July 25, 2025
📈 Confidence 65%
⏰ Entry Market Open
⚠️ Risk High gamma / low time (2DTE)
⸻
📉 MODEL CONSENSUS
🧠 Grok – Bullish RSI, cautious due to volume
🧠 Gemini – Momentum confirmed, weekly strength
🧠 Claude – RSI + VIX = green light
🧠 Meta – 3 bullish signals, minor risk caution
🧠 DeepSeek – RSI + volatility favorable, careful on size
⸻
💬 Drop a 🟢 if you’re in
📈 Drop a ⚡ if you’re watching this flip
🚀 TSLA 380C looks primed if we break resistance near $376
#TSLA #OptionsTrading #CallOptions #WeeklySetup #AIPowered #MomentumTrade #TeslaTrade #GammaRisk #ZeroDTEReady

TSLA VolanX Earnings Strategy: Short-Term Bearish Bias (TEST)🧠 VolanX Earnings Strategy: Short-Term Bearish Bias
🎯 Goal:
Capitalize on downside or neutral reaction to earnings with defined risk and IV crush protection.
🔻 Primary Trade: Bear Put Spread
Strategy: Buy Put at ATM, Sell Put at lower strike
Expiration: July 25, 2025
Structure:
Buy 330 Put
Sell 315 Put
Max Risk: Premium paid (e.g., $5–6 per spread)
Max Profit: ~$15 if TSLA closes ≤ 315
Breakeven: ~$325
📈 Why This Works:
Aligns with DSS projection ($317.74 30-day)
Short expiry captures earnings move + IV crush
Profits if stock stays below ~325 post-earnings
🟨 Alternative Trade: Neutral-to-Bearish Iron Condor
If expecting rangebound post-earnings:
Sell 340 Call / Buy 345 Call
Sell 315 Put / Buy 310 Put
Credit: ~$3.50–4.00
Max Risk: ~$1.50–2.00
Profit Zone: 315–340
Best if TSLA volatility collapses and price stays in a channel.
🧨 High-Risk, High-Reward: Put Ratio Backspread
Buy 2x 320 Puts
Sell 1x 330 Put
Cost: Small debit or credit
Profit: If TSLA tanks → big delta gain
Risk: Small near expiry if TSLA closes near 320–330
Use this only if expecting a big bearish surprise.
🔧 Risk Management:
Position size = max 1–2% of account
Avoid holding spreads past Jul 25 if IV collapses
Use alerts around 330 / 325 / 317.5 for exits
🧠 DSS-Backed Tagline:
"With DSS projecting a controlled pullback and flow confirming overhead hedging, we favor bearish verticals and vol crush plays going into earnings."

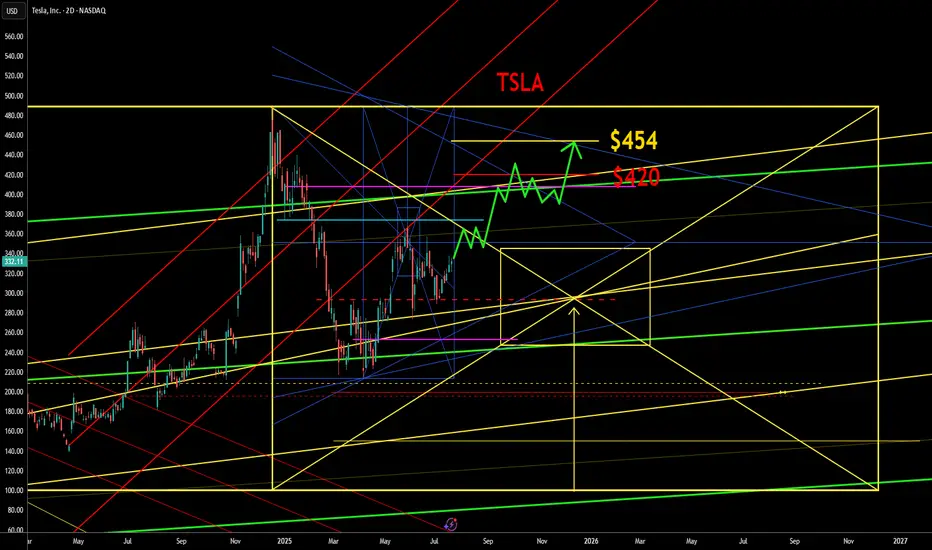
TSLA to $420 - $454 areaTSLA is ready and primed to move into the $420 - $454 area over the coming quarter. This is a good options play.
We will encounter a little expected resistance at the $360 area, then an aggressive move to the $420 area.
TESLA PRICE ACTION 22 JULY 2025This is the price action for Tesla. i have discussed indicators as well. Do not blindly trade without understanding the logics. I am long here with stocks & calls.
NOTE: DO NOT BLINDLY BUY

TSLAJust another observation to see if this will play out? I’m not in the market, this just for my own play tracking to see how things work out