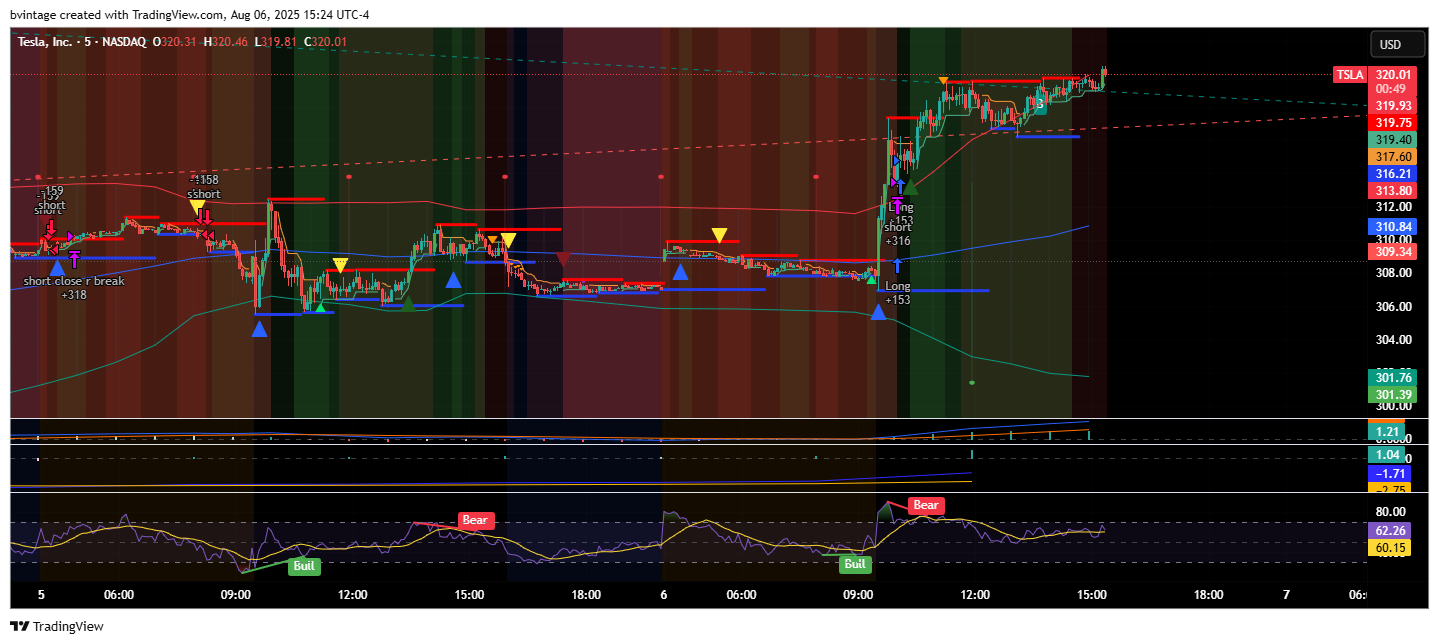
Obie20471 minute agoTSLA gap up to 326 - 330 at open where’s master mike and the rest of the bears talking about a bull trap smh i love tsla
hhmaharajah450347 minutes agoI think we go down tomorrow. The stock is trading within a horizontal wedge pattern and we are at the high end of that.