MINA/USDT. Forgotten Altcoin on the Verge of Exploding”📊 Technical Analysis Overview
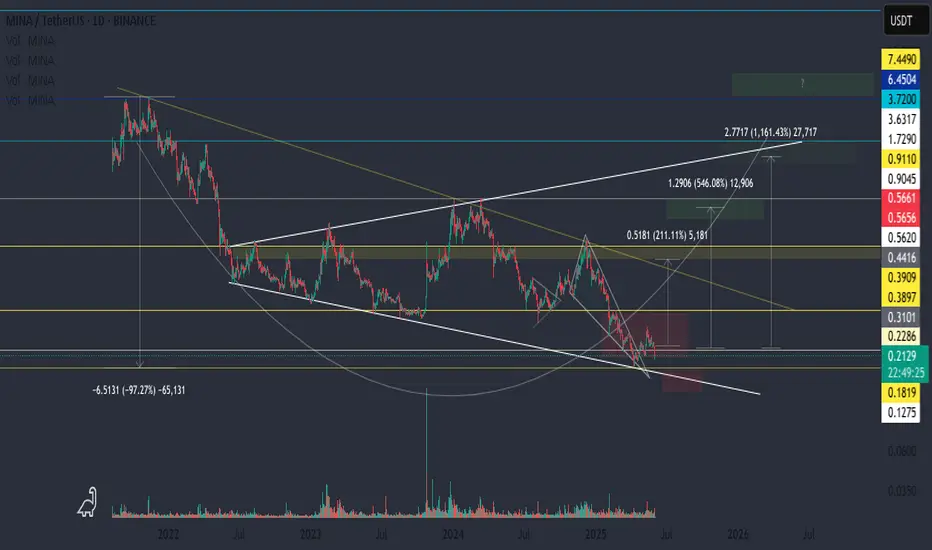
A large cup pattern is forming on the higher timeframes.
The structure shows an expanding triangle in the accumulation zone — typical of a final phase before a major move.
🔸 Key Resistance Zones:
$0.80–$0.90 — strong local resistance
▫️ First major barrier
▫️ Possible
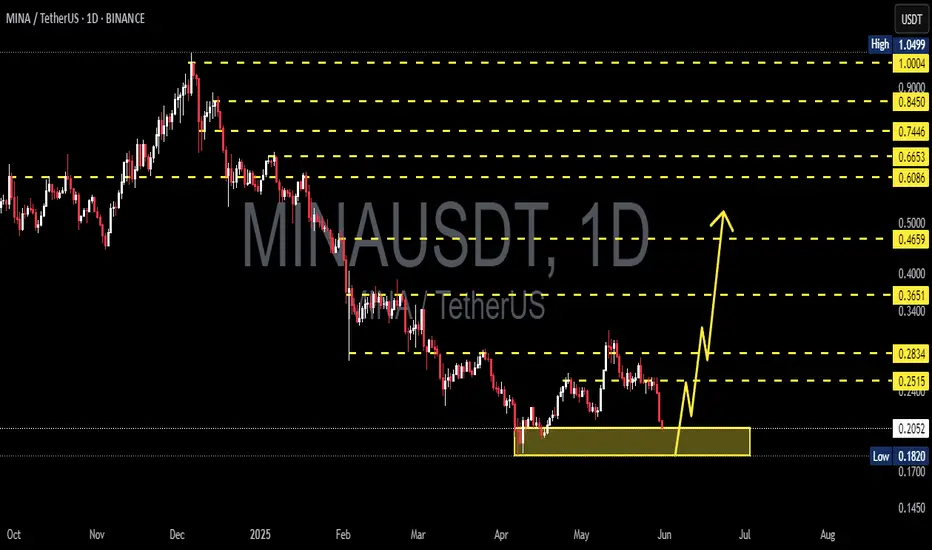
MINAUSDT 1D AnalysisMINA ~ 1D Analysis
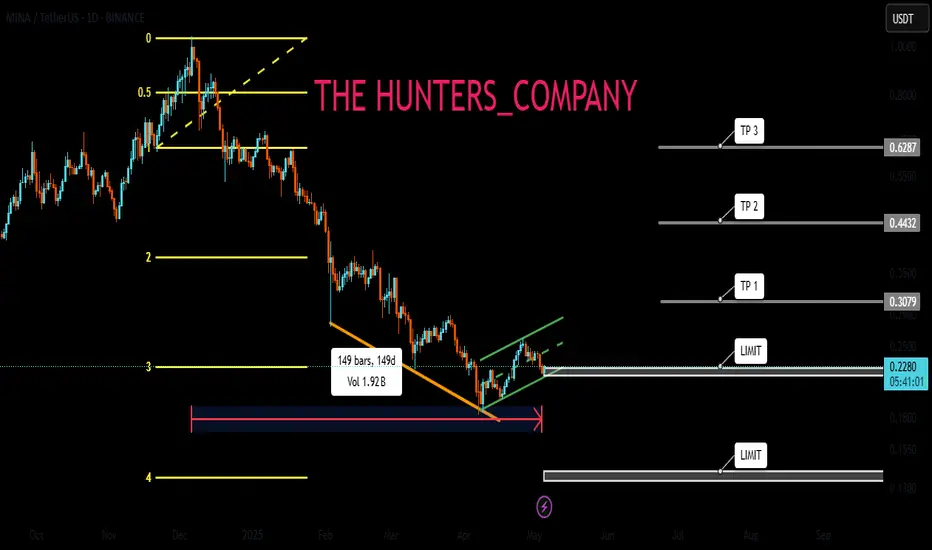
#MINA Maybe you can consider starting to buy back from here with a short term target of at least 10%+ from here and a long term target of $1
Mina!It's the level I expect to come, both due to a drop in bitcoin and an increase in the amount in circulation over time.
Lower levels are an opportunity to add.
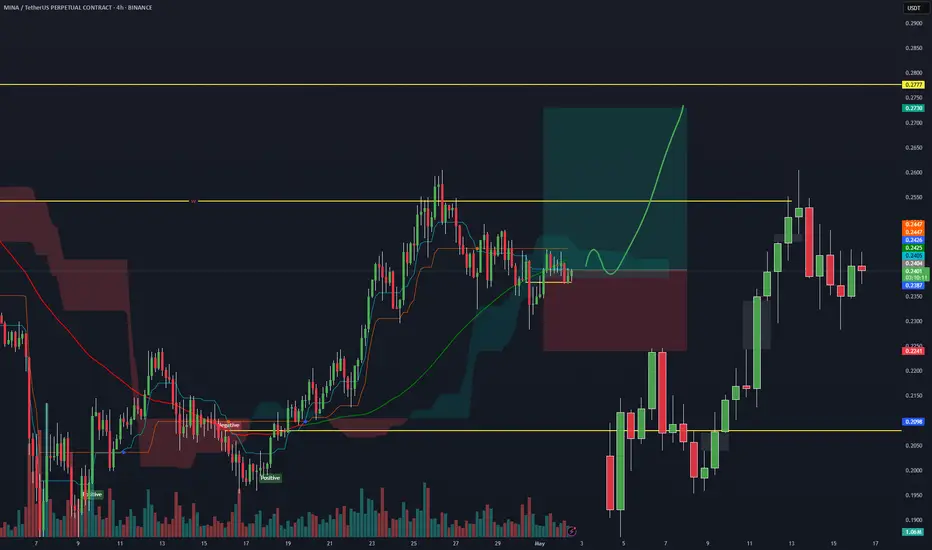
MinaReady for big pump
Breakout ma 💯 and pullback it and now ready for growing to ma 200.
Smart money inflow.
Head and shoulder pattern in daily.
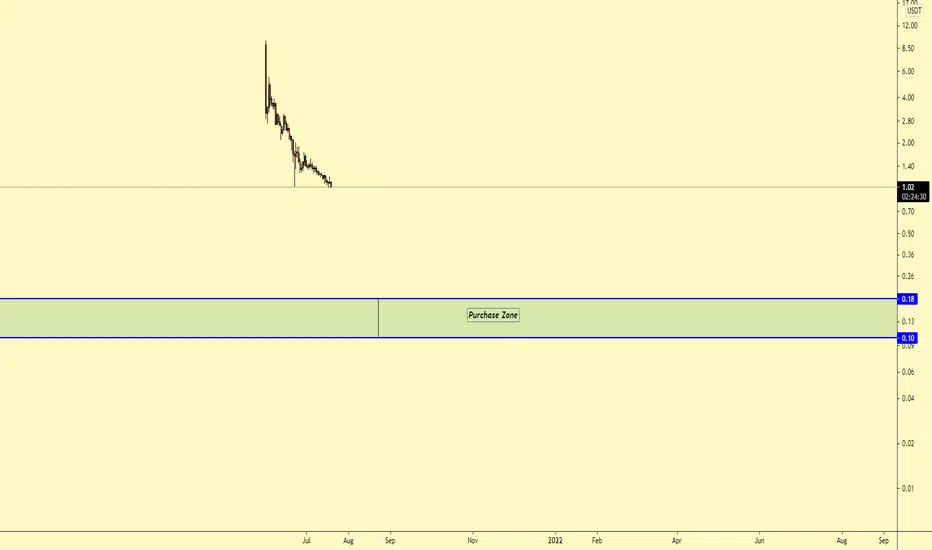
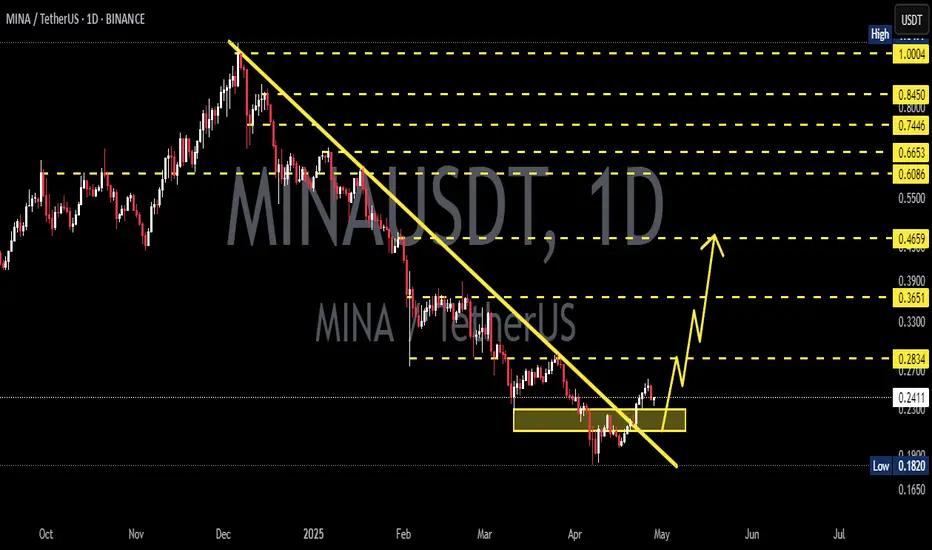
MINA : Is the shedding over ?Hello friends
Given the heavy fall of this and the prolonged price correction, you can now see that the price is supported within the specified support range, which is a good sign...
We have identified important support areas for you, where you can buy in steps and with risk and capital management
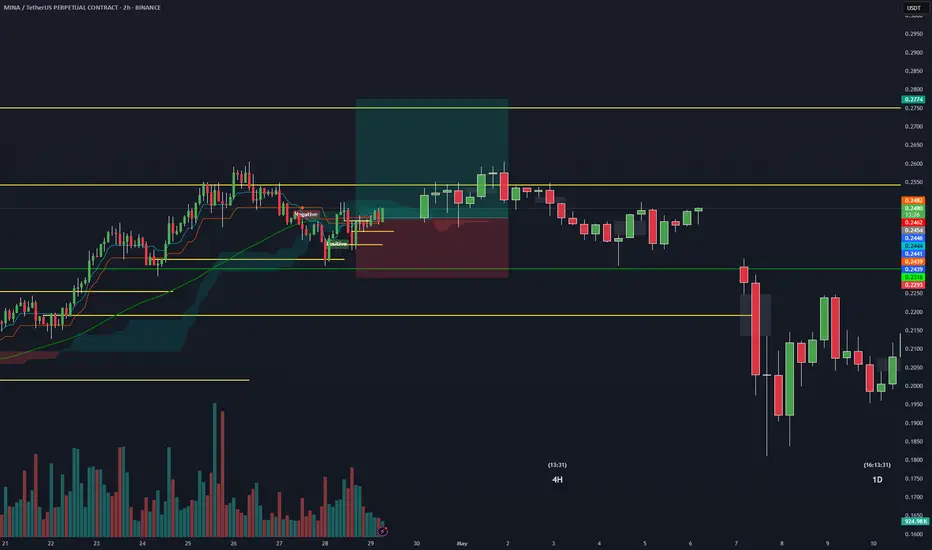
MinaFor ShortTerm expectation. Price go and back between mitigations but bullish mitigation stronger than bearish that is why mina should explode to up
MINAUSDT 1D AnalysisMINA ~ 1D Analysis
#MINA Buy gradually from here if you still have a Conviction on this coin with a short -term target of at least 15%+ from here.
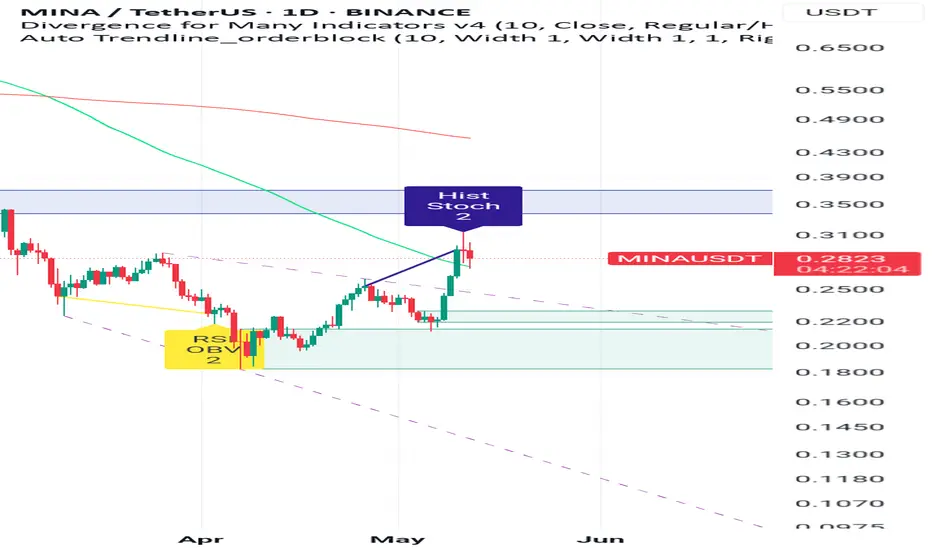
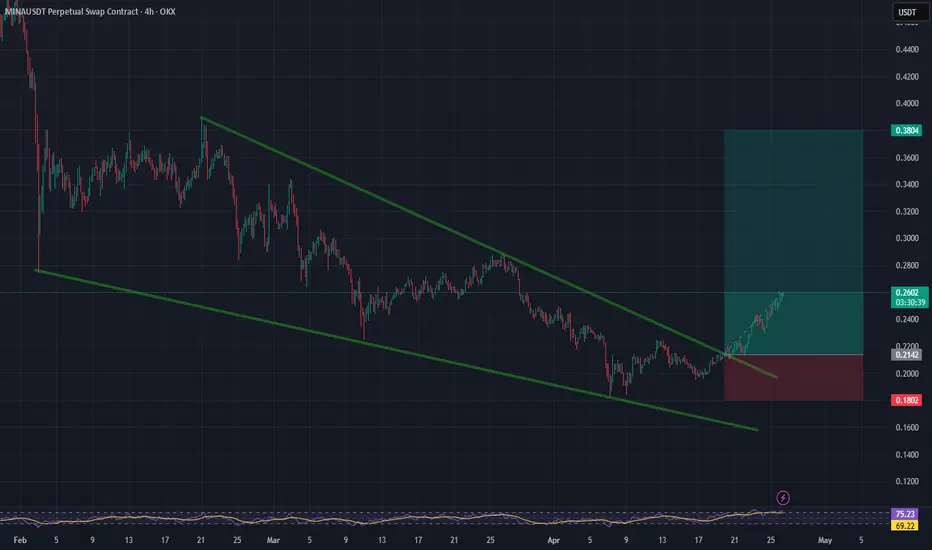
MINA/USDT Technical Analysis – 4H TimeframeMINA has broken out of a classic falling wedge pattern, indicating a potential bullish reversal. The breakout above the upper trendline suggests growing momentum and buyer interest.
✅ Key Highlights:
Price successfully broke the wedge resistance around $0.2142, confirming a bullish breakout.
Curr
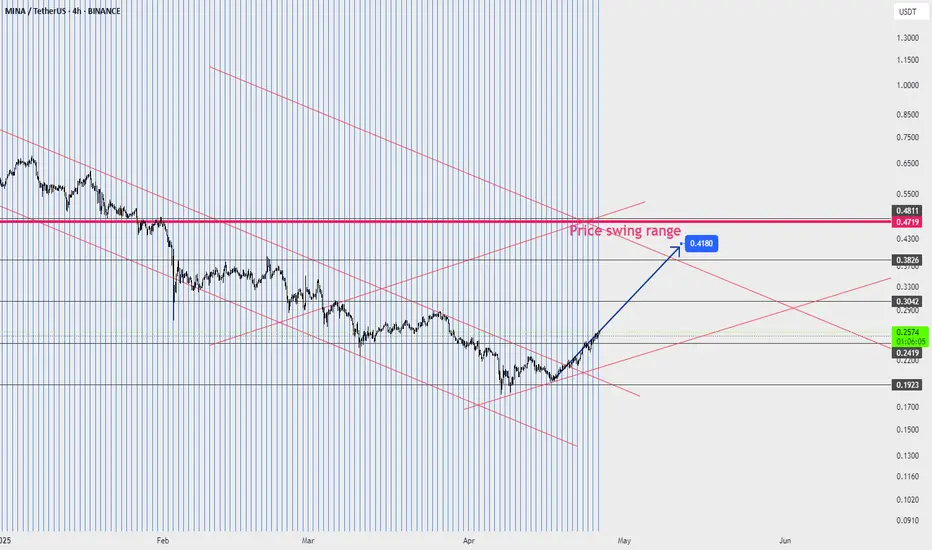
MINAIn my opinion, buying profits from any support level for spot trading can continue up to the price swing range I specified on the page, and of course, this is my opinion and the market maker is someone else.
See all ideas
Summarizing what the indicators are suggesting.
Oscillators
Neutral
SellBuy
Strong sellStrong buy
Strong sellSellNeutralBuyStrong buy
Oscillators
Neutral
SellBuy
Strong sellStrong buy
Strong sellSellNeutralBuyStrong buy
Summary
Neutral
SellBuy
Strong sellStrong buy
Strong sellSellNeutralBuyStrong buy
Summary
Neutral
SellBuy
Strong sellStrong buy
Strong sellSellNeutralBuyStrong buy
Summary
Neutral
SellBuy
Strong sellStrong buy
Strong sellSellNeutralBuyStrong buy
Moving Averages
Neutral
SellBuy
Strong sellStrong buy
Strong sellSellNeutralBuyStrong buy
Moving Averages
Neutral
SellBuy
Strong sellStrong buy
Strong sellSellNeutralBuyStrong buy
Displays a symbol's price movements over previous years to identify recurring trends.