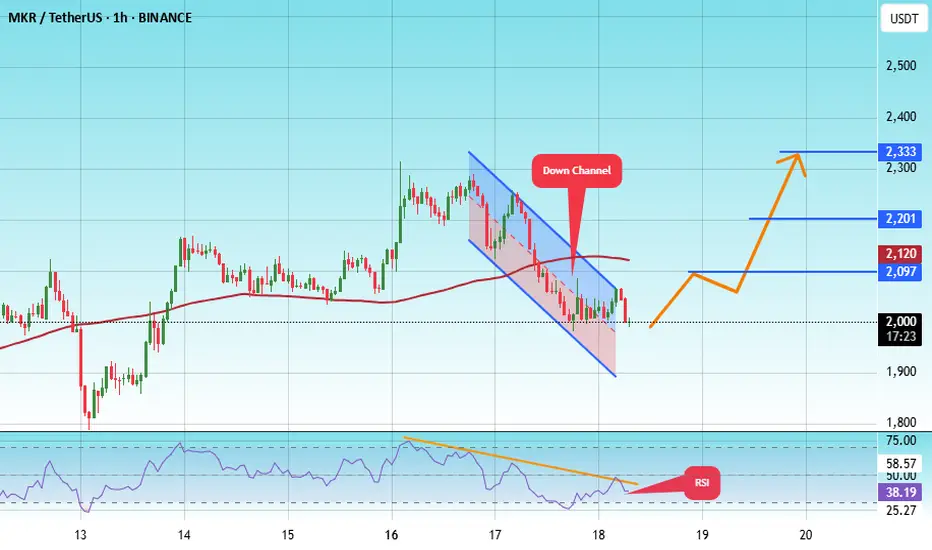
#MKR/USDT#MKR
The price is moving within a descending channel on the 1-hour frame, adhering well to it, and is heading toward a strong breakout and retest.
We are experiencing a rebound from the lower boundary of the descending channel. This support is at 2008.
We are experiencing a downtrend on the RSI i
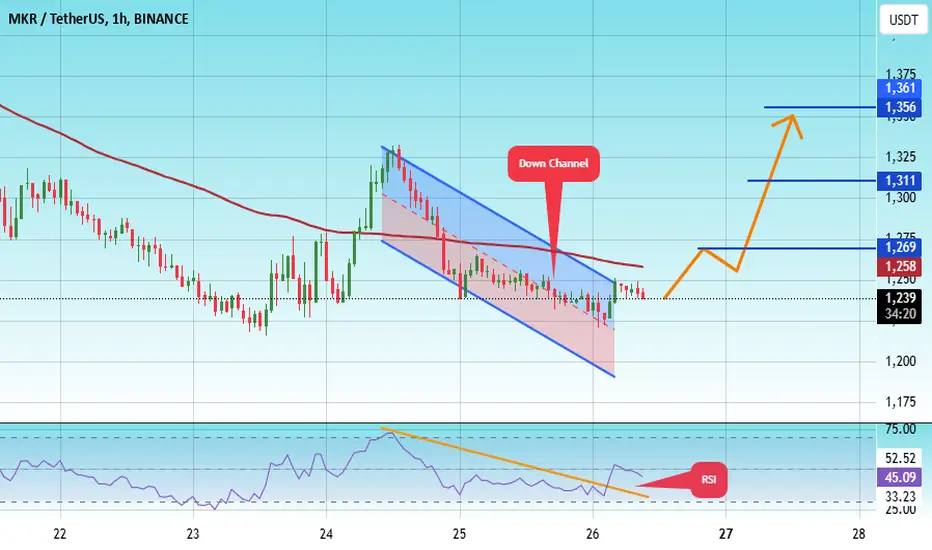
#MKR/USDT Ready to launch upwards#MKR
The price is moving in a descending channel on the 1-hour frame and is adhering to it well and is heading to break it strongly upwards
We have a bounce from the lower limit of the descending channel, this support is at a price of 1200
We have a downtrend on the RSI indicator that is about to
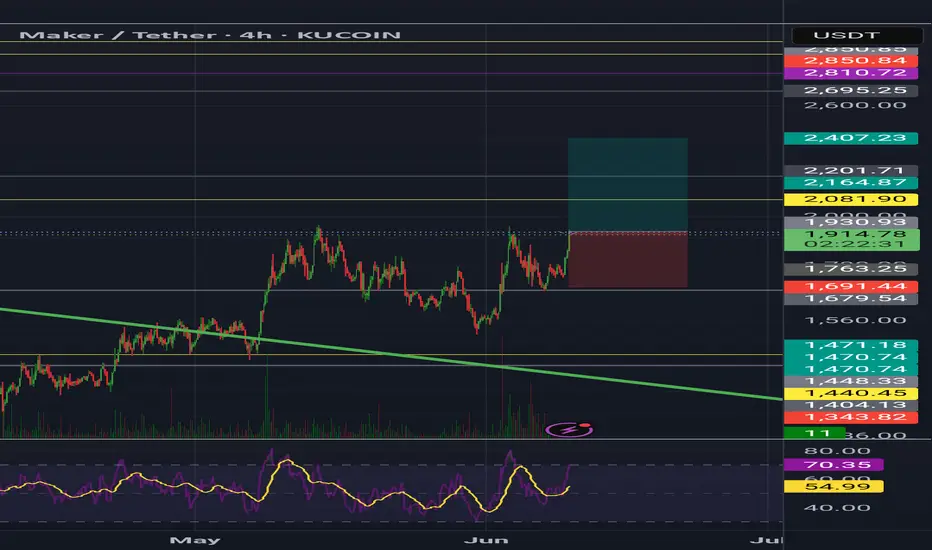
Maker (MKR)MKR usdt Daily analysis
Time frame 4hours
Risk rewards ratio =2 👈👌
Target 2400$
Now is a good opportunity to break the 1930$ resistance and reach to the next resistance area in 2400$
But if mkr can't break this resistance, will fall down to 1600$
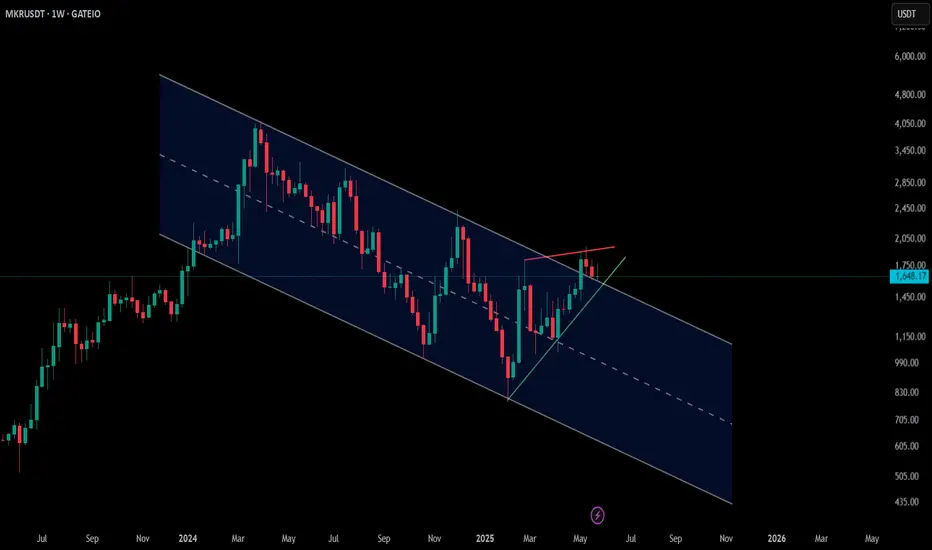
MKR 1W🔍1. Overall Trend:
In the long term, we can see that MKR was in a downtrend, as evidenced by the falling trendline (orange dashed line).
The last candles show that the price has broken this downtrend line - this could indicate a potential trend reversal or at least an attempted upside correction.

MKR – Weekly Channel Breakout, Daily Rising Wedge📈 GATEIO:MKRUSDT has broken out of a long-term descending channel on the weekly chart, and the retest is holding so far — a sign of potential strength.
🔹 On the daily timeframe, price action is forming a rising wedge — a structure to watch closely as momentum could build quickly if confirmed.
💡
MKRUSDT 1D AnalysisMKR ~ 1D Analysis
#MKR Buy on retest of this support block with short term target of at least 10%++ from here.
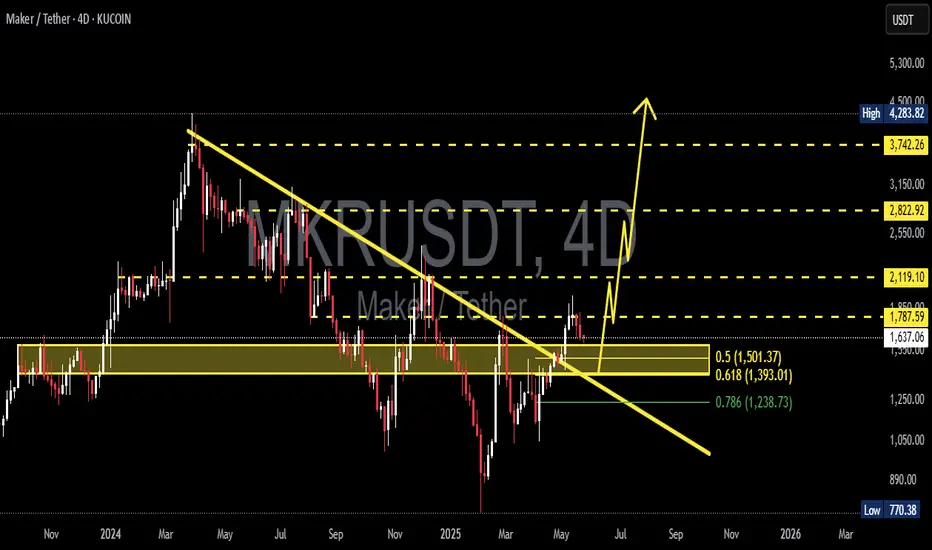
MKRUSDT 1W#MKR has broken above the descending resistance on the weekly timeframe. Is $4000 on the way?
The technical breakout looks promising.
Consider buying some #MKR between $1687 and $1556.
Targets are:
🎯 $2037
🎯 $2426
🎯 $2815
🎯 $3369
🎯 $4074
⚠️ Use a tight stop-loss.

MKR breakout confirmedSuccessfully breakout this resistant line with a short -term target of at least +20% - 50%

MKR READY FOR PUMP AFTER RETESTMKRUSDT did market shift, as did sweep of previous low liquidity and did BOS. Will look for long positions in marked FVG areas.

Maker ready to go balistic!- trading within what appears to be a descending broadening wedge for the last year
- with ETH likely heading towards at least 2.6k for a mean reversion play, it is very likely Maker is one of the coins that benefit from ETH strength the most
- target of the formation is SUBSTANTIALLY higher

See all ideas
Summarizing what the indicators are suggesting.
Oscillators
Neutral
SellBuy
Strong sellStrong buy
Strong sellSellNeutralBuyStrong buy
Oscillators
Neutral
SellBuy
Strong sellStrong buy
Strong sellSellNeutralBuyStrong buy
Summary
Neutral
SellBuy
Strong sellStrong buy
Strong sellSellNeutralBuyStrong buy
Summary
Neutral
SellBuy
Strong sellStrong buy
Strong sellSellNeutralBuyStrong buy
Summary
Neutral
SellBuy
Strong sellStrong buy
Strong sellSellNeutralBuyStrong buy
Moving Averages
Neutral
SellBuy
Strong sellStrong buy
Strong sellSellNeutralBuyStrong buy
Moving Averages
Neutral
SellBuy
Strong sellStrong buy
Strong sellSellNeutralBuyStrong buy
Displays a symbol's price movements over previous years to identify recurring trends.