MKR/USDT (MakerDAO) on the 4H time frame🔷 1. Trend and market structure
🔸 Upward channel:
The price is moving in a wide, ascending channel (orange lines).
The lower line of the channel was last tested on June 22, 2025, which ended with a dynamic upward bounce.
The upper limit of the channel reaches around 2,450 USDT.
🕸️ Market phase:
In the short term, the market was in a downward correction phase within the uptrend.
Currently, we see a strong rebound from support - a new uptrend is possible.
🔷 2. Key horizontal levels (support/resistance)
🟥 Support:
1,637 USDT - local support (the lowest level of the red zone), almost tested at the bottom.
1,717 USDT - very technical support, tested several times.
1,800 USDT – psychological level and local consolidation.
1,901 USDT – last support peak, currently broken upwards.
🟩 Resistances:
2,003 USDT – current price level, currently tested as new resistance.
2,129 USDT – strong resistance from previous peaks.
2,264 USDT – previous swing high.
2,433 USDT – upper boundary of the channel and technical level from historical peaks.
🔷 3. Price and candle behavior
Strong demand reaction at the lower boundary of the channel: long pin bar/bull's embrace at the lower boundary.
The upward movement was dynamic and uniform, which indicates high buyer activity.
If the price stays above 1,901 USDT – further increases are possible.
🔷 4. Technical indicators
🔁 Stochastic RSI (4H):
Currently in the overbought zone, just below the level of 100 - a temporary correction or consolidation may occur.
However, with a strong upward trend, Stoch RSI may "stick" to the upper band - it does not yet give a clear S/S signal.
🔷 5. Technical scenarios
🟢 Bullish scenario (continuation of growth):
Condition: maintaining the level above 1,901 USDT.
Targets:
TP1: 2,129 USDT
TP2: 2,264 USDT
TP3: 2,433 USDT (upper limit of the channel)
Stop-loss: below 1,800 USDT
🔴 Bearish scenario (rejection of resistance):
Condition: strong rejection of 2,003 USDT and return below 1,901
Targets:
TP1: 1,800 USDT
TP2: 1,717 USDT
TP3: 1,637 USDT
SL: return above 2,003 USDT
🔷 6. Final remarks
The current upward movement looks like a "V-shape reversal" reaction - a sharp turnaround with dynamic volume suggests strong buyer interest.
The key will be the reaction to 2,003 USDT - a breakout and retest can give a very good long entry.
Short positions are risky as long as the price is in the lower half of the ascending channel.
MKRUSDT.P trade ideas

#MKR/USDT#MKR
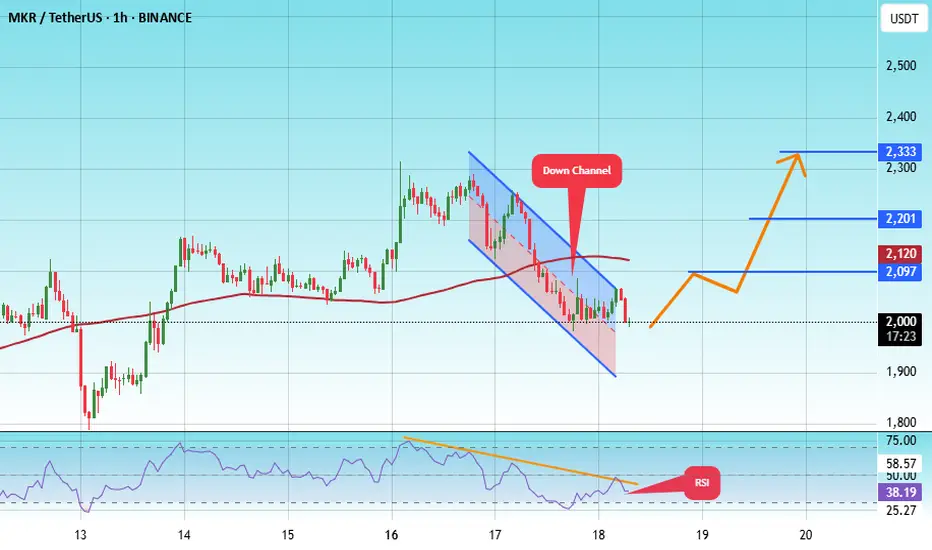
The price is moving within a descending channel on the 1-hour frame, adhering well to it, and is heading toward a strong breakout and retest.
We are experiencing a rebound from the lower boundary of the descending channel. This support is at 2008.
We are experiencing a downtrend on the RSI indicator, which is about to break and retest, supporting the upward trend.
We are heading toward stability above the 100 moving average.
Entry price: 2333
First target: 2201
Second target: 2097
Third target: 2333
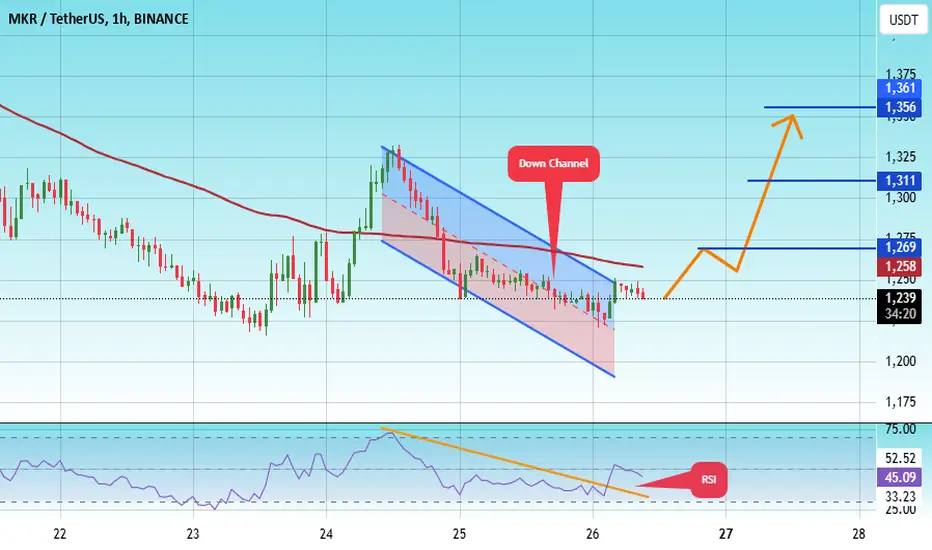
#MKR/USDT Ready to launch upwards#MKR
The price is moving in a descending channel on the 1-hour frame and is adhering to it well and is heading to break it strongly upwards
We have a bounce from the lower limit of the descending channel, this support is at a price of 1200
We have a downtrend on the RSI indicator that is about to be broken, which supports the rise
We have a trend to stabilize above the moving average 100
Entry price 1243
First target 1270
Second target 1311
Third target 1356
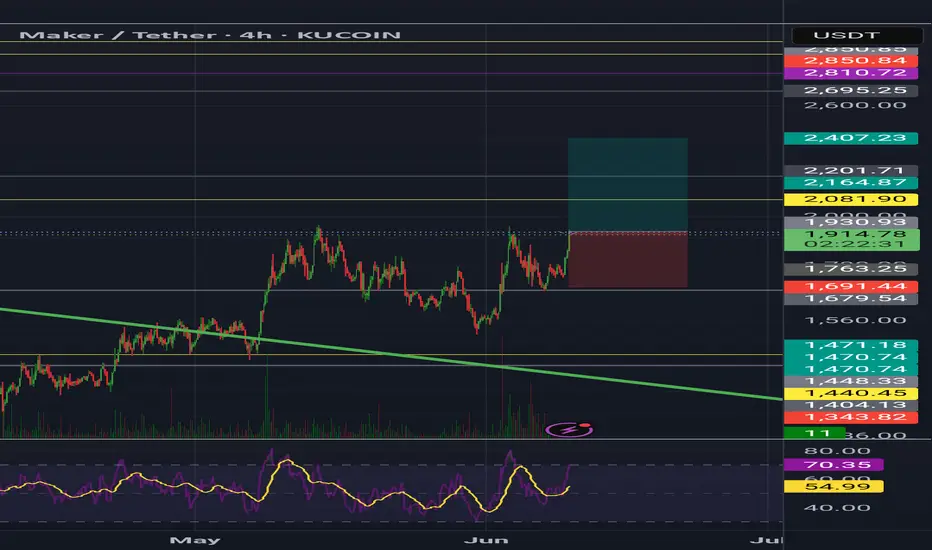
Maker (MKR)MKR usdt Daily analysis
Time frame 4hours
Risk rewards ratio =2 👈👌
Target 2400$
Now is a good opportunity to break the 1930$ resistance and reach to the next resistance area in 2400$
But if mkr can't break this resistance, will fall down to 1600$
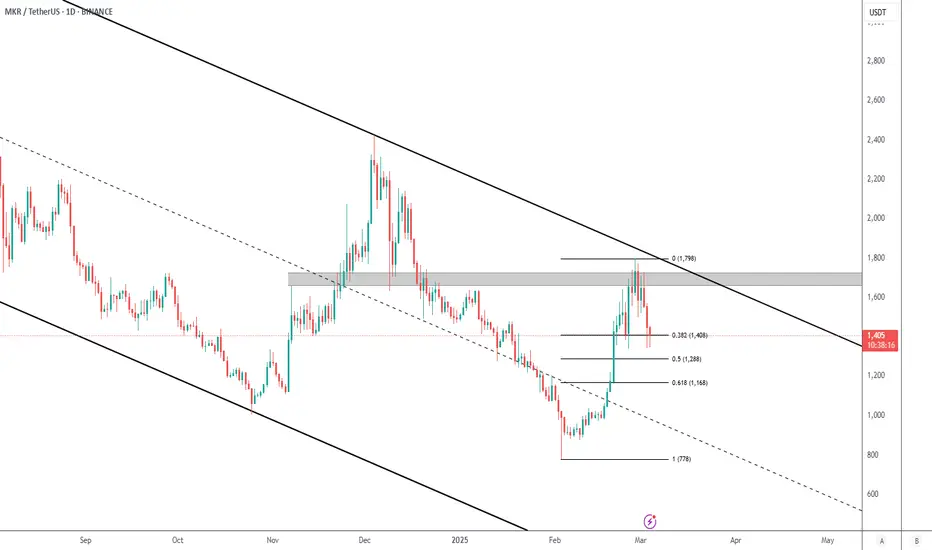
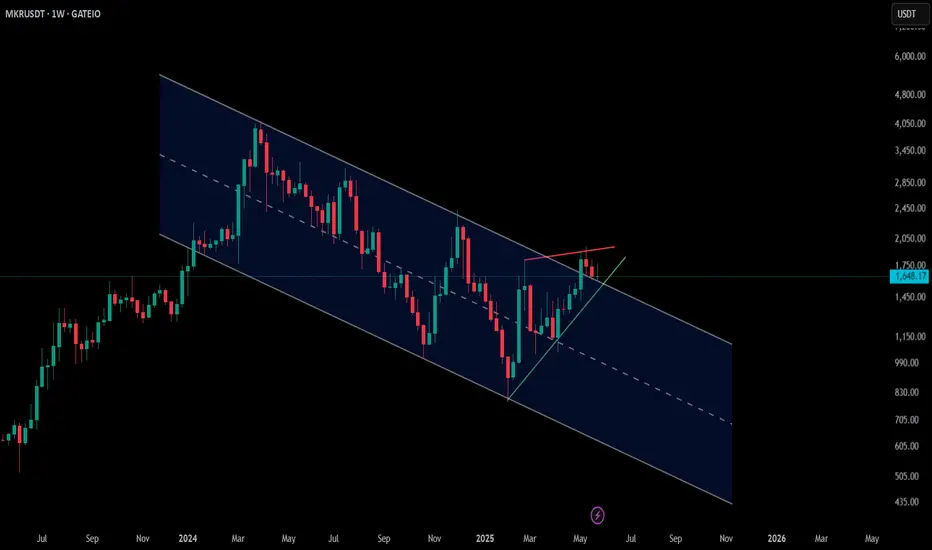
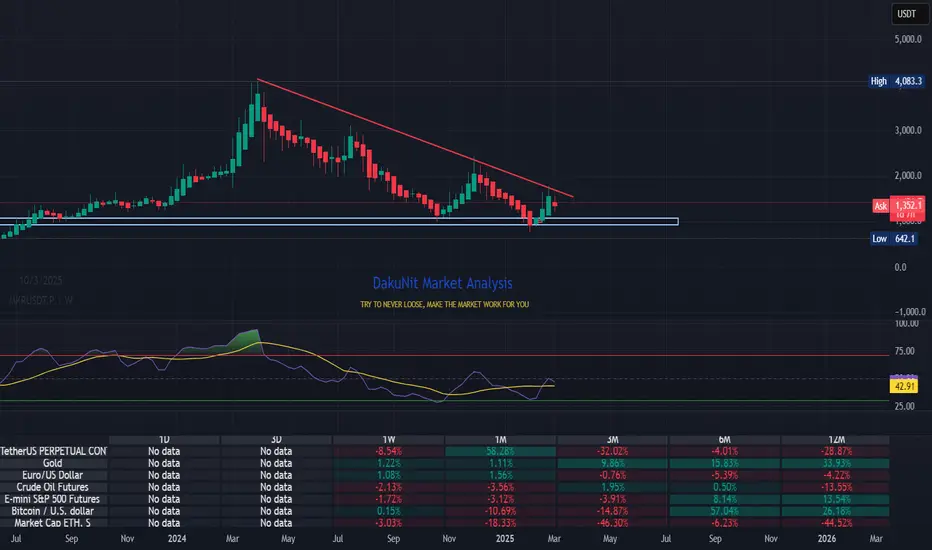
MKR 1W🔍1. Overall Trend:
In the long term, we can see that MKR was in a downtrend, as evidenced by the falling trendline (orange dashed line).
The last candles show that the price has broken this downtrend line - this could indicate a potential trend reversal or at least an attempted upside correction.
📊Support and resistance levels (horizontal chart):
Strong support (red) and resistance (green) levels are marked:
✅ Resistances:
~3,770 USDT – local top, very strong resistance.
~3,079 USDT – previous support, now acting as resistance.
~2,002 USDT – current growth barrier, price is currently struggling with this level.
🔻 Supports:
~1,574 USDT – current local support.
~1,248 USDT – next support, previously tested.
~800 USDT and ~400 USDT – historical accumulation zones, deep support levels.
Oscillators (bottom of the chart):
Stochastic RSI – currently in the upper zone, which may suggest that the market is approaching overbought. Possible correction.
RSI (classic) – oscillates around 50, i.e. neutral, but with a slight upward slope. There is no overbought signal yet.
🧠 Conclusions:
➕ Bullish signals (pro-growth):
Break of the downtrend line (may be the first signal of a trend change).
Formation of a higher low.
Oscillators are not yet in the extreme zone.
➖ Bearish signals (pro-fall):
The price has not yet managed to break the resistance at 2,002 USDT.
Stochastic RSI indicator close to the overbought zone - possible short correction.
📌 Scenarios:
1. Upside scenario:
If the price breaks through the 2,002 USDT level and stays above it, the next target will be the 3,079 USDT level.
Confirmation will be the rising RSI and staying above the trend line.
2. Downside scenario:
If the price fails to break through the 2,002 USDT level and falls below the 1,574 USDT level, a possible test of the 1,248 USDT level or even lower (800 USDT).

MKR – Weekly Channel Breakout, Daily Rising Wedge📈 GATEIO:MKRUSDT has broken out of a long-term descending channel on the weekly chart, and the retest is holding so far — a sign of potential strength.
🔹 On the daily timeframe, price action is forming a rising wedge — a structure to watch closely as momentum could build quickly if confirmed.
💡 Risk management is key — safe stop-losses and tight entries are the name of the game here.
👀 Stay alert — this one is heating up!
MKRUSDT 1D AnalysisMKR ~ 1D Analysis
#MKR Buy on retest of this support block with short term target of at least 10%++ from here.
MKRUSDT 1W#MKR has broken above the descending resistance on the weekly timeframe. Is $4000 on the way?
The technical breakout looks promising.
Consider buying some #MKR between $1687 and $1556.
Targets are:
🎯 $2037
🎯 $2426
🎯 $2815
🎯 $3369
🎯 $4074
⚠️ Use a tight stop-loss.

MKR breakout confirmedSuccessfully breakout this resistant line with a short -term target of at least +20% - 50%

MKR READY FOR PUMP AFTER RETESTMKRUSDT did market shift, as did sweep of previous low liquidity and did BOS. Will look for long positions in marked FVG areas.

Maker ready to go balistic!- trading within what appears to be a descending broadening wedge for the last year
- with ETH likely heading towards at least 2.6k for a mean reversion play, it is very likely Maker is one of the coins that benefit from ETH strength the most
- target of the formation is SUBSTANTIALLY higher

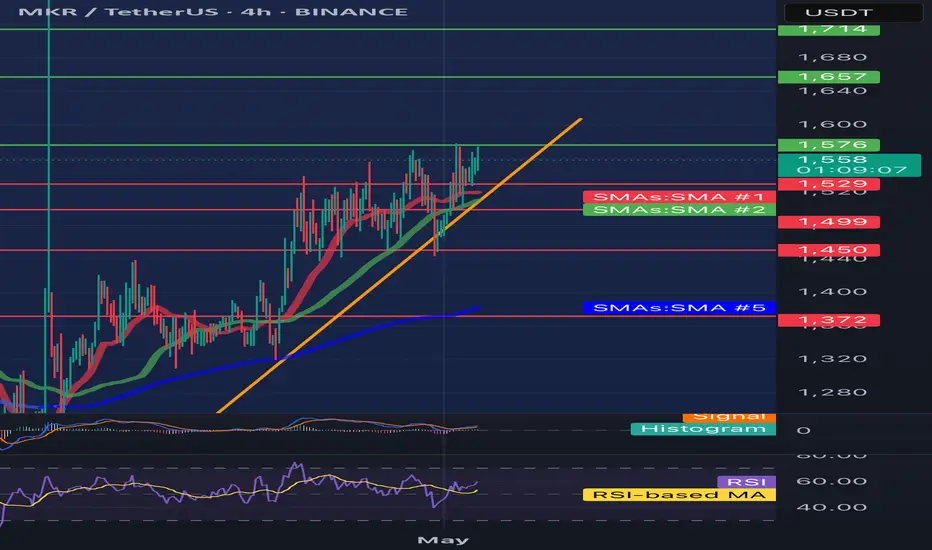
MKR/USDT 4h chart ReviewHello everyone, let's look at the 4H MKR chart to USDT, in this situation we can see how the price moves on the created upward trend line. Going further, let's check the places of potential target for the price:
T1 = $ 1576
T2 = 1657 $
Т3 = 1714 $
Let's go to Stop-Loss now in case of further declines on the market:
SL1 = $ 1529
SL2 = $ 1499
SL3 = $ 1450
SL4 = 1372 $
Looking at the RSI indicator, we see
How slight relaxations give space for further increases by living in the upward trend of price.
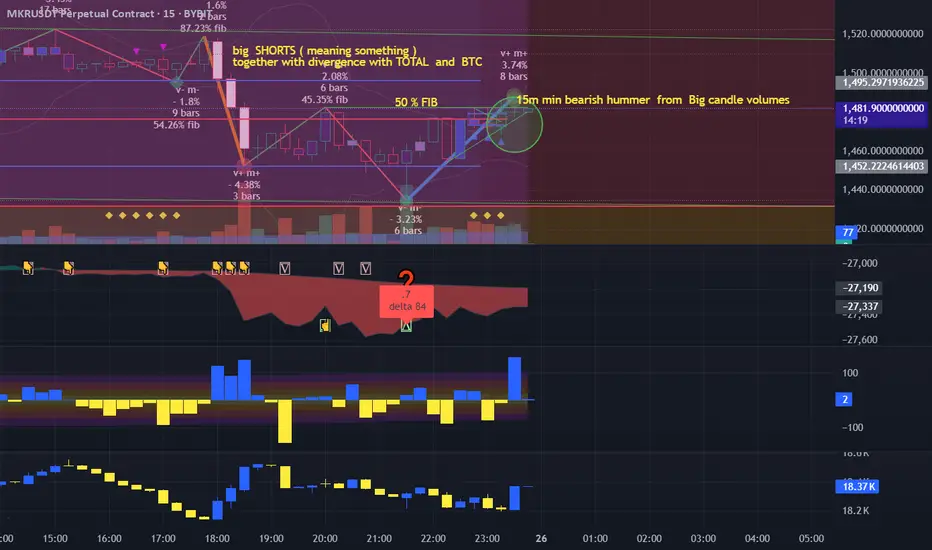
SHORT MKR Big 3 shorts looks like appearing big distribution
reflection on a 15 minutes from them
appearing big volumes and divergence with TOTAL3 and BTC ( MKR are not growing instead of them )
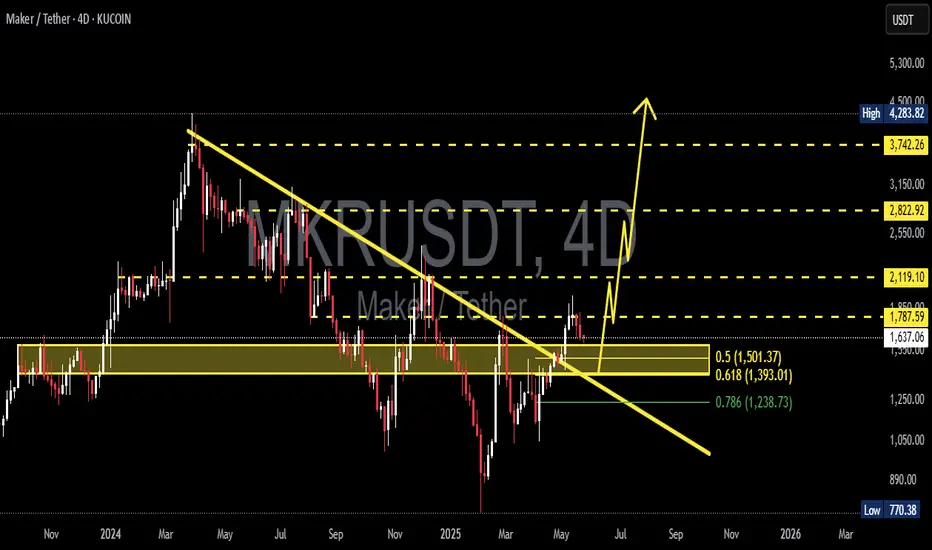
MKR Falling Wedge Breakout + Target & Key LevelsBINANCE:MKRUSDT just broke out of a 1-year long falling wedge, see 1D zoom below.
Further confirmation would be either:
• Daily retest of the resistance as support
• Weekly close above the resistance
Key Levels to Watch
Aside from the demand zone, these are all potential resistances and good candidates for partial TPs.
• $520-$720: Key demand zone. A break below it would invalidate any bullish setup.
• $1600-$1800: Daily sell order block, and the first resistance to overcome.
• ~$2000: 0.382 fib of the move down, and HVN*.
• $2300-$2400: 0.5 fib of the move down, daily sell order block and previous support
• ~$2800: 0.618 fib of the move down, and HVN*.
• $3800-$4000: Daily sell order block, and 2024 high.
The falling wedge measured target is $3700 .
* HVN = High Volume Node

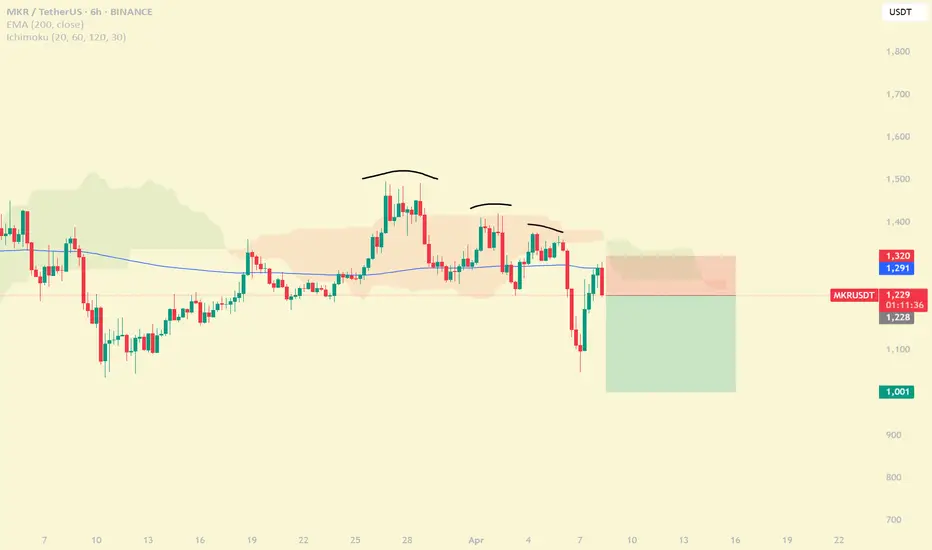
$MKR Short IdeaWe are seeing another lower high being made with the strong rejection on the 200EMA on the 6H time frame. Looking for a breakdown into a new lower low around ~1,000
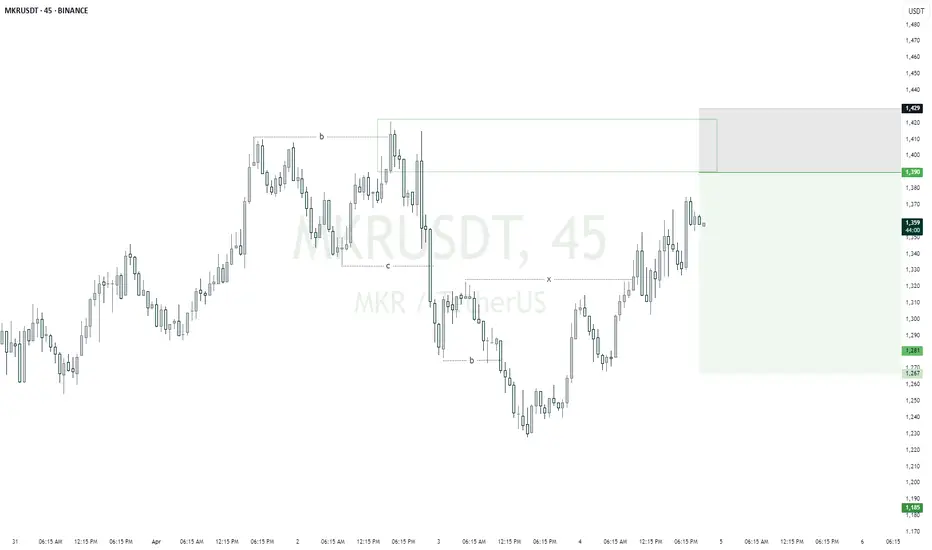
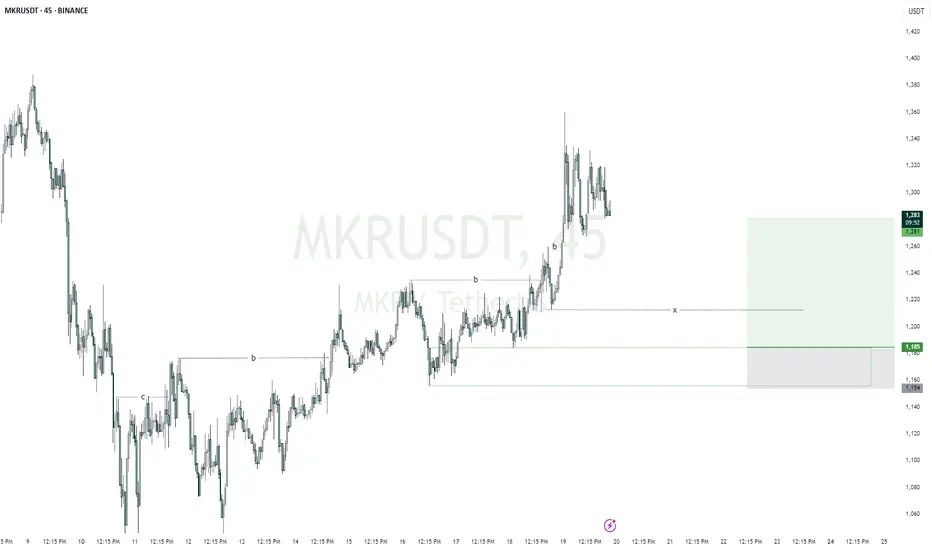
MKRUSDTmy entry on this trade idea is taken from a point of interest above an inducement (X).. I extended my stoploss area to cover for the whole swing as price can target the liquidity there before going as I anticipate.. just a trade idea, not financial advise
Entry; $01390
Take Profit; $1267
Stop Loss; $1429
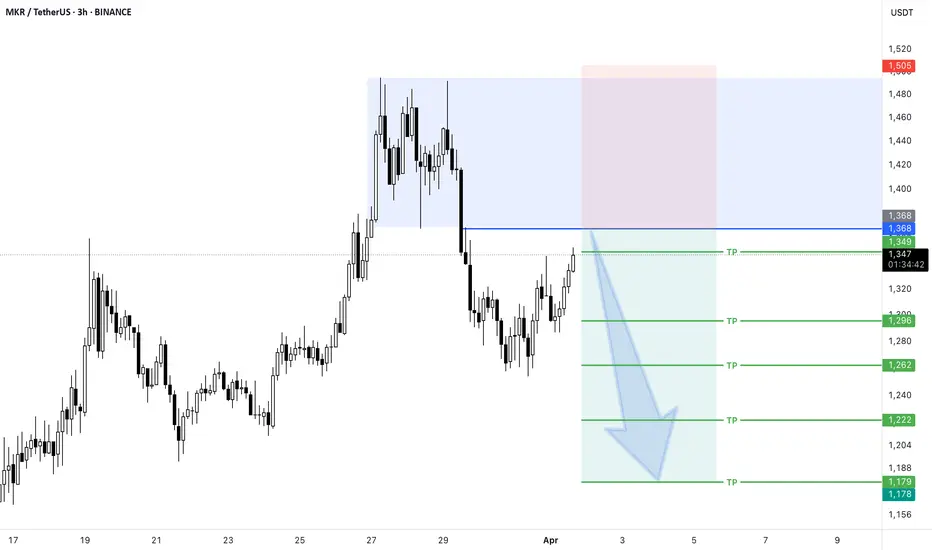
Short Position MKR/USDT#Singal
MKR/USDT
🔴 Short Position
🎲 Entry @ 1,368
✅ Target1@ 1,349
✅ Target2 @ 1,296
✅ Target3 @ 1,262
✅ Target4 @ 1,222
✅ Target5 @ 1,179
❌ Stop Loss @ 1,505
Leverage: 5X_15X
Margin: 10% of Wallet Balance
⚠️"Take Care of Risk Management for Your Account"
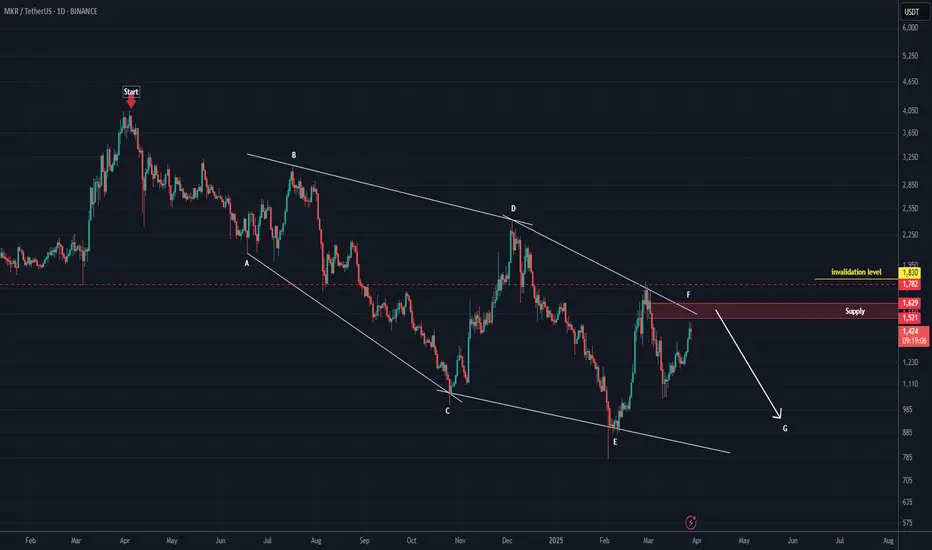
MKR Looks Bearish (1D)The correction of MKR seems to have started from the point marked START on the chart.
This correction appears to be a diametric pattern, and we are now in the late stages of wave F, which has been a bullish wave.
It is expected that from the red zone, wave G a bearish wave will begin.
The closure of a daily candle above the invalidation level will invalidate this analysis.
For risk management, please don't forget stop loss and capital management
Comment if you have any questions
Thank You
MKRUSDTmy entry on this trade idea is taken from a point of interest below an inducement (X).. I extended my stoploss area to cover for the whole swing as price can target the liquidity there before going as I anticipate.. just a trade idea, not financial advise
Entry; $1185
Take Profit; $1281
Stop Loss; $1154
#MKR Bears in Control: Is a Breakdown Inevitable or Not?Yello, Paradisers! Is #MKR setting up for another leg down, or will the Bulls finally step in? The structure is clear; this could get ugly unless something changes soon. Let’s break down the #Maker setup:
💎#MKRUSDT is forming a Descending Leading Diagonal, a classic bearish pattern within a larger zigzag correction. This structure suggests that sellers remain in control, with each bounce being met by renewed selling pressure.
💎Price is currently reacting off the descending support near $1,160. While a short-term bounce toward $1,250 - $1,300 is possible, it remains within the bearish framework. The critical resistance to watch is at $1,333—a breakout above this level would invalidate the bearish setup and signal a shift in momentum.
💎If the bearish structure holds, the next leg down could take us to the strong support zone at $1,000 - $950. This is where buyers will have their last real chance to defend the trend. A failure to hold this level could open the door to a deeper correction.
💎RSI remains weak, showing no strong bullish divergence, signaling that momentum is still in favor of the sellers. The volume is declining, meaning the recent price action lacks strong buying conviction.
Strive for consistency, not quick profits. The market rewards discipline and patience—trade smart, Paradisers!
MyCryptoParadise
iFeel the success 🌴

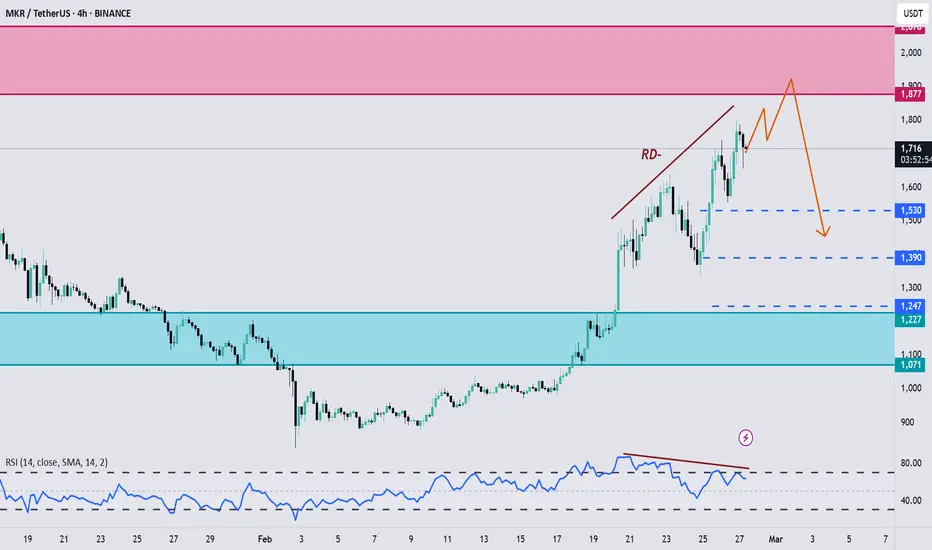
MKR, Ready for a short opportunity !!!Hello Traders, Hope you are doing great.
After a good upward movement that happened in last weeks, now it seems that bulls are going to lose their control and we'll probably see a downward correction after the price reaches to the specified supply zone, we also have regular divergences on 4H and Daily timeframes.
So for upcoming days I expect a slowly upward movement at first and after that Bears step in and cause a downward correction happen. Targets have determined by Blue dashed lines.
And finally Tell me What are your thoughts about MKR ? UP or DOWN ? comment your opinion below this post.
MKR Correction
MKR is one of the better looking altcoins out there, currently correcting an impulsive wave which began early February.
I'll be looking for long trades in smaller timeframes once price hits the 50% pullback.
Strong gray resistance held price on the first try, but I believe it will be at least retested