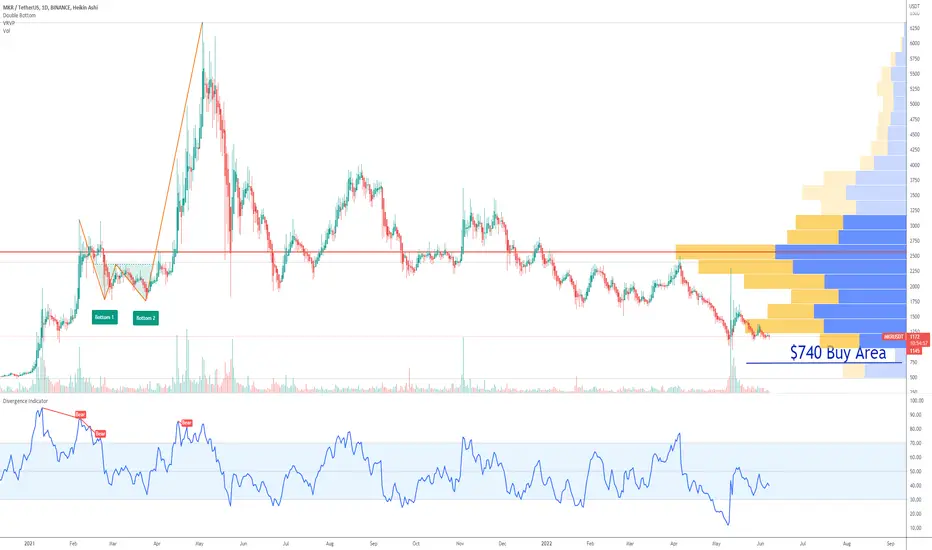
MKR Buy AreaA leaked copy of US draft bill proposes to eliminate anonymous crypto projects.
DAOs, DeFi and exchanges will be required to legally register in the US!
My entry area for MKR is $740
Looking forward to read your opinion about it.
MKRUSDT.P trade ideas
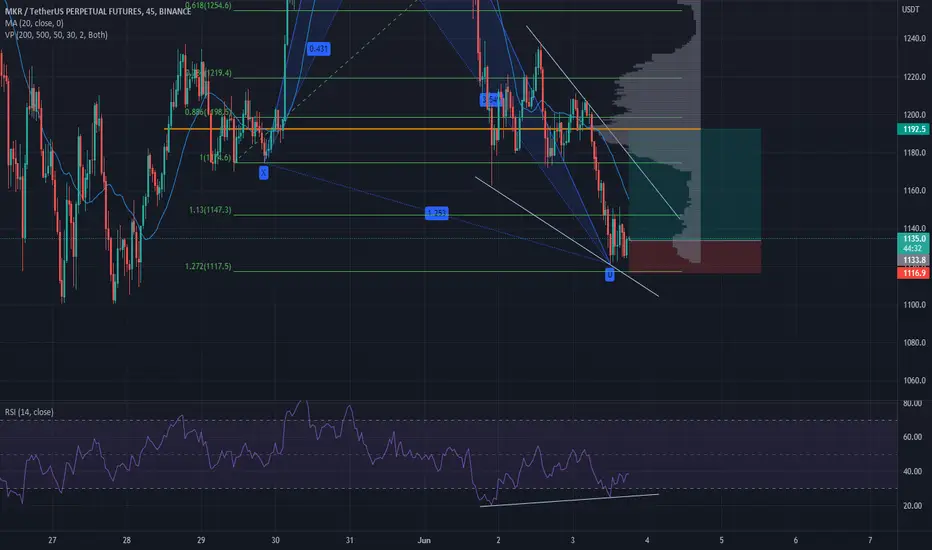
MKR SCALP IS HERE!!! MKR UPDATE 4HTFHi, Random analyst here, So here's the chart and scalp of MKR/USDT. Dont forget to like and follow me for more daily scalps..
Entry
1141
Dca 1132
Targets ( for scalpers )
1178
1210
1230
Holder
1600
2000

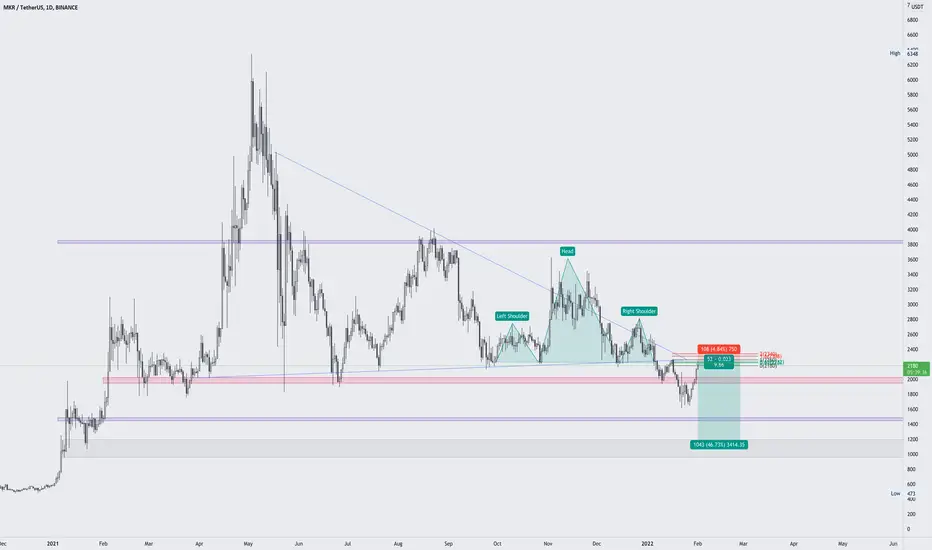
MKRUSDT price retest completePrice has successfully retest the bearish order block of bot head and shoulder and descending triangle.
As soon as BTC start falling its a go. Wait for a bearish PA.

MKRUSDT is going to retest the supportThe price bounced from 1000$ after UST disaster. Maker Dao bounds with DAI stable coin.
the price got a rejection from 1700$ where the market created the daily resistance and supply zone. The price got the new liquidity to create a new bearish impulse
How to approach?
ID the price is coming to lose the support on 1440$ and retest as new resistance, According to Plancton's strategy , we can set a nice order
–––––
Keep in mind.
🟣 Purple structure -> Monthly structure.
🔴 Red structure -> Weekly structure.
🔵 Blue structure -> Daily structure.
🟡 Yellow structure -> 4h structure.
–––––
Follow the Shrimp 🦐

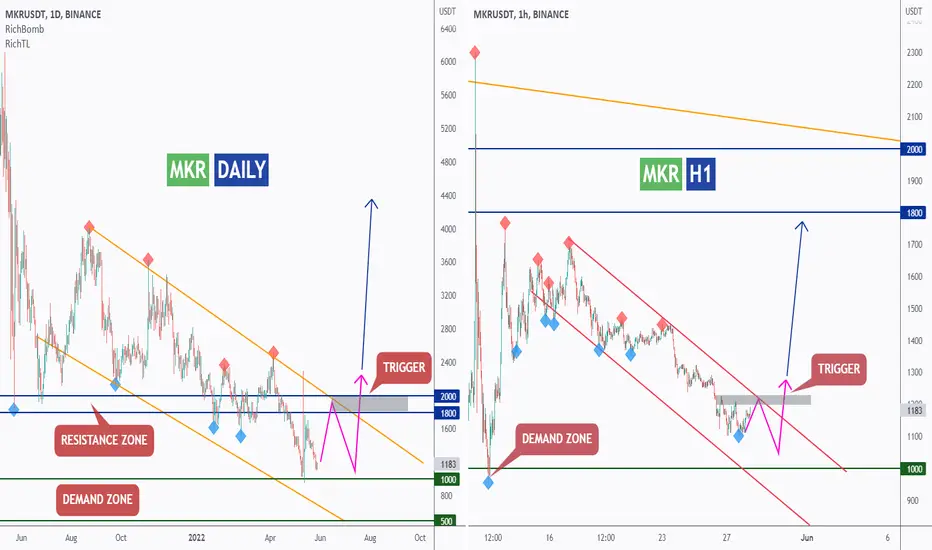
MKR - Top-Down Analysis!Hello TradingView Family / Fellow Traders. This is Richard, as known as theSignalyst.
DAILY: Left Chart
MKR is overall bearish trading inside our orange channel. For the bulls to take over from a long-term perspective, we need a break above the upper orange trendline and 2000 resistance zone in blue.
Meanwhile, since we are approaching a demand zone and round number 1000, we will be looking for buy setups on lower timeframes.
H1: Right Chart
MKR is forming a channel in red but the upper trendline is not valid yet, so we are waiting for a new swing high to form around it to consider it our trigger swing. (projection in purple)
Trigger => Waiting for that swing to form "and then" buy after a momentum candle close above it (gray zone)
Meanwhile, until the buy is activated, MKR can still trade lower inside the demand zone in green. In this case, we will be looking for new buy setups to form.
Always follow your trading plan regarding entry, risk management, and trade management.
Good luck!
All Strategies Are Good; If Managed Properly!
~Rich
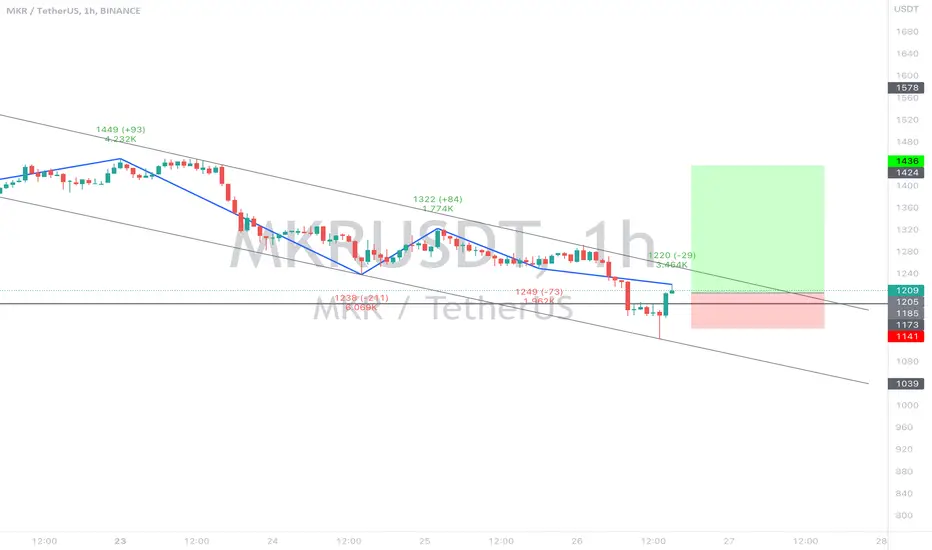
Maker , Long.....Strong buyBitcoin experience another bearish moment when the bears step in and push the market down to as long as $28,000
And on another, maker has also moved from a resistance to hold a support at 1100.
The bulls step in and buy orders filled up quickly where our support zone held after the retest..
a zig indicator was used and the upper trend lines gave me a clear buy entry position..
My take profit was set at 1425
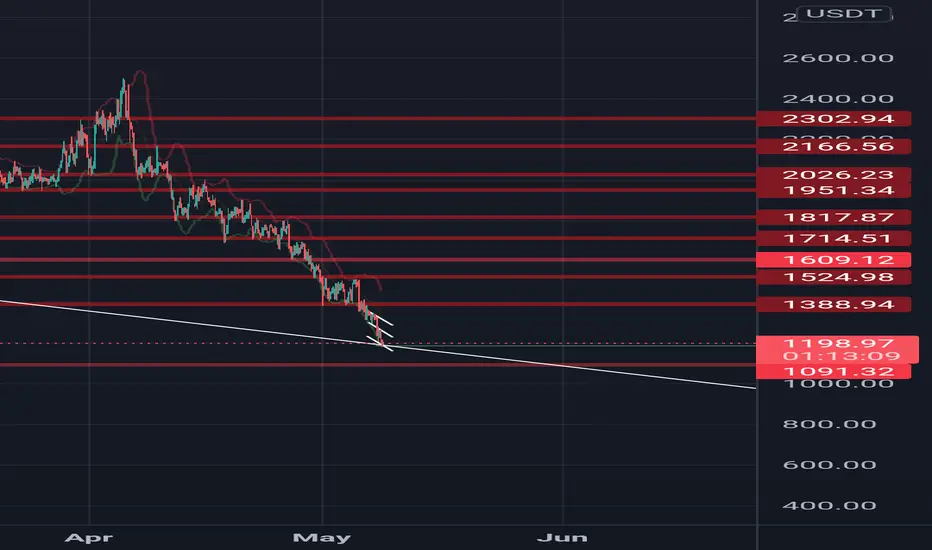
MKRUSDT market structure through Support and Resistance levels1. MKRUSDT trading pair is in a global downward price channel.
2. The violet zone is the price area where the most amount of volume was traded.
Through identification of areas of support and resistance, we identify areas in the market which will form barriers to the trading timeframe trend. We`ve defined our battlefield. Price then moves within the framework defined by these levels, back and forth between levels of support and resistance, based on the decision making of traders.

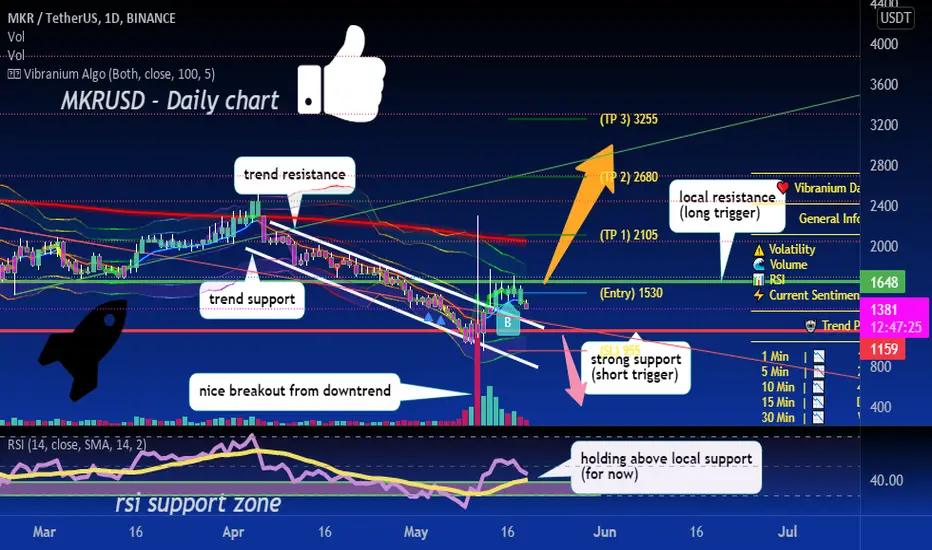
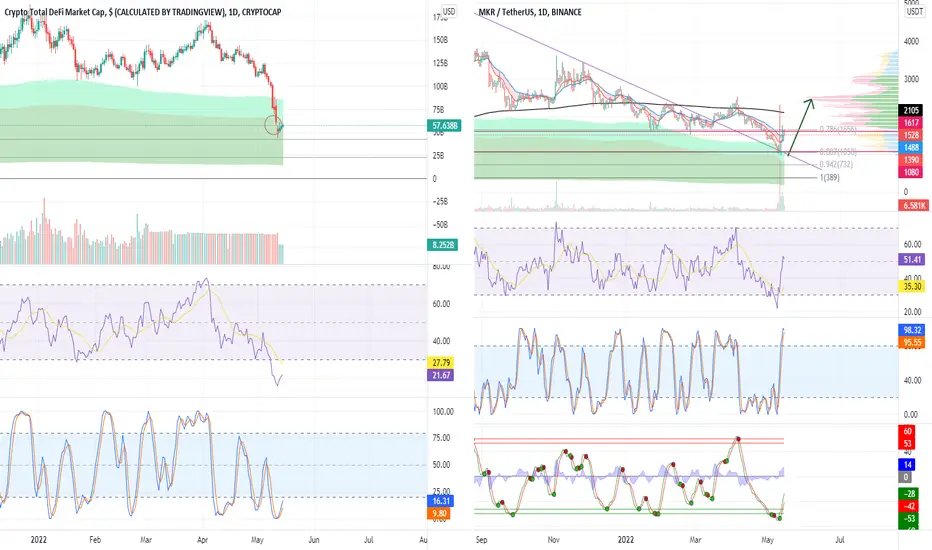
will the downtrend breakout hold? nice breakout from the downtrend channel, unusual buying volume as well.
above 1648 we can target 2105-2680-3255
Below 1159 we will see 1000 and maybe even lower
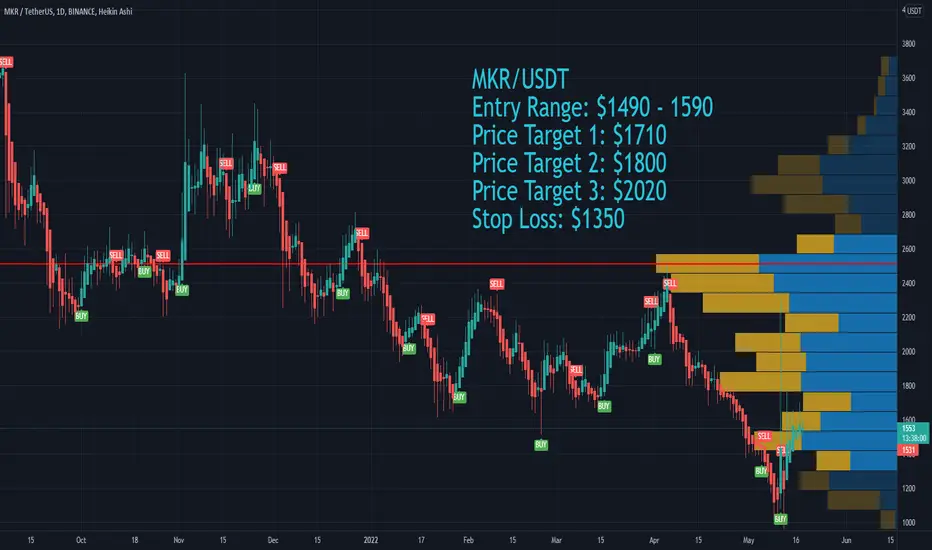
Maker MKR Price Targets and Stop LossMKR/USDT
Entry Range: $1490 - 1590
Price Target 1: $1710
Price Target 2: $1800
Price Target 3: $2020
Stop Loss: $1350
MKRUSDTlet see can we open a short position please say your opinion i think if we break 1505 yellow line we will see 1470 and if break through the 1470 the next price is 1320 .
MKR, no.1 TVL looks niceMKR just gained lots of in flow after the crash of UST and it is looking very good both in term of TVL dominance on ETH and price action chart.
1. 1000 USD is a solid support here if you want to buy or go long for a swing trade it is a good SL point.
2. MKR is no.1 TVL in couple of TOTALDEFI chart both seems to confirm with a confluence here. MKR STORSI/RSI seems to complete while TOTALDEFI shows an exhaustion gap and a rejection at fib 0.78.
3. If MKR can still function nicely without a problem of DAI peg dislocation, it might be the first in DEFI in recovery from the Bearish trend.
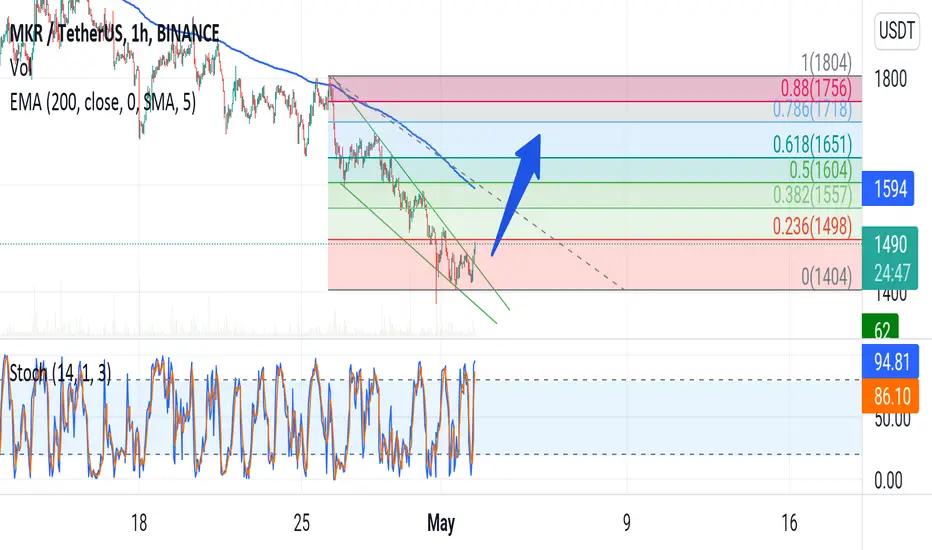
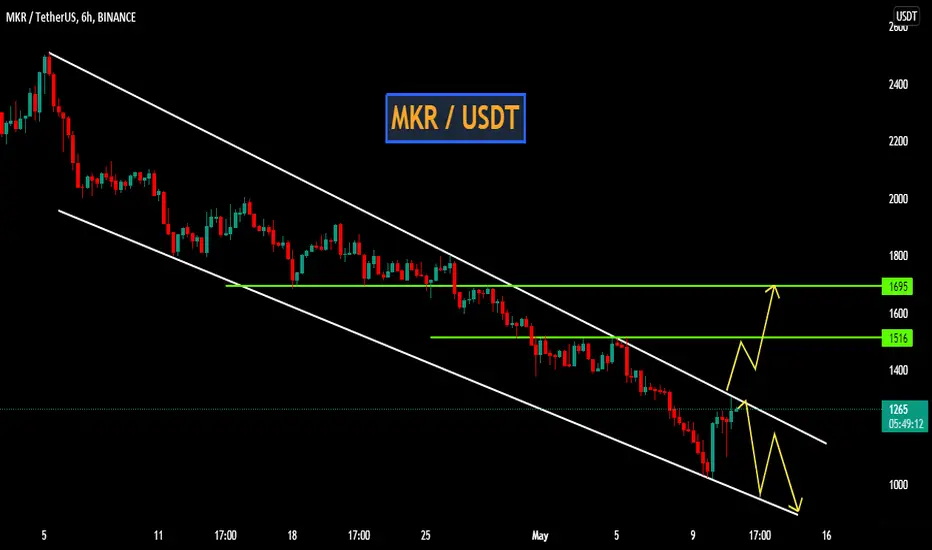
MKRUSDTIt is in a chanel , it is in bttom of channel , our target is up of that channel
Buy 1590$ - 1610$
TP1 1800$
TP2 2275$
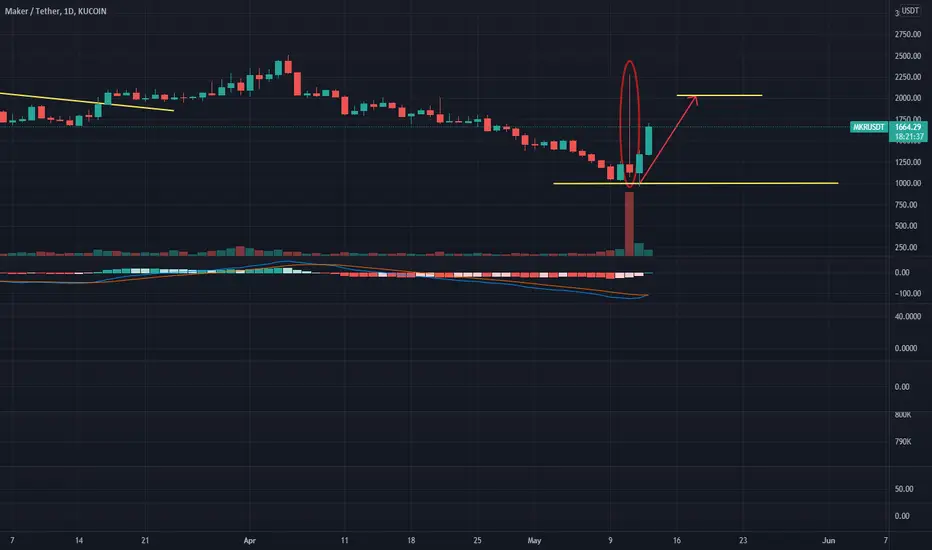
MKR, the fairy guides the way.The following are machine translations:
On the daily line, this big drop stopped at around 1000, and then the yang covered the yin, and then there was a sharp rise and fall, leaving a long upper shadow line. At present, it is going above the long upper shadow line in the past two days, and the fairy is pointing the way. , the operation fell back to do more, the top target near 1900-2000.
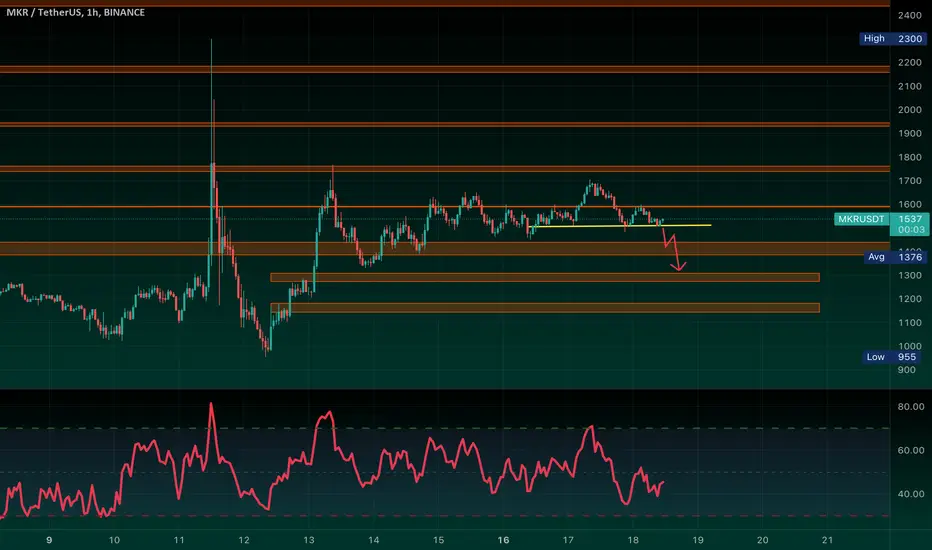
possible scenarioprice at strong resistance level tested 4 times , it might go down in order to retest the 1100 $ level
PS ; never risk more than 2% of your capital per trade

MKRUSDT - SETUPMKRUSDT price trading in a downward parallel channel and now trying again to break that with a strong volume. But the market is still in the indecisive mode so better to wait for the breakout of that channel or let the bear exhaust somewhere.
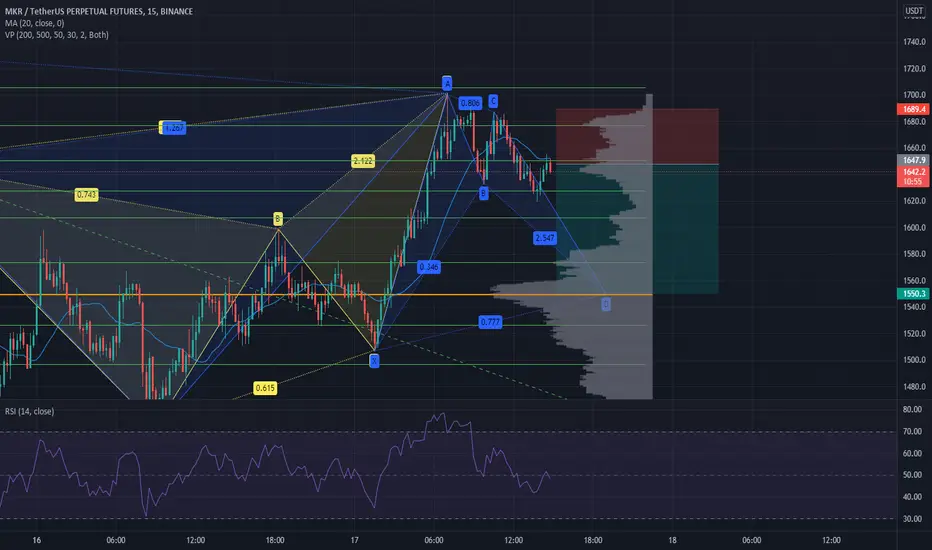
RR=2.45 sell ideabearish shark pattern + price at resistance level + breakout of double top + RSI divergence
PS : never risk more tha 2% of your capital per trade

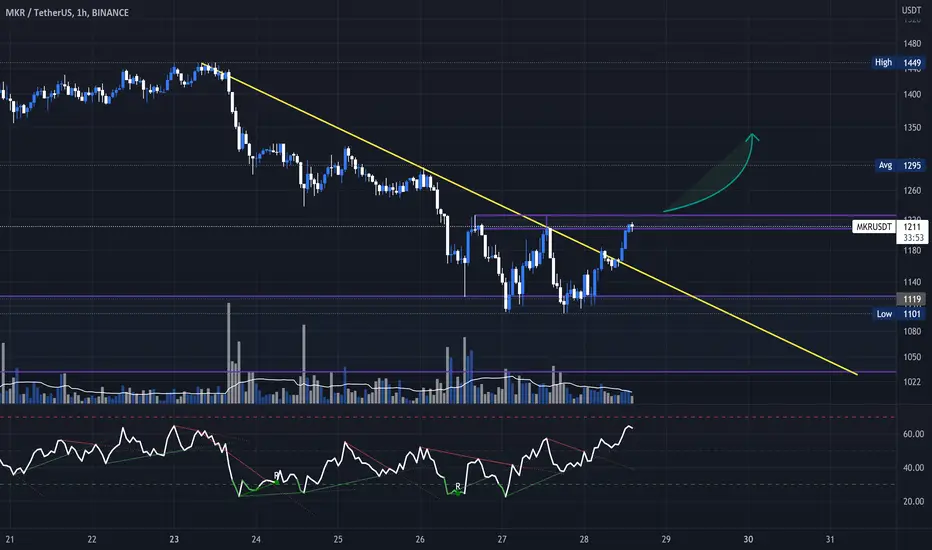
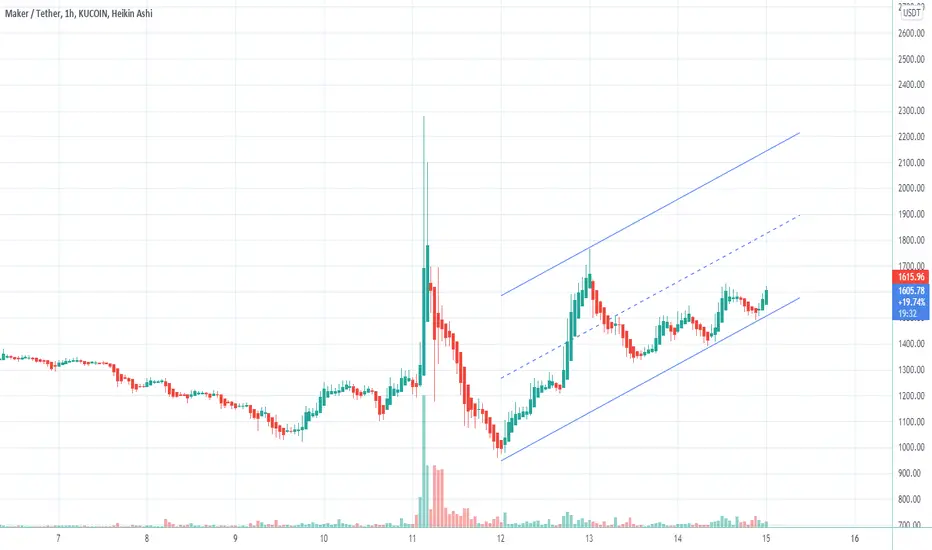
MKR : Return in viewMKR shows on the technical side a return trend, which could make for the low time frame an increasing trend.
- Interesting view to see how this could play out coming time.
For further increase, it should hold the 1070 level.

Long MKRAccording to the trend line, I think we will see a price increase soon what is your opinion ?