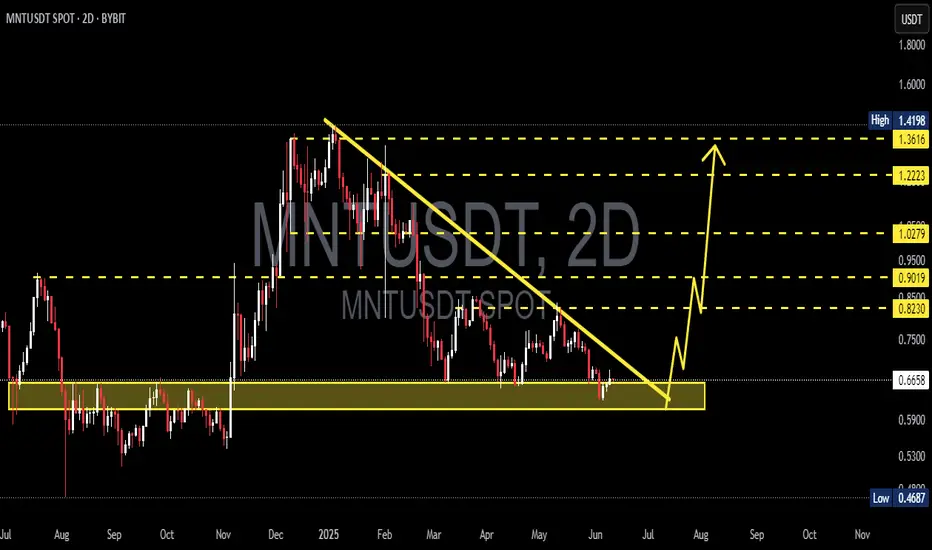
MNT/USDT Testing Strong Demand Zone – Rebound or Breakdown AheadDetailed Analysis of MNT/USDT (2D Timeframe):
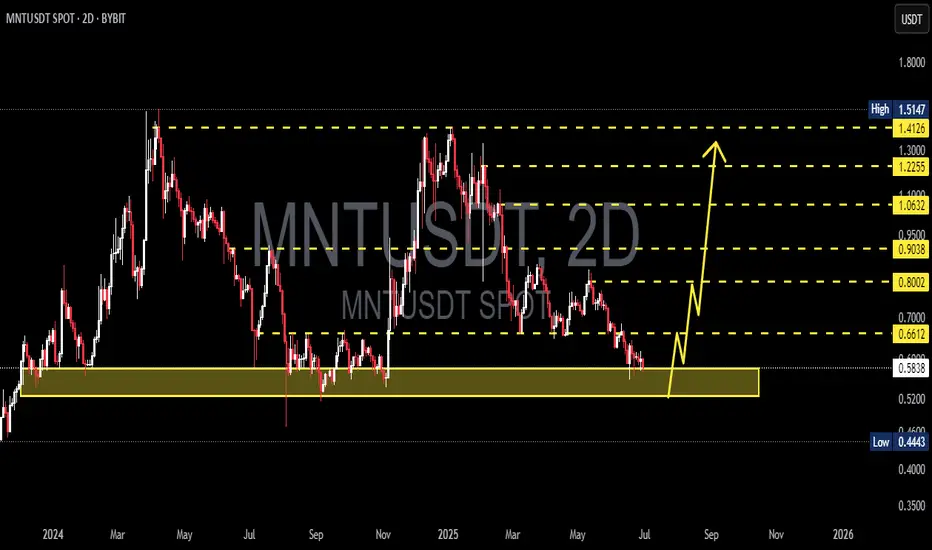
The MNT/USDT pair is currently testing a strong demand zone between $0.44 – $0.58, which has acted as a key accumulation area since 2024. This level has previously triggered strong bullish reversals, making it a crucial point for the next move.
📈 Bulli
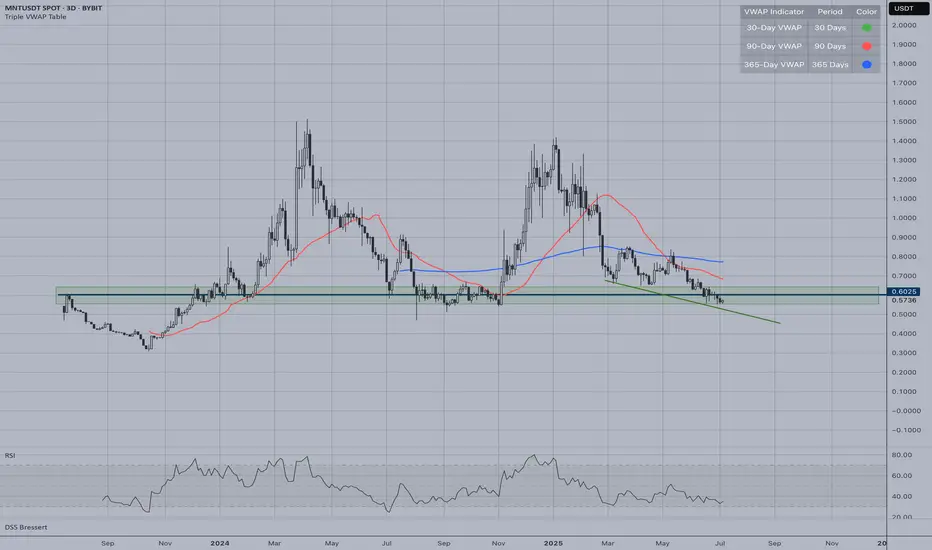
MNT | At SupportMNTUSDT has reached a critical support zone around $0.5742, presenting a potential buying opportunity. The price is testing the green support area that has held multiple times historically, suggesting this level remains significant for buyers.
Key Technical Observations:
Price currently testing m
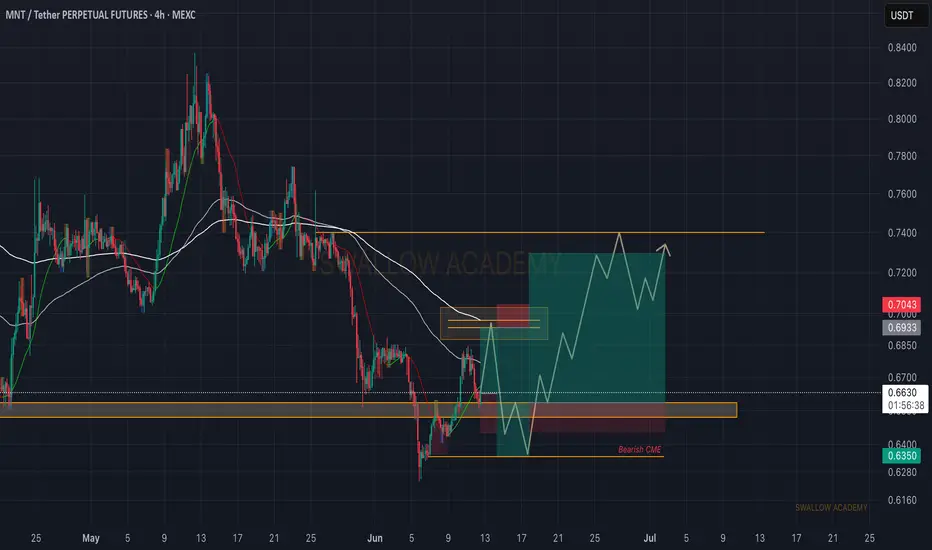
Mantle (MNT): Filled Bullish CME | Eyes on 200EMAMantle coin has recently filled the bullish CME gap, where we might be seeing some sort of weakness.
Now our game gameplan will work only if we see proper rejection from current zones, which would then send the price back to the 200EMA (where we will be looking for a break of that zone). After tha

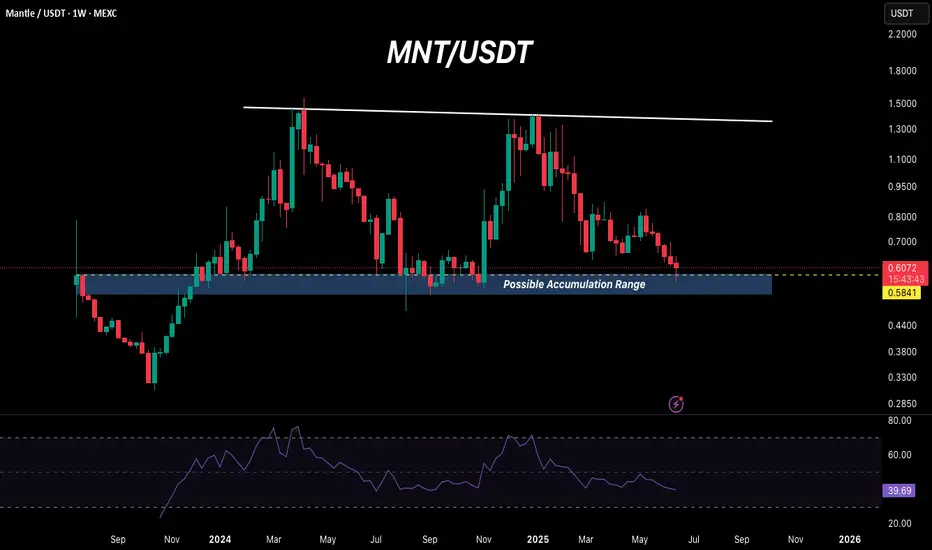
MNT: Close to the Accumulation Range.Hello Traders,
Here’s an update on MNT using the weekly timeframe.
MNT is currently in a downtrend and approaching a potential accumulation range. We’ve seen MNT rebound from this specific range in the past, and if it follows a similar pattern, it could present a good opportunity.
Bullish Scenari
Mantle (MNT): Buyside Volume Gathering!Mantle coin has had a nasty dip recently, whereas as of now we see some kind of buyside volume gathering up.
We are targeting here the 200EMA line, after which we might be seeing some kind of weakness.
There are 3 possible times to take positions so let's wait out for proper confirmations now.
S
MNTUSDT 2D AnalysisMNT ~ 2D Analysis
#MNT Buy back gradually from this support block with a short term target of at least 10%+ from here. Long term target $1.4
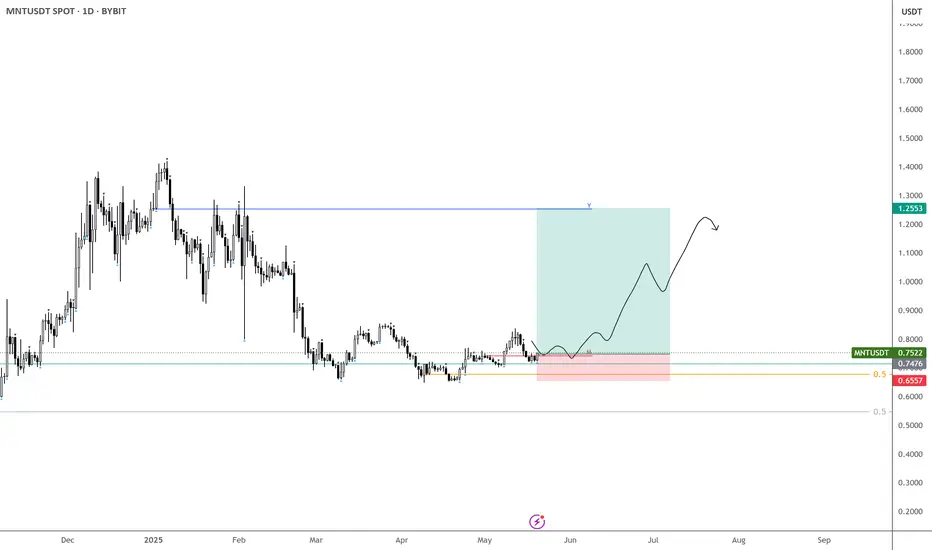
MNT – Accumulating Nicely, Ready to Join the TrendMNT is accumulating beautifully—this looks ready to follow $AAVE.
Stepping in and adding it to the basket of coins I’m comfortable holding.
It’s forming a solid weekly base, and a new trend could trigger as early as next week.
Anticipating the move here, with risk defined below 70c.
Targeting a
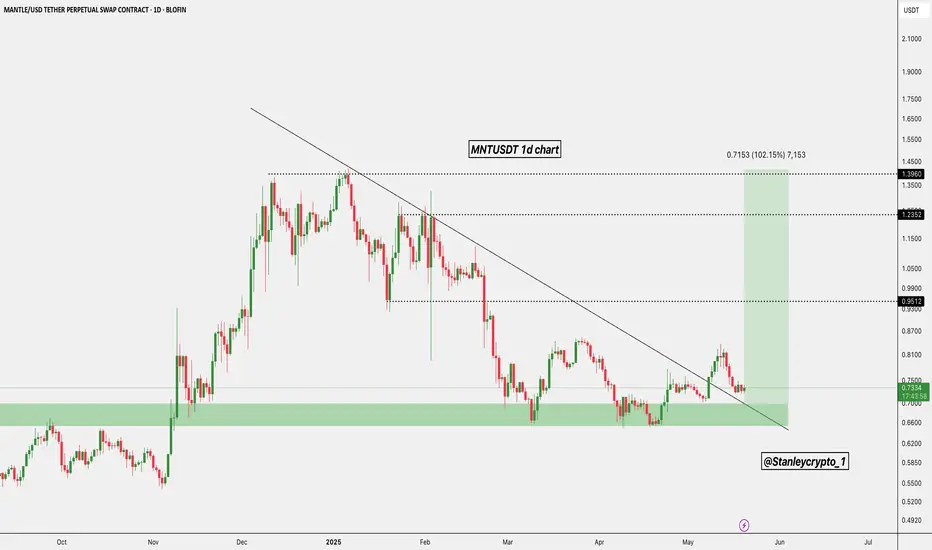
$MNT It's Heating Up Again!After a clean breakout above the macro downtrend, MNT TSX:MNT is now retesting the trendline as support, a textbook bullish retest.
Price is holding the green accumulation zone, and if bulls step in, the path to $0.95 → $1.23 → $1.39 opens up!
That’s a potential 100%+ move from current levels. 💥
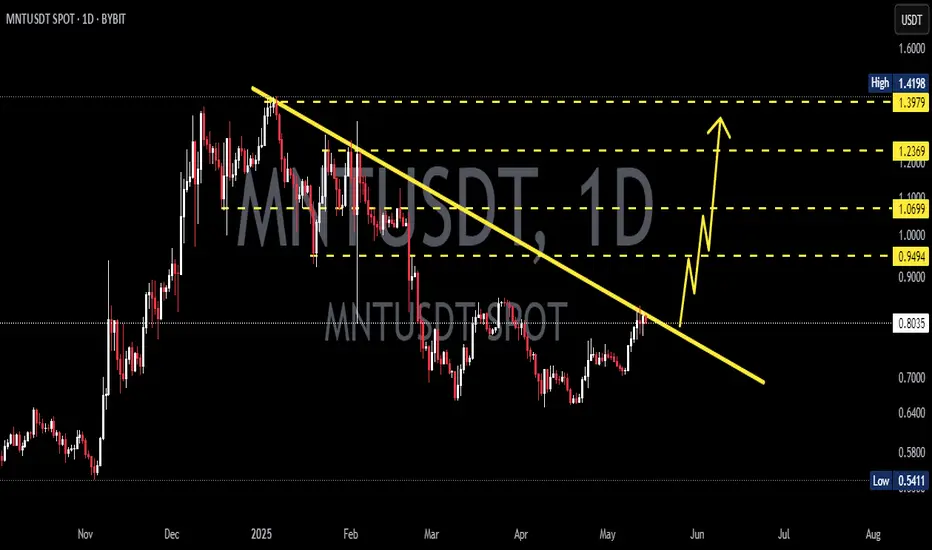
MNTUSDT 1D#MNT has broken above the descending triangle on the daily chart. Currently, it has been rejected by the daily MA100 and is heading towards retesting the descending triangle line and the daily EMA50. In case of a successful bounce, the targets are:
🎯 $0.9434
🎯 $1.0343
🎯 $1.1253
🎯 $1.2548
⚠️ Use a

MNTUSDT 1D Analysis MNT ~ 1D Analysis
#MNT Buy gradually after successfully breaking through this resistance line with a short-term target of at least 10%++
See all ideas
Summarizing what the indicators are suggesting.
Oscillators
Neutral
SellBuy
Strong sellStrong buy
Strong sellSellNeutralBuyStrong buy
Oscillators
Neutral
SellBuy
Strong sellStrong buy
Strong sellSellNeutralBuyStrong buy
Summary
Neutral
SellBuy
Strong sellStrong buy
Strong sellSellNeutralBuyStrong buy
Summary
Neutral
SellBuy
Strong sellStrong buy
Strong sellSellNeutralBuyStrong buy
Summary
Neutral
SellBuy
Strong sellStrong buy
Strong sellSellNeutralBuyStrong buy
Moving Averages
Neutral
SellBuy
Strong sellStrong buy
Strong sellSellNeutralBuyStrong buy
Moving Averages
Neutral
SellBuy
Strong sellStrong buy
Strong sellSellNeutralBuyStrong buy
Displays a symbol's price movements over previous years to identify recurring trends.