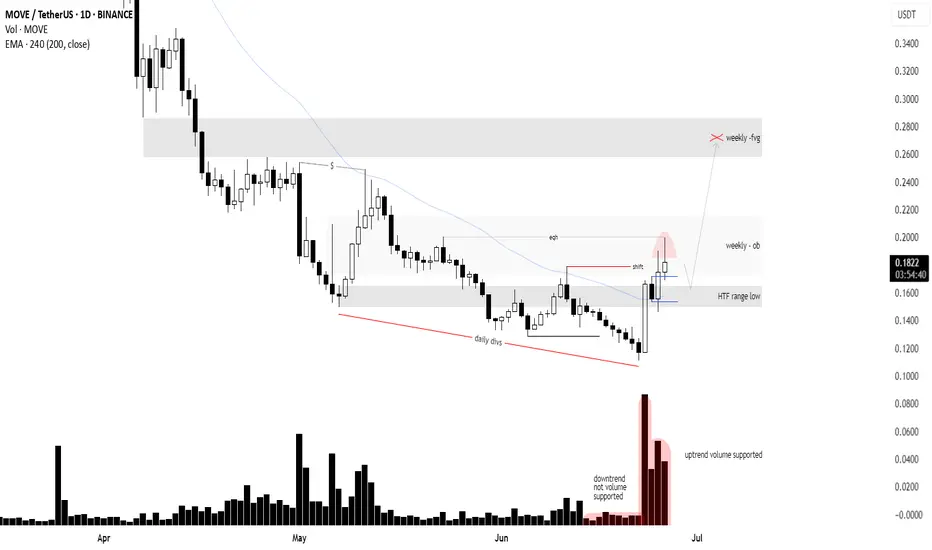
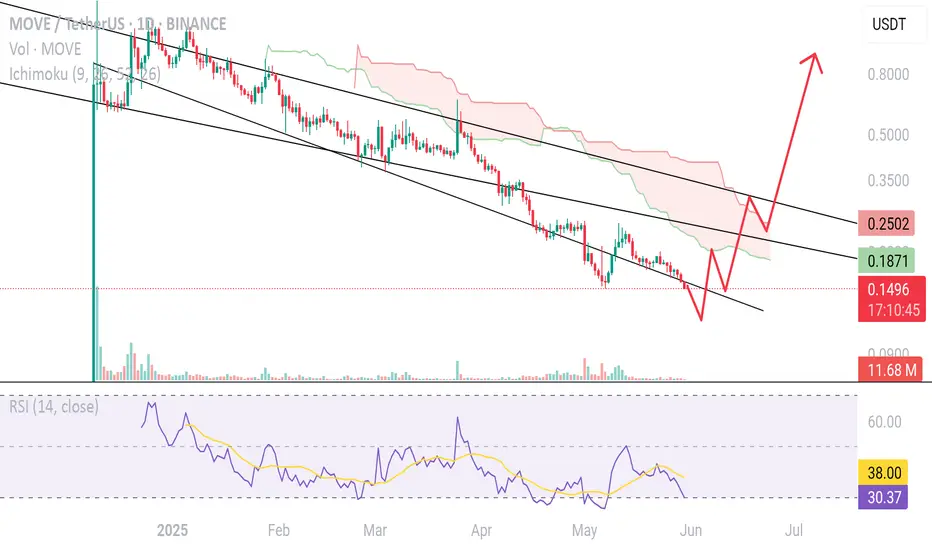
$MOVE | Bottom is likely inA solid case that TVC:MOVE is bottoming out.
1. Bullish shift in structure
2. RSI daily triple divs
3. Break of 200 4h EMA
4. Volume supported breakout
5. Reclaim of previous range
6. Liquidity pool at 0.25-0.29 untapped
On chain is also bullish:
7. DeFi apps gain revenue
8. Stable coins are fl
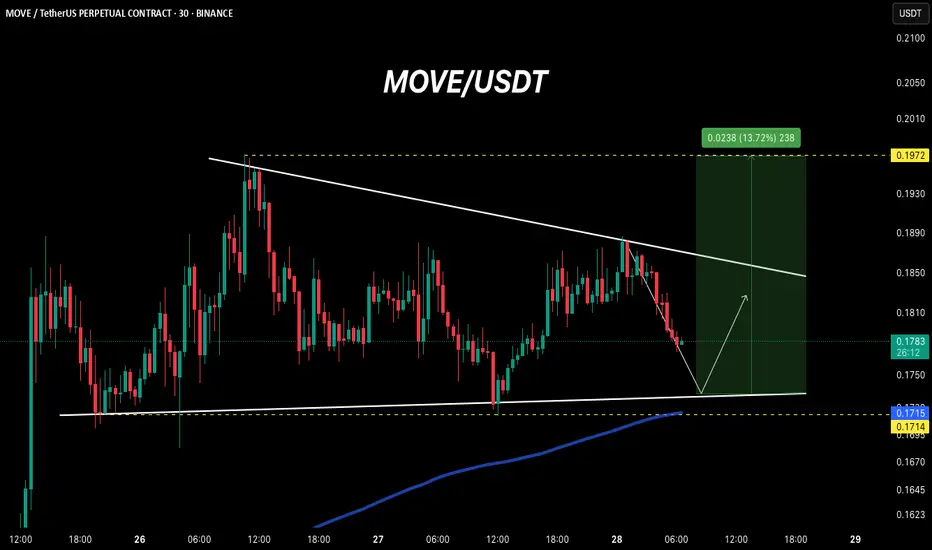
MOVE: Short-term Trade Setup.MOVE is likely to hit the support trendline ranging between $0.17 and $0,175. This will be a good entry point to long MOVE.
~ Entry: $0.17 – $0.175
~ Stop Loss (SL): $0.167
~ Leverage: 5x – 10x
~ Target: 10% – 15%
Note: This is a short-term trade, so please invest at your own risk.
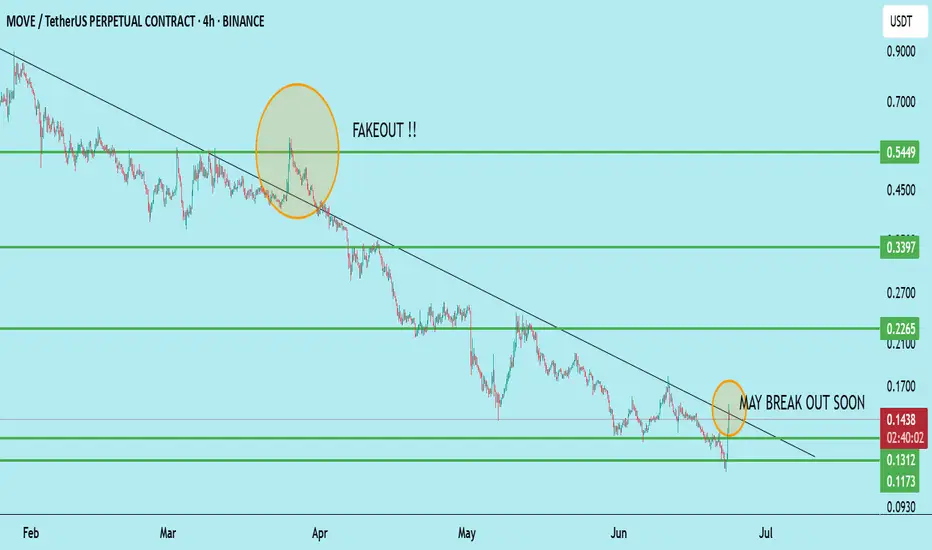
MOVE/USDT – Long-Term Breakout WatchTimeframe: 4H (Long-Term Setup)
MOVE is testing a long-term descending trendline. After months of consistently lower highs, we may be on the verge of a bullish breakout.
The previous breakout attempt in April was a fakeout, but the current consolidation near resistance looks healthier and more sust
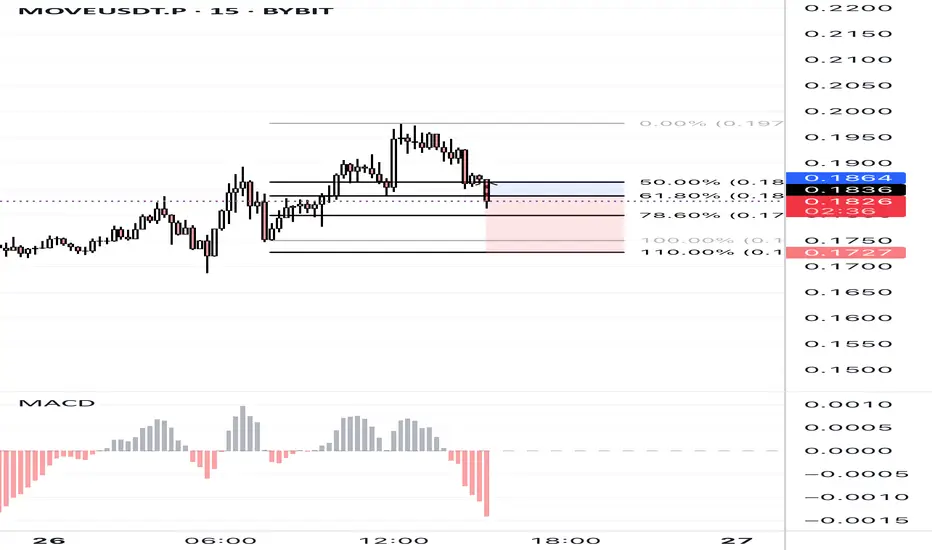
MOVEUSDT.P – Long Setup from 61.8%–78.6% Fibonacci Retracement ZMOVEUSDT.P is currently testing a deep retracement after a strong bullish leg. Price is reacting to the key Fibonacci zone (61.8%–78.6%), which has held as support multiple times.
Waiting for confirmation via MACD momentum shift or bullish engulfing to validate entry. Risk-managed long setup target
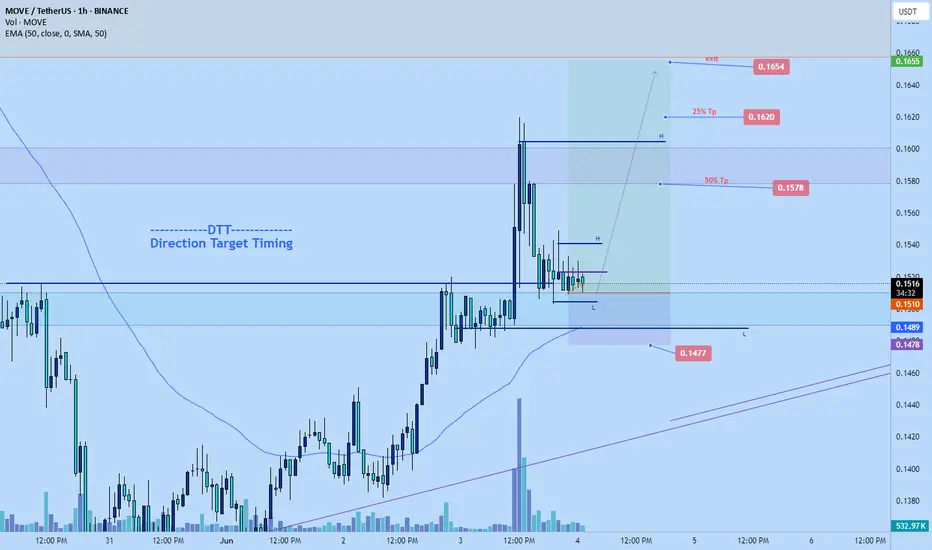
Move long back to $0.1654Just now opened a long position on move.
Targeting 0.1654. Will be scaling out along the way. Might scale in as well.
Market is still respecting bullish structure so I anticipate another pump soon.
move +buy and hold .
move Used by modern blockchains like Aptos and Sui, Move enables developers to build secure, scalable decentralized applications (dApps) with strong protection against common vulnerabilities.
3$ target
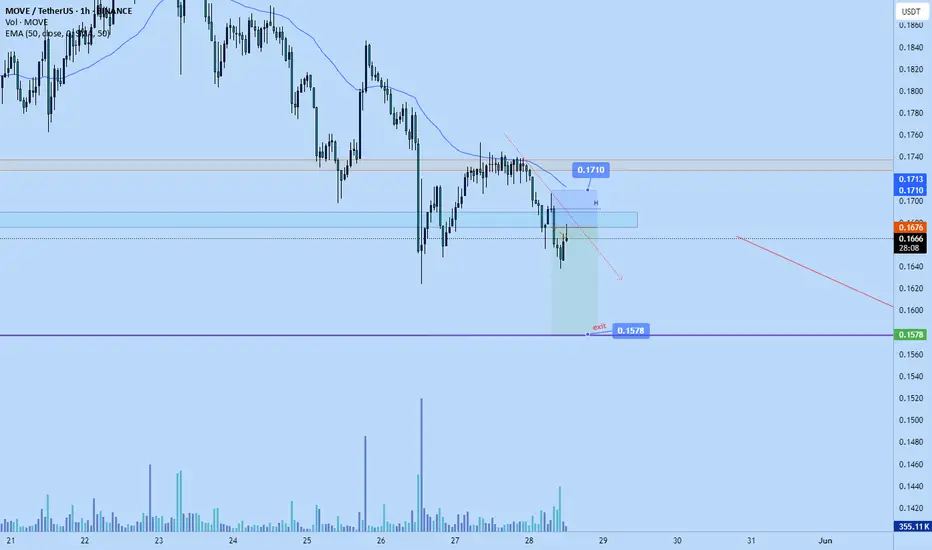
Move short to $0.1578just now opened a short position on move. Aiming for $0.1578
stop: $0.1710 or higher
Expecting the downtrend to continue down to daily support at $0.1578 soon.
MOVE - Movement, will it be so? 📊 MOVE/USDT Technical Analysis 🔍
The chart indicates that the asset is in a consolidation phase after a strong downtrend. Currently, the price is approaching a key resistance level, defined by the descending trendline. Let’s analyze the key points to watch:
🔹 Support and Resistance Levels (Possible

Move short to $0.1575Entered #move short just now
Might get some drawdown, entry is a bit aggressive but the stoploss of $0.1773 might be enough as the supply dump from earlier was quite aggressive so there's a good chance the market will react similar again.
Plus heard they had an airdrop today which might have been

Move scalp long to $0.1877Just now entered a long position on $move. Anticipating a momentum push towards $0.1877 to flip back to a bullish trend on the 4hr tf.
Stop: $0.1744 or lower
Tp: $0.1877

See all ideas
Summarizing what the indicators are suggesting.
Oscillators
Neutral
SellBuy
Strong sellStrong buy
Strong sellSellNeutralBuyStrong buy
Oscillators
Neutral
SellBuy
Strong sellStrong buy
Strong sellSellNeutralBuyStrong buy
Summary
Neutral
SellBuy
Strong sellStrong buy
Strong sellSellNeutralBuyStrong buy
Summary
Neutral
SellBuy
Strong sellStrong buy
Strong sellSellNeutralBuyStrong buy
Summary
Neutral
SellBuy
Strong sellStrong buy
Strong sellSellNeutralBuyStrong buy
Moving Averages
Neutral
SellBuy
Strong sellStrong buy
Strong sellSellNeutralBuyStrong buy
Moving Averages
Neutral
SellBuy
Strong sellStrong buy
Strong sellSellNeutralBuyStrong buy
Displays a symbol's price movements over previous years to identify recurring trends.