MOVRUSDT – Bullish Momentum Building on Daily ChartMOVRUSDT – Bullish Momentum Building on Daily Chart
The daily chart is indicating short-term upward momentum, supported by a bullish crossover of the 50-day and 200-day SMAs on the 4-hour timeframe. RSI is hovering around 74, showing strong buying pressure without being extremely overbought. MACD i
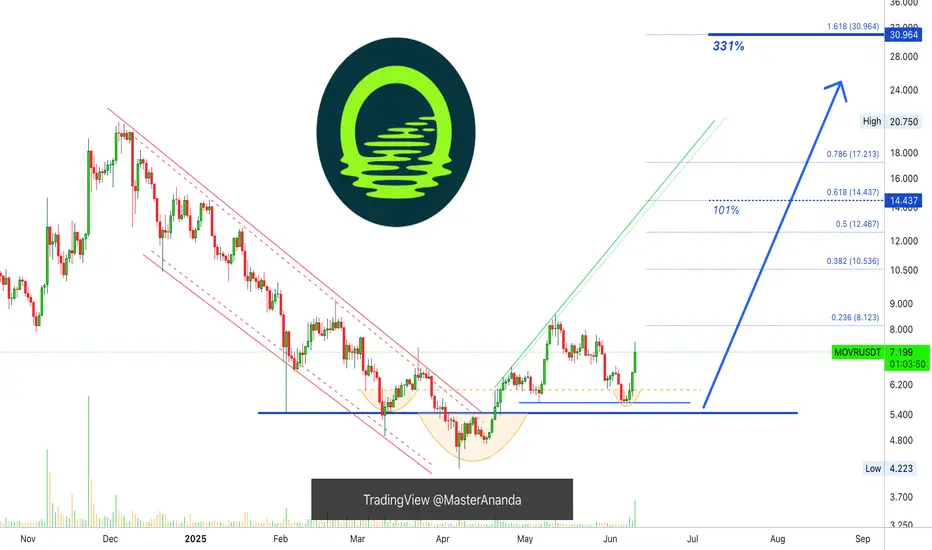
Moonriver 331% Profits Potential Target Mapped (Volume Breakout)Moonriver today produced the highest volume daily since December 2024. The big difference between now and then lies in the fact that in December MOVRUSDT was trading near a peak while today it is coming out of a higher low. Increasing volume in this situation means the start of something positive fo
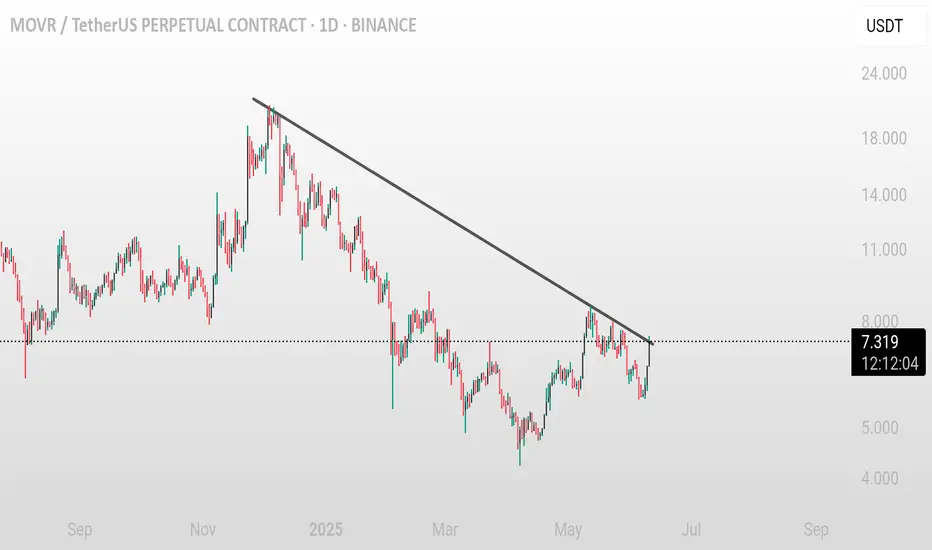
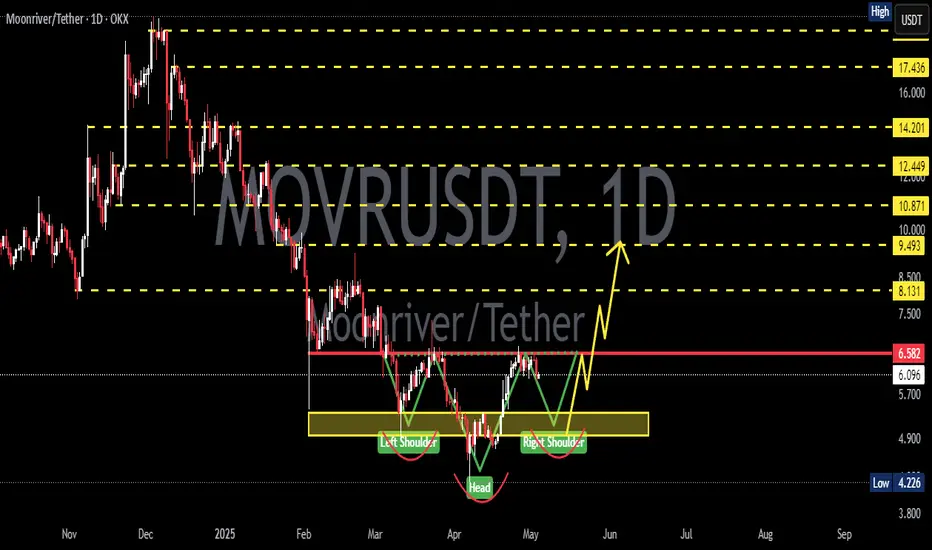
MOVR/USDT (1D) – Trendline Breakout Setup Incoming MOVR/USDT (1D) – Trendline Breakout Setup Incoming
Pattern: Downtrend Breakout 📈
Timeframe: 1-Day ⏱️
Pair: MOVR/USDT 💱
Published: June 10, 2025 📅
Technical Overview:
MOVR/USDT has been trading under a clear downward trendline, forming lower highs over an extended period. The price is now approac
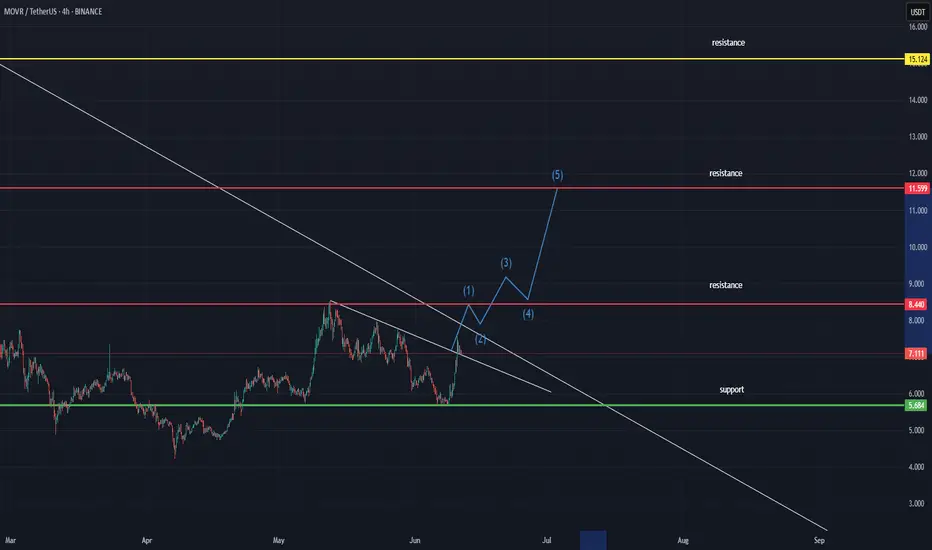
MOVR LONG SETUP ALL trading ideas have entry point + stop loss + take profit + Risk level.
hello Traders, here is the full analysis for this pair, let me know in the comment section below if you have any questions, the entry will be taken only if all rules of the strategies will be satisfied. I suggest you keep thi

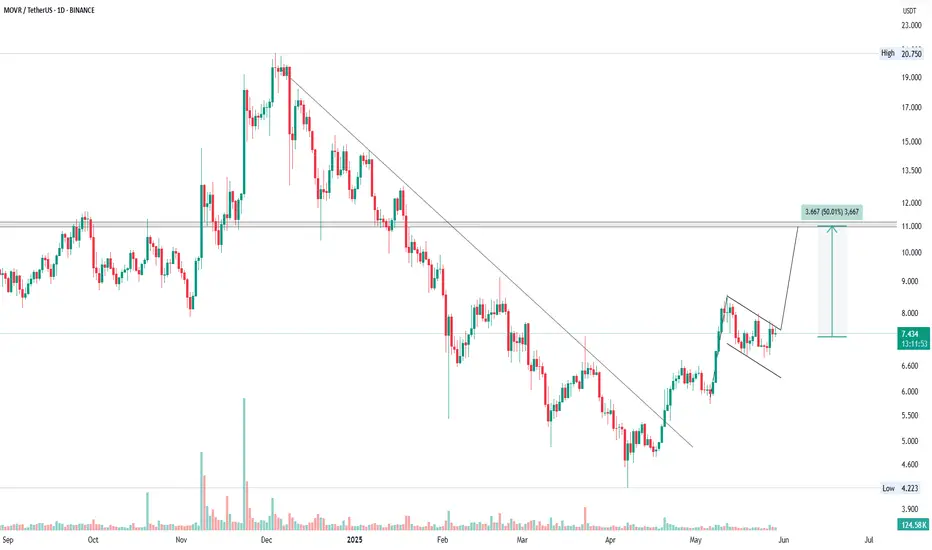
MOVR | Flag PatternFlag pattern is about te break out level, after confirmed break out in daily timeframe, expecting 50% bullish wave
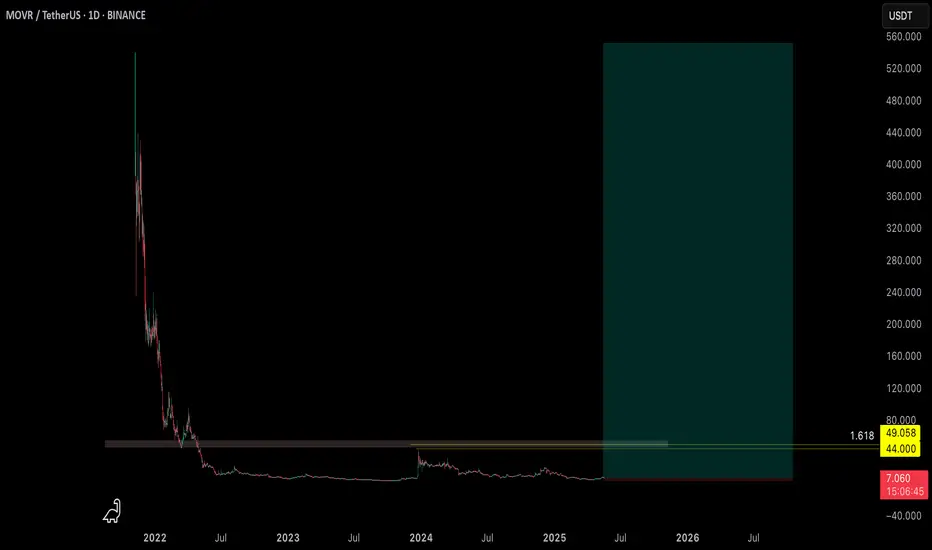
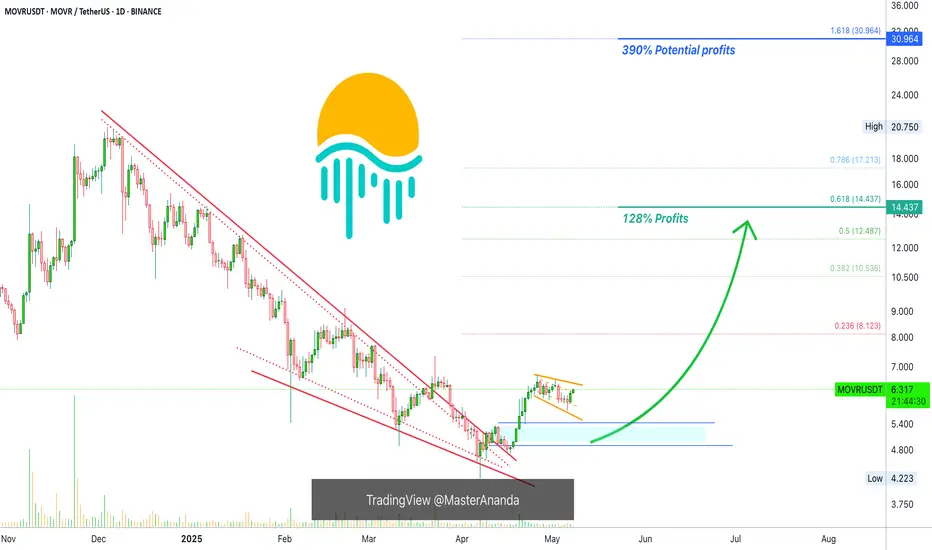
Moonriver Short-Term Boom 128% PP & 390% Mid-Term (You Choose)I am sharing Moonriver as a short-term trade setup but this doesn't invalidate the long-term potential. It will grow strong with the rest of the market but here is a fast target.
A "fast target" based on the fact that we have a bullish flag on the chart. The bull-flag is a continuation signal which
MOVRUSDT 1D AnalysisMOVR ~ 1D Analysis
#MOVR Buy when re -testing this support block with a short -term target of at least 10%+
MOVRUSDT IS READY?1. Bullish Scenario (Breakout to the Upside):
• If the price closes daily above 5.60 or 5.80 with strong momentum, it would confirm a breakout from the descending channel.
• The next potential target could be in the range of 6.20 – 6.50.
2. Bearish Scenario (Rejection from the Upper Channel):
•

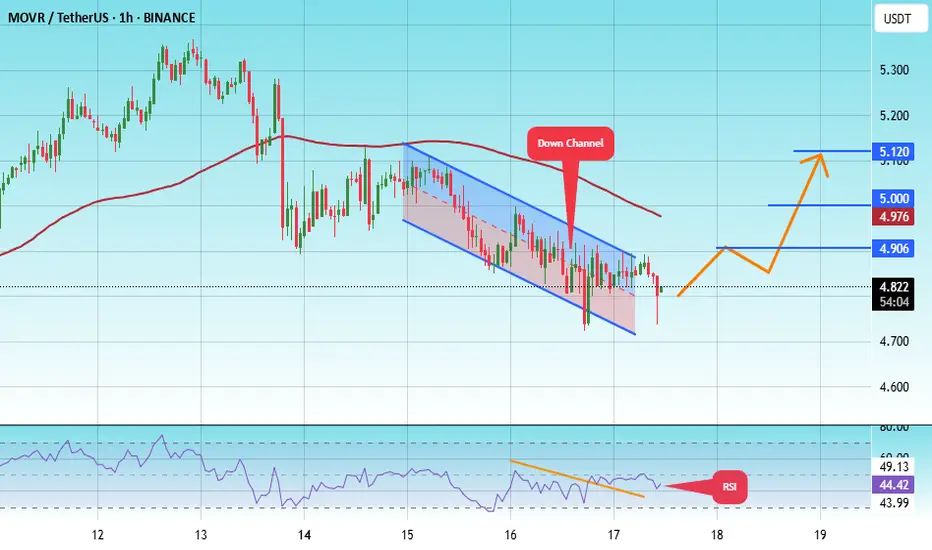
#MOVR/USDT#MOVR
The price is moving within a descending channel on the 1-hour frame, adhering well to it, and is heading for a strong breakout and retest.
We are experiencing a rebound from the lower boundary of the descending channel, which is support at 4.70.
We are experiencing a downtrend on the RSI ind
See all ideas
Summarizing what the indicators are suggesting.
Oscillators
Neutral
SellBuy
Strong sellStrong buy
Strong sellSellNeutralBuyStrong buy
Oscillators
Neutral
SellBuy
Strong sellStrong buy
Strong sellSellNeutralBuyStrong buy
Summary
Neutral
SellBuy
Strong sellStrong buy
Strong sellSellNeutralBuyStrong buy
Summary
Neutral
SellBuy
Strong sellStrong buy
Strong sellSellNeutralBuyStrong buy
Summary
Neutral
SellBuy
Strong sellStrong buy
Strong sellSellNeutralBuyStrong buy
Moving Averages
Neutral
SellBuy
Strong sellStrong buy
Strong sellSellNeutralBuyStrong buy
Moving Averages
Neutral
SellBuy
Strong sellStrong buy
Strong sellSellNeutralBuyStrong buy
Displays a symbol's price movements over previous years to identify recurring trends.