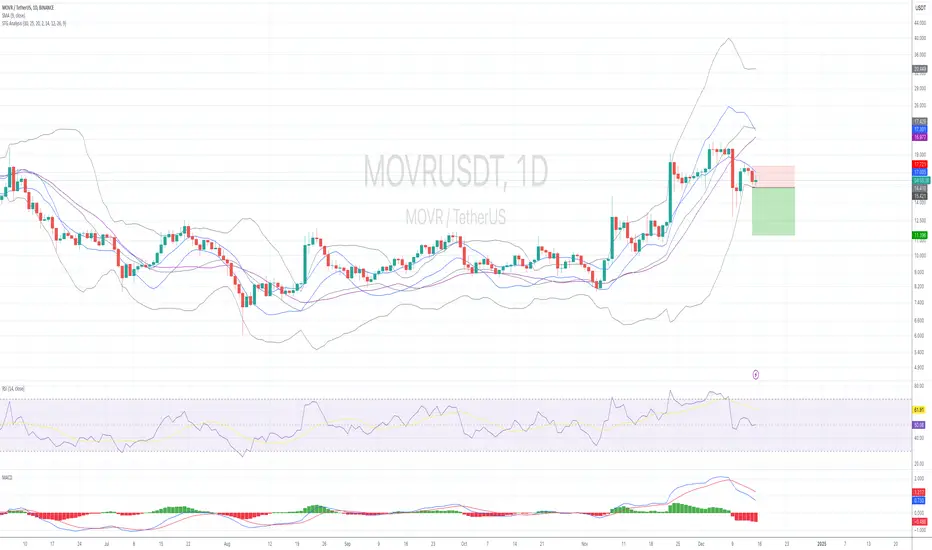
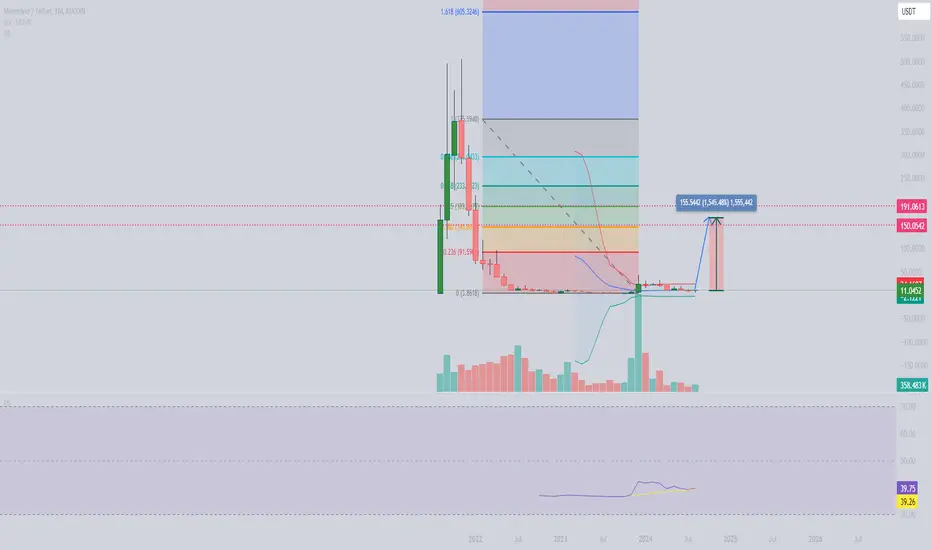
Alikze »» MOVR | Supercycle Bullish Wave 3 or C Scenario - 1D🔍 Technical analysis: Super cycle Bullish Wave 3 or C Scenario - 1D
📣 MEXC:MOVRUSDT currency has encountered demand after a zigzag correction in the 3.61 range, which has had a rapid upward rally
🟢 After that, the price has had a double complex zigzag correction to the origin of the third upward wave.
🟢 Again, in the origin of the third movement, with a three-wave movement, it has encountered demand again in the area of the bottom of the ascending channel.
🟢 Currently, selling pressure is also observed in the ceiling of the ascending channel and the supply area.
💎 If this correction is broken in the form of a zigzag to the minor ceiling, it can be extended to the minor ceiling. It can again encounter demand and an upward rally to the minor ceiling of the previous rally.
💎 Depending on the momentum, this cycle can be a super cycle wave 3 or C to touch the red box area.
⚠️In addition, if the area touches the bottom of the previous wave, the bullish scenario is invalidated and should be re-examined and updated.⚠️
»»»«««»»»«««»»»«««
Please support this idea 💡 with a LIKE 👍 and COMMENT 💬 if you find it useful and Click "Follow" on our profile if you'd like these trade ideas delivered straight to your email 📧 in the future.
🙏Thanks for your continued support.
Best Regards,❤️
Alikze.
»»»«««»»»«««»»»«««
MOVRUSDT trade ideas

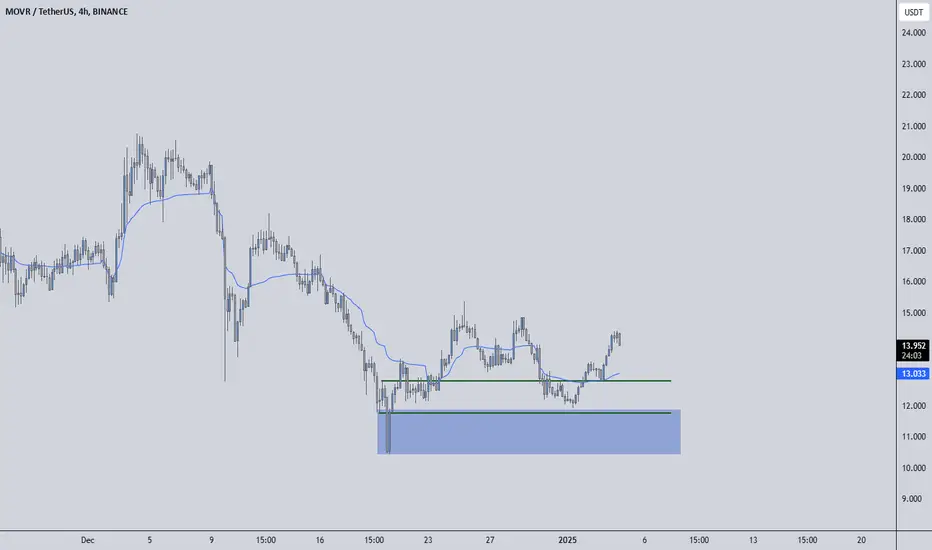
SPOT MOVR LONG 14.01.2025Pinning after containment of sales.
🎯Purpose:
13.482
I'll let you know when I record it manually.
‼️Risk per trade: 1% of the allocated funds for spot trading.
Thank you for follow and the reaction🚀.
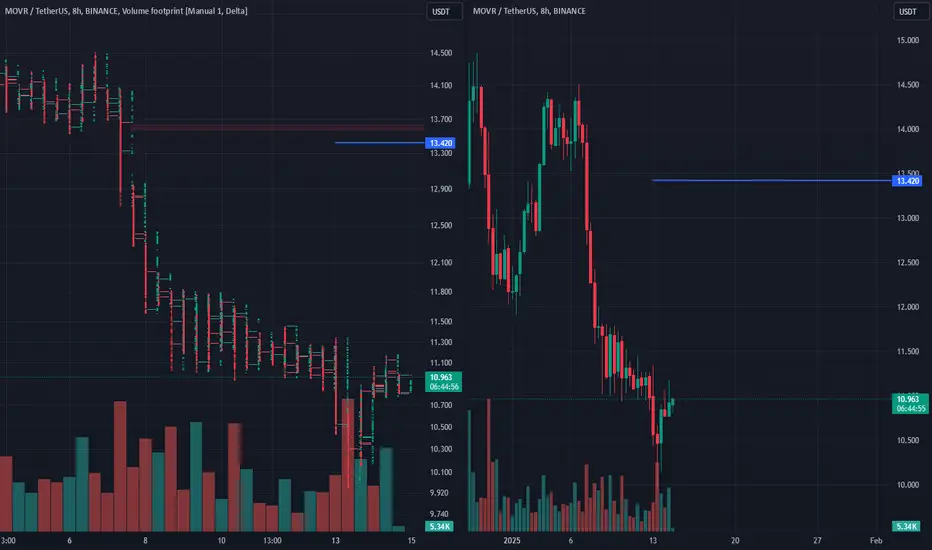
Volume Spike, But Buyers Are Quiet Watching the Green Line!MOVRUSDT: Volume Spike, But Buyers Are Quiet—Watching the Green Line! 🚦📈
Key Points:
Volume Alert: Significant volume spike noted, signaling potential activity.
Buyer Status: No active buyers at the moment, so patience is key.
Entry Condition: Monitoring closely for opportunities as the price approaches the green line.
Why This Matters?
Volume spikes often precede market moves, but confirmation is crucial. I rely on tools like CDV, liquidity heatmaps, volume profiles, and volume footprints to pinpoint high-probability setups. The green line marks a potential inflection point, making it critical to observe market behavior as it gets tested.
Pro Tip: Always combine technical signals with market context—low time frame structure breaks and buyer presence are essential for validation.
Find this analysis useful? Don’t forget to boost, comment, and follow. Together, we’ll dominate the charts!
Let me tell you, folks, this is amazing. Nobody does analysis like I do. Believe me. If this helps you, don't forget to boost and comment! It’s a big deal, motivates me to share even more winning insights with you. Tremendous insights.
I keep my charts the best, clean, simple, and clear. You know it, I know it, clarity leads to better decisions. No question about it. My approach? Built on years of tremendous experience. Incredible track record. I don’t claim to know it all, but I spot high-probability setups like nobody else. Trust me.
Want to learn how to use the heatmap, cumulative volume delta, and volume footprint techniques I use to determine demand regions with stunning accuracy? Send me a private message—totally free, folks. That’s right. I help anyone who wants it, absolutely no charge. Unbelievable value.
Here’s the list, long list, great list, of some of my previous incredible analyses. Each one, a winner:
🎯 ZENUSDT.P: Patience & Profitability | %230 Reaction from the Sniper Entry
🐶 DOGEUSDT.P: Next Move
🎨 RENDERUSDT.P: Opportunity of the Month
💎 ETHUSDT.P: Where to Retrace
🟢 BNBUSDT.P: Potential Surge
📊 BTC Dominance: Reaction Zone
🌊 WAVESUSDT.P: Demand Zone Potential
🟣 UNIUSDT.P: Long-Term Trade
🔵 XRPUSDT.P: Entry Zones
🔗 LINKUSDT.P: Follow The River
📈 BTCUSDT.P: Two Key Demand Zones
🟩 POLUSDT: Bullish Momentum
🌟 PENDLEUSDT.P: Where Opportunity Meets Precision
🔥 BTCUSDT.P: Liquidation of Highly Leveraged Longs
🌊 SOLUSDT.P: SOL's Dip - Your Opportunity
🐸 1000PEPEUSDT.P: Prime Bounce Zone Unlocked
🚀 ETHUSDT.P: Set to Explode - Don't Miss This Game Changer
🤖 IQUSDT: Smart Plan
⚡️ PONDUSDT: A Trade Not Taken Is Better Than a Losing One
💼 STMXUSDT: 2 Buying Areas
🐢 TURBOUSDT: Buy Zones and Buyer Presence
🌍 ICPUSDT.P: Massive Upside Potential | Check the Trade Update For Seeing Results
🟠 IDEXUSDT: Spot Buy Area | %26 Profit if You Trade with MSB
📌 USUALUSDT: Buyers Are Active + %70 Profit in Total
🌟 FORTHUSDT: Sniper Entry +%26 Reaction
🐳 QKCUSDT: Sniper Entry +%57 Reaction
📊 BTC.D: Retest of Key Area Highly Likely
And that’s just the start. The list goes on and on, folks. It’s a tremendous list, the best. I stopped adding because, frankly, it’s tiring. So many wins. People are amazed. You can check my profile and see for yourself, winning moves, all the time. Believe me, nobody does it better.
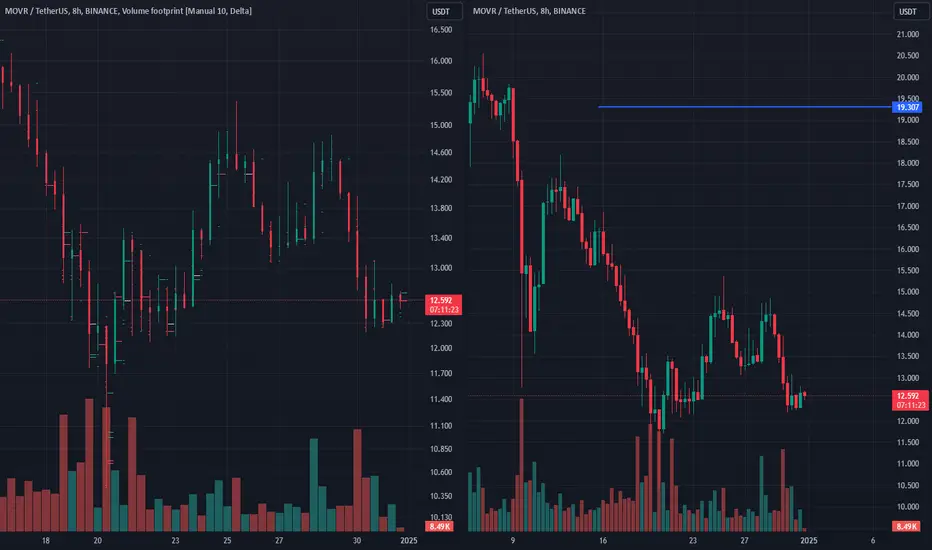
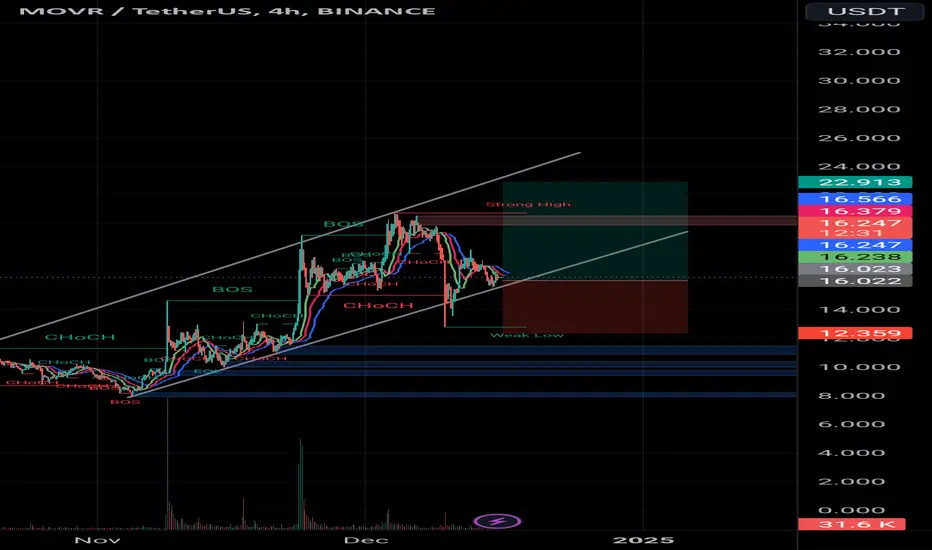
SPOT MOVR LONG 31.12.2024Pinning after containment of sales.
🎯Purpose:
19.307
‼️Risk per trade: 0.5-1% of the allocated funds for spot trading.
Thank you for follow and the reaction🚀.
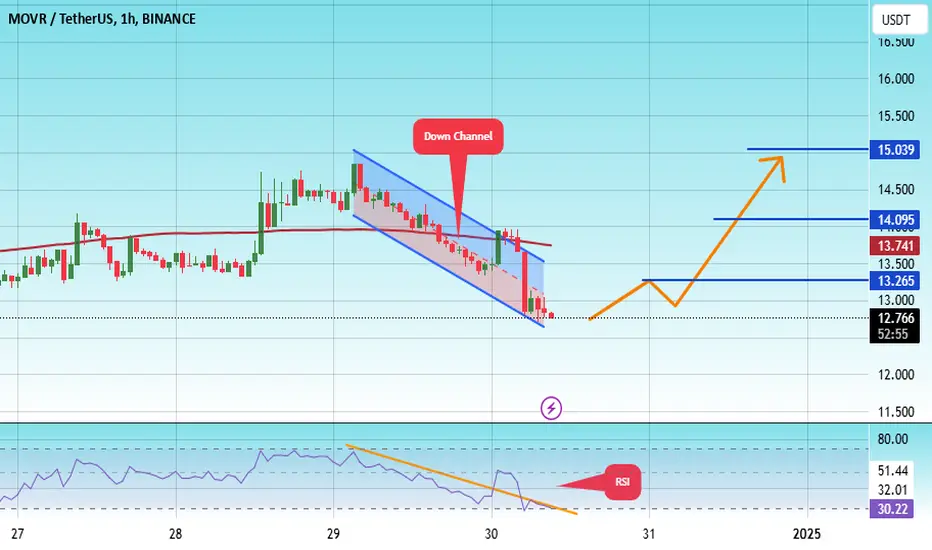
#MOVR/USDT Ready to go higher#MOVR
The price is moving in a descending channel on the 1-hour frame and sticking to it well
We have a bounce from the lower limit of the descending channel, this support is at 12.60
We have a downtrend on the RSI indicator that is about to be broken, which supports the rise
We have a trend to stabilize above the moving average 100
Entry price 12.83
First target 13.26
Second target 14009
Third target 15.03
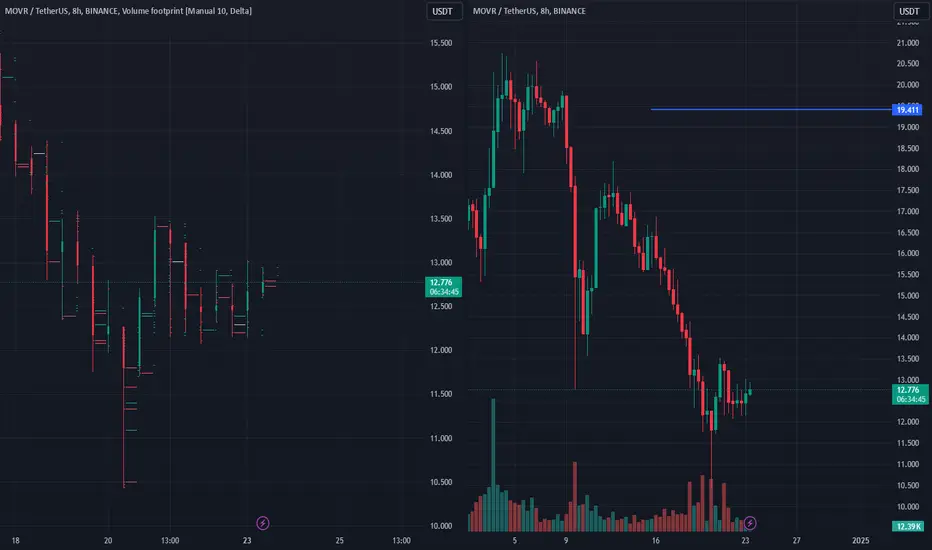
SPOT MOVR LONG 23.12.2024Fixation after containment of sales.
🎯Purpose:
19.411
‼️Risk per trade: 0.5% of the allocated funds for spot trading.
Thank you for subscribing and responding🚀.
MOVR/USDT Technical Analysis: Potential Bearish Continuation
Based on the analysis of this chart, the most likely trend appears to be bearish in the short-to-medium term. The chart displays several indicators that point to a weakening of upward momentum and the potential for further downside.
Bearish Evidence:
Failed Breakout and Lower High:
The price attempted to break above $20 but failed to sustain the move, forming a lower high. This is a classic bearish signal indicating reduced buying pressure.
MACD Momentum Weakening:
The MACD is in a bearish crossover, with the signal line below the MACD line, and the histogram is trending negative. This suggests growing selling momentum.
RSI Deterioration:
The RSI has dropped below 50, indicating weakening bullish momentum and a shift toward bearish sentiment.
Bollinger Bands Contraction:
The Bollinger Bands are narrowing, signaling a period of lower volatility. The price is hovering around the middle band, leaning toward a downside breakout.
Trendline and Support Breakdown Risk:
The price is trading below the key support zone near $17.30, which was previously acting as a base. A close below this level could accelerate bearish momentum.
Key Levels to Watch:
Immediate Resistance:
$17.30: This former support now acts as immediate resistance. A failure to reclaim this level will keep the bearish trend intact.
Immediate Support:
$16.00: A psychological support level and a key area of recent consolidation.
$14.50: The next critical support level, aligning with previous price congestion zones.
Major Support:
$12.00: A significant area where buyers previously stepped in.
Trading Strategy:
Bearish Scenario:
Short Entry: Below $16.90 after a confirmed close below this level.
Take Profit:
First Target: $16.00
Second Target: $14.50
Final Target: $12.00
Stop Loss: Above $17.50 to minimize risk if the price reclaims resistance.
Risk Management Considerations:
Given the narrowing Bollinger Bands, a sudden spike in volatility is possible. Traders should use tight stop losses.
Monitor volume; a significant increase on a breakdown below support levels will confirm bearish momentum.
Conclusion:
The current price action suggests that MOVR/USDT is leaning bearish, with key indicators signaling further downside. A close below $16.90 will likely open the door to retesting lower support levels. However, a reclaim of $17.30 could negate the bearish outlook and shift the market back toward neutrality.
Moon river ( MOVR)Movr usdt Daily analysis
Time frame 4hours
Risk rewards ratio >1.8 👈👌
Moon river is good asset for short time trading
What is MOVR ?
As a decentralized smart contract platform, Moonriver requires a utility token to function.
The moonriver token uses include :
Supporting the gas metering of smart contract execution
Incentivizing collators and powering the mechanics around the creation of a decentralized node infrastructure on which the platform can run ...
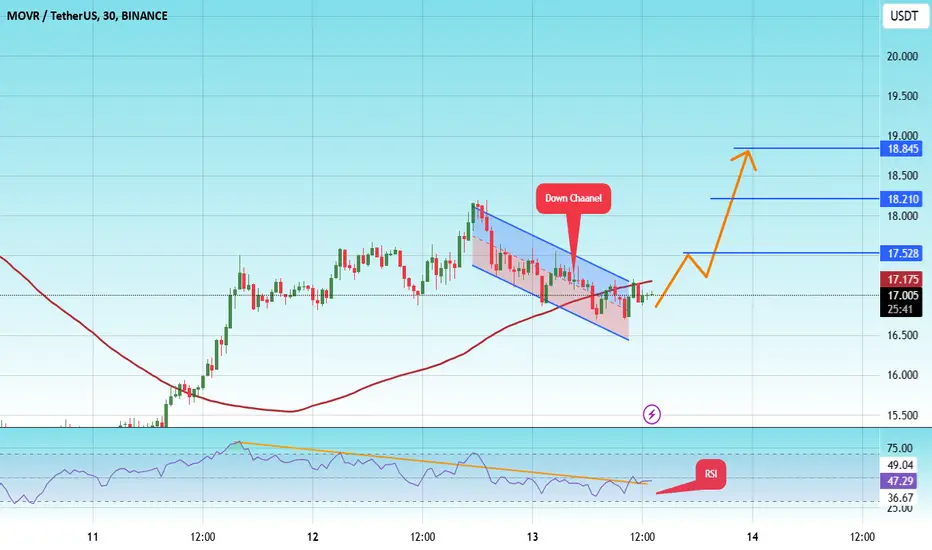
#MOVR/USDT#MOVR
The price is moving in a descending channel on a 30-minute frame and is expected to continue upwards
We have a trend to stabilize above the moving average 100 again
We have a descending trend on the RSI indicator that supports the rise by breaking it upwards
We have a support area at the lower limit of the channel at a price of
16.90
Entry price 17.02
First target 17.52
Second target 18.20
Third target 18.80
movr usdt"🌟 Welcome to Golden Candle! 🌟
We're a team of 📈 passionate traders 📉 who love sharing our 🔍 technical analysis insights 🔎 with the TradingView community. 🌎
Our goal is to provide 💡 valuable perspectives 💡 on market trends and patterns, but 🚫 please note that our analyses are not intended as buy or sell recommendations. 🚫
Instead, they reflect our own 💭 personal attitudes and thoughts. 💭
Follow along and 📚 learn 📚 from our analyses! 📊💡"
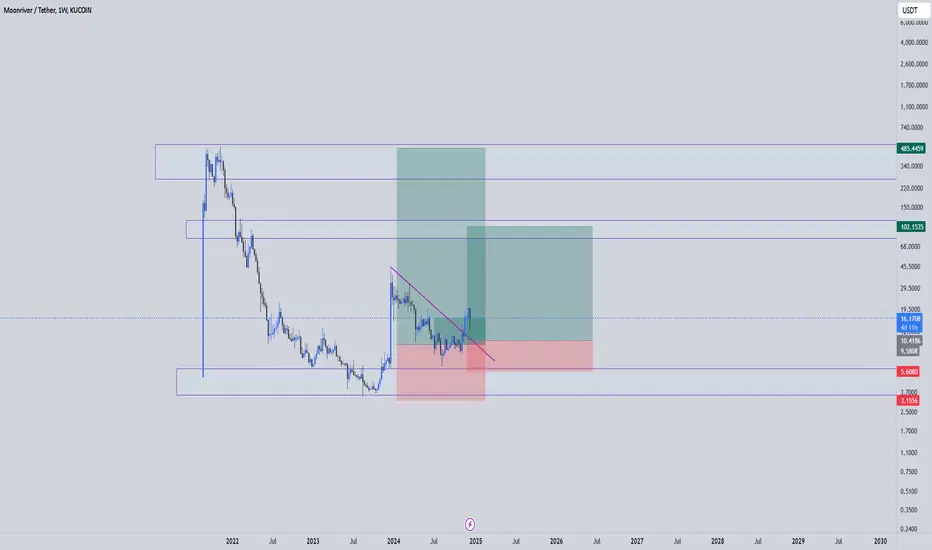
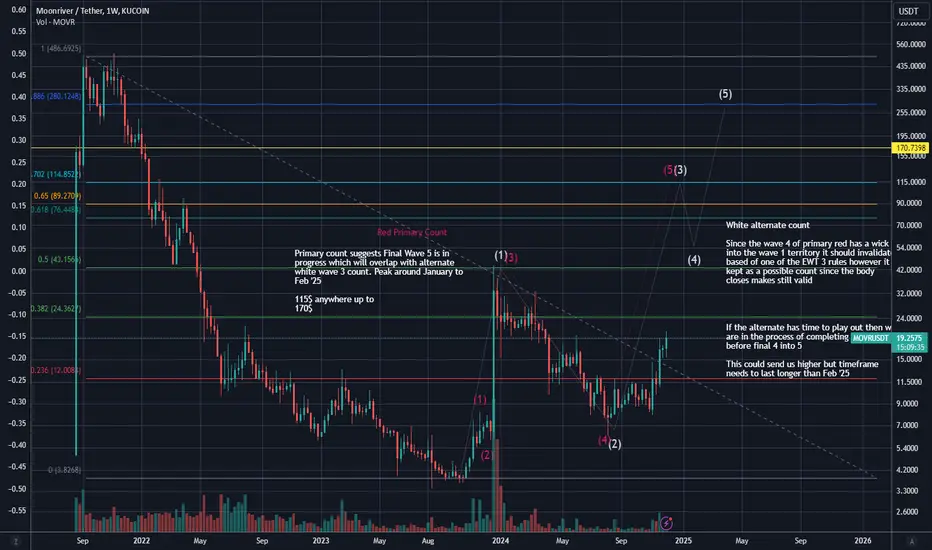
MOVR fresh simple idea ATH Q1 2025Using a new chart to simply see where MOVR could go this cycle.
Base Idea is that recession will ensue post Trump inauguration and that will send all markets into turmoil.
Timeframe Feb 2025
With this in mind I don't see a NEW ATH for MOVR but a new cycle high for sure.
Idea's posted on chart using simple EWT with primary and alternate ideas. Red being my conservative take and I've positioned accordingly
Peak targets from $115-$170 with the alternate idea reaching upwards of $200
MOVRUSDT going to USD 40-44The target is quite obvious. I expect it will be reached short term without BTC surprises.
DYOR and NFA.
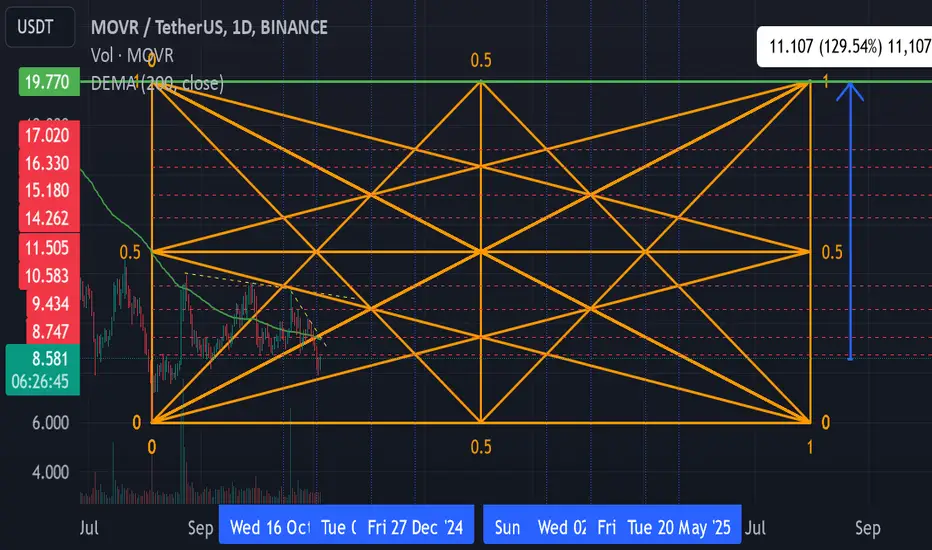
$Movr Prediction Monthly chartWhen we are constrained by shorter time frames, we are unable to perceive the broader perspective. Here is a more comprehensive view for a better understanding. Currently priced at $11.03 per coin, I anticipate a long-term appreciation of at least 10x-15x. This is a monthly chart, so it will be a gradual process and will not occur instantaneously. I will provide updates on this chart as we progress and offer detailed technical analysis of our position.
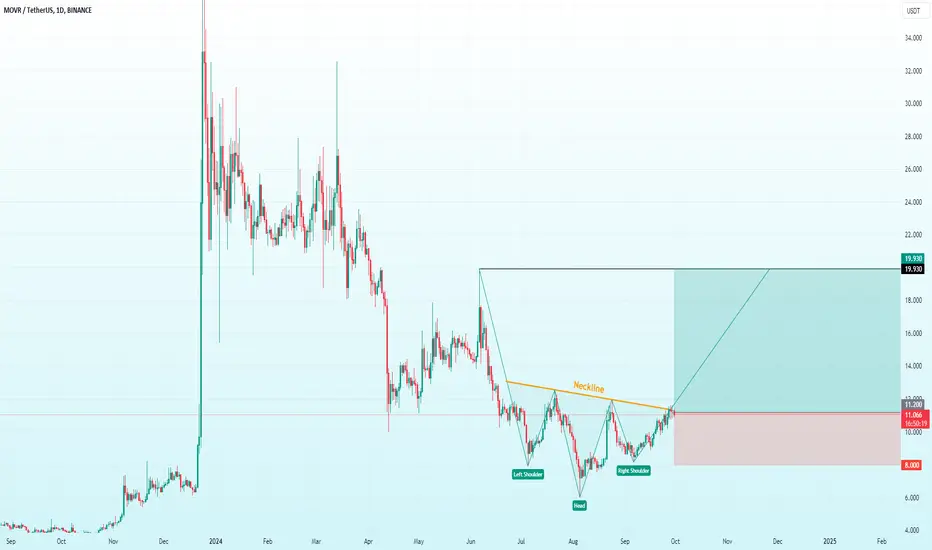
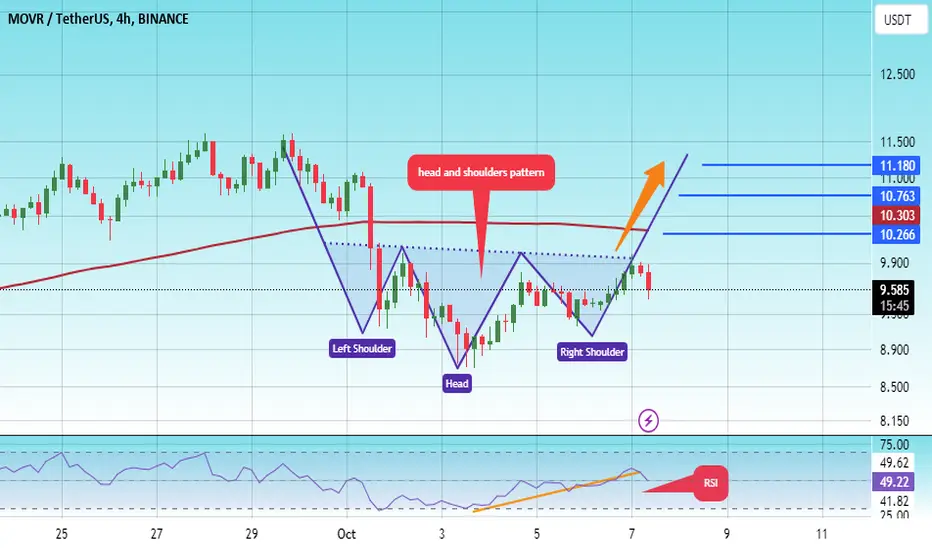
MOVRUSDT | Inverse Head & Shoulder PatternThe chart depicts the price movement of MOVR/USDT on a daily timeframe from Binance. A "Inverse Head and Shoulder" pattern is identified, with the left shoulder, head, and right shoulder clearly marked. The neckline is downward-sloping, and the price appears to be testing it. If the price breaks above the neckline, it could confirm a bullish reversal, with a potential price target of around 19.93 USDT, as indicated by the green area.
However, if the price is rejected at the neckline, a downside move toward the support at 8.00 USDT is possible. This could invalidate the pattern and lead to further bearish price action. Volume trends seem relatively low, which may influence the likelihood of a strong breakout or breakdown. The next few days' price action around the neckline will be critical in determining the pattern's outcome.
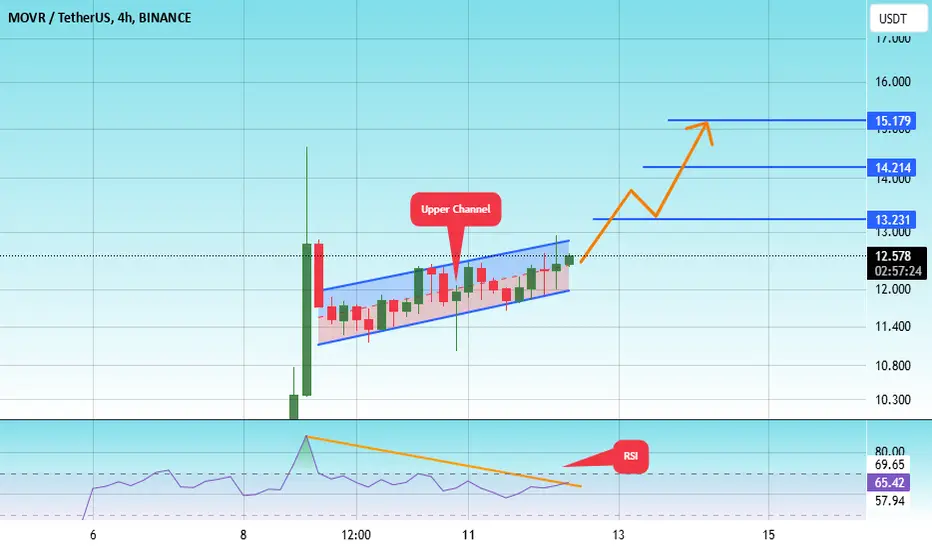
#MOVER/USDT Ready to go up#MOVER
The price is moving in an ascending channel on the 4-hour frame and sticking to it well
We have a bounce from the lower limit of the descending channel, this support is at 11.93
We have a downtrend, the RSI indicator is about to break, which supports the rise
We have a trend to stabilize above the moving average 100
Entry price 12.56
First target 13.20
Second target 14.21
Third target 15.17
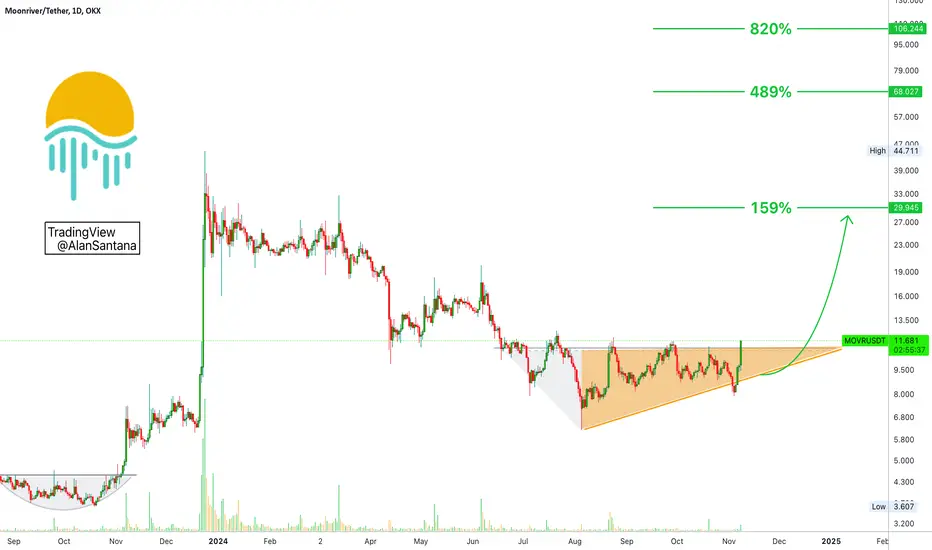
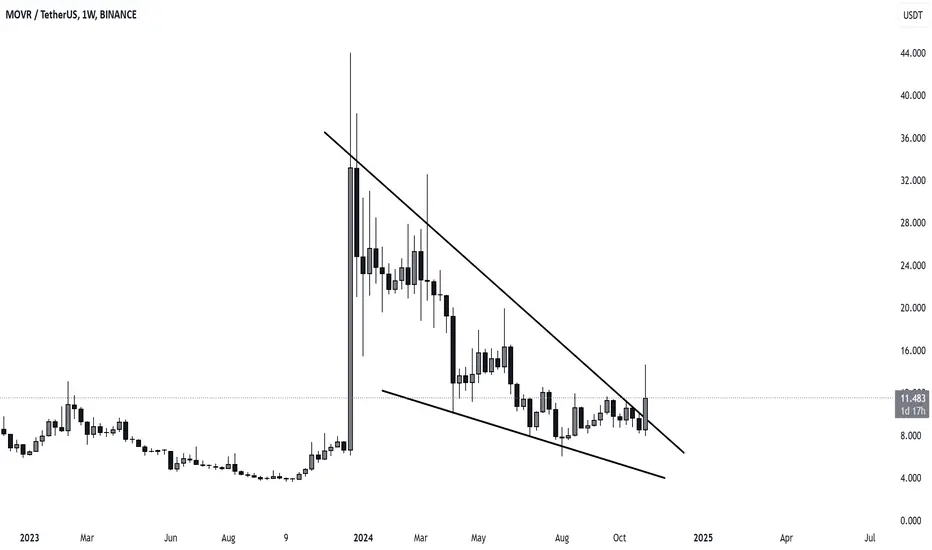
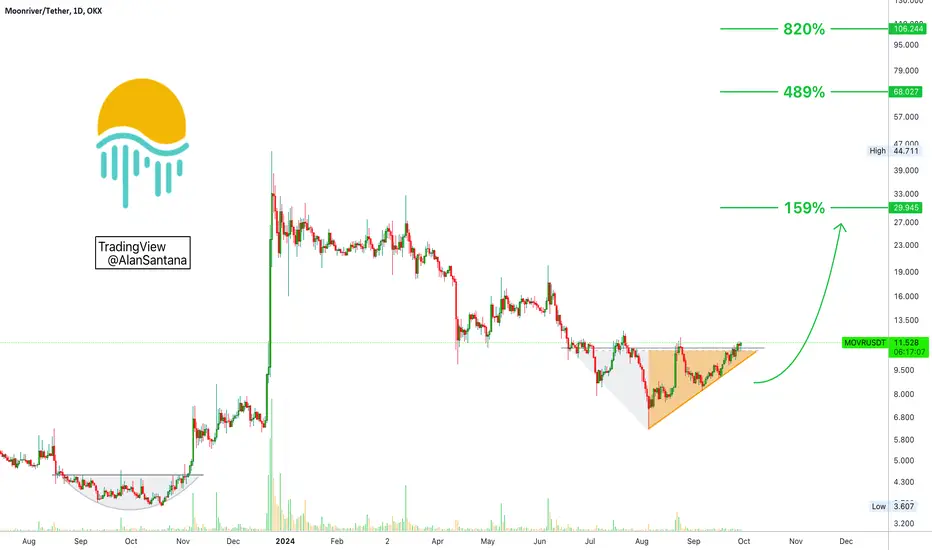
Moonriver Reversal Pattern Updated (159%, 489% & 820% Pot.)Back in late 2023 Moonriver (MOVRUSDT) produced a rounded bottom before a major bullish wave. Now, in 2024, we are seeing triangular bottom, which ends in an ascending triangle before bullish growth. We also have almost 5 months of consolidation below resistance.
The reversal pattern on its own is good but the fact that the action is moving today above the triangle's neckline (or baseline) is the most interesting part. If the pattern is not complete, anything goes; but once in the bullish zone, the probabilities favor a continuation.
In this MOVRUSDT chart we have a long-term higher low and after 9 months of bearish action, a major correction, I wouldn't be surprised to see growth.
Chart like this one are quite mixed. We can see bullish next day or next week but the breakout can happen within months; patience is key.
You can find the targets on the chart. These are short- to mid-term. Long-term it can go higher and higher and higher... And higher.
Thank you for reading.
Your support is appreciated.
Namaste.
#MOVR (SPOT- INVESTING ) IN ( 8.200- 10.500)T.(64.000) SL(7.890)BINANCE:MOVRUSDT
entry range ( 8.200- 10.500)
Target1 (15.500) - Target2 (19.900)- Target3 (29.900)- Target4 (50.000)- Target5 (64.000)
3 Extra and Very Huge Targets(optional) in chart, if you like to continue in the trade with making stoploss very high.
SL .1D close below (7.890)
This trade notes..
_______________
* Keep your order in the entry range and wait for the order to be filled.
* All targets may take time to be achieved.
* This trade is for investors and big time frames traders.
______________________________________________________________
Golden Advices.
**********************
* collect the coin slowly in the entry range.
* Please calculate your losses before the entry.
* Do not enter any trade you find it not suitable for you.
* No FOMO - No Rush , it is a long journey.
Useful Tags.
**********************
My total posts
tradingview.sweetlogin.com
1Million Journey
tradingview.sweetlogin.com
tradingview.sweetlogin.com
********************************************************************************************************************** #Manta ,#OMNI, #DYM, #AI, #IO, #XAI , #ACE #NFP #RAD #WLD #ORDI #BLUR #SUI #Voxel #AEVO #VITE #APE #RDNT #FLUX #NMR #VANRY #TRB #HBAR #DGB #XEC #ERN #ALT #IO #ACA #HIVE #ASTR #ARDR #PIXEL #LTO #AERGO #SCRT #ATA #HOOK #FLOW #KSM #HFT #MINA #DATA #SC #JOE #RDNT #IQ #CFX #BICO #CTSI #KMD #FXS #DEGO #FORTH # AST #PORTAL #CYBER #RIF #ENJ #ZIL #APT #GALA #STEEM #ONE #LINK #NTRN #COTI #RENDER #ICX #IMX #ALICE #PYR #PORTAL #GRT #GMT # IDEX #NEAR #ICP #ETH #QTUM #VET #QNT #API3 #BURGER #MOVR .

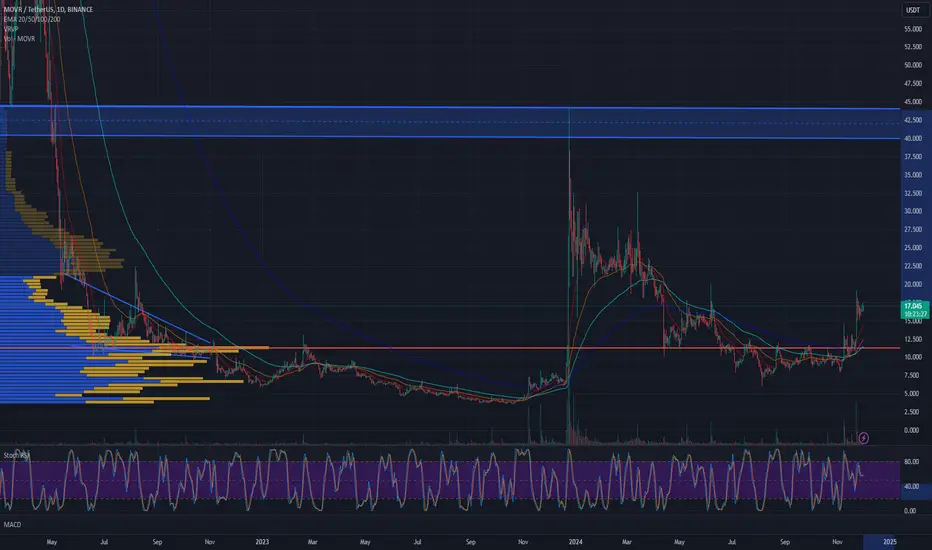
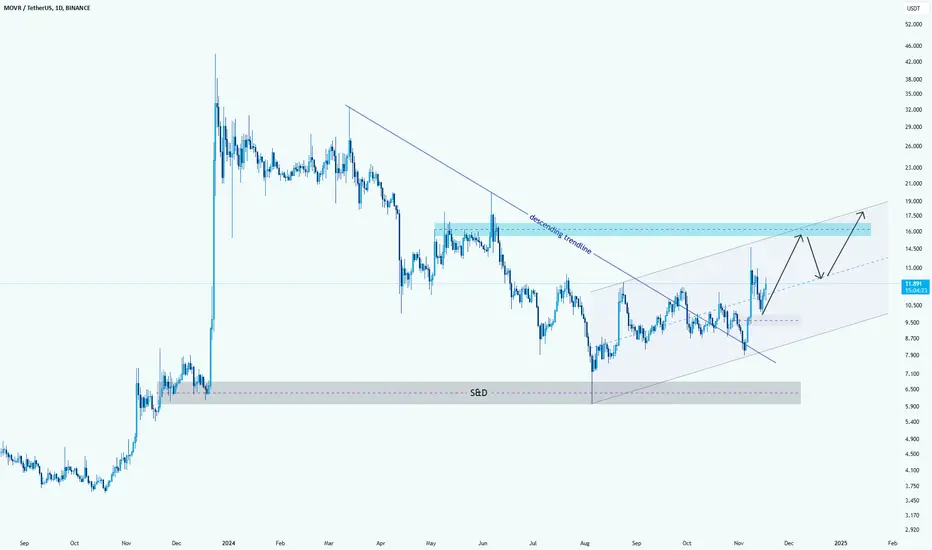
MOVR/USDT Approaching Key Resistance Levelshello guys!
Trend Breakout: The price broke above the long-term descending trendline, signaling a potential shift to bullish momentum.
Current Range: The asset is trading within an ascending channel, with the lower boundary around $10 and resistance near $16-$18.
Support Zone: A strong demand zone (S&D) around $7-$8 has acted as a launchpad for the recent upward movement.
Resistance Area: $16-$18 represents a significant supply zone, as highlighted. A breakout above this level could lead to a rally toward $20 and beyond.
Possible Scenarios:
A continuation within the channel with a potential retest of the $12-$13 area before another leg upward.
A breakout above $18, confirms bullish dominance.
Failure to hold within the channel could push the price back toward the $10 or $7-$8 support zones.
#MOVR / USDT:#MOVR / USDT:
SEED_DONKEYDAN_MARKET_CAP:MOVR closed the week with a strong weekly candle at $11.522, marking a +35.78% gain. This weekly close signifies a breakout from the downtrend, indicating potential bullish momentum to test higher levels.
Upcoming Targets:
🎯 First target: $22.284
🎯 Second target: $31.478
🎯 Third target: $38.908
If the price maintains a weekly close above $10.268, it reinforces the likelihood of the upward trend continuing and achieving the mentioned targets. 📈🔥
new sicle for moonriver (movr) 130%the first to move the key is (9.80) lets watch if Btc stays up 70K its will be grate for all crypto and (MOVR) will be the first to move.
#MOVR/USDT#MOVR
The price is moving in a symmetrical head and shoulders pattern on the 4-hour frame
We are now in the right shoulder formation and a rebound is expected
We have a rebound from the lower limit of the pattern at 9.00
We have an upward trend on the RSI indicator that is about to be broken, which supports the rise
We have a trend to stabilize above the moving average 100
Entry price 0.007459
First target 0.007980
Second target 0.008738
Third target 0.009700
Moonriver Reversal Pattern Confirmed (159%, 489% & 820% Pot.)Back in late 2023 Moonriver (MOVRUSDT) produced a rounded bottom before a major bullish wave. Now, in 2024, we are seeing triangular bottom, which ends in an ascending triangle before bullish growth.
The pattern on its own is good but the fact that the action is moving today above the triangle's neckline (or baseline) is the most interesting part. If the pattern is not complete, anything goes; but once on the bullish zone, the probabilities favor a continuation.
In this MOVRUSDT chart we have a long-term higher low and after 9 months of bearish action, a major correction, I wouldn't be surprised to see growth.
You can find the targets on the chart. These are short- to mid-term. Long-term it can go higher and higher and higher... And higher.
Thank you for reading.
Your support is appreciated.
Namaste.
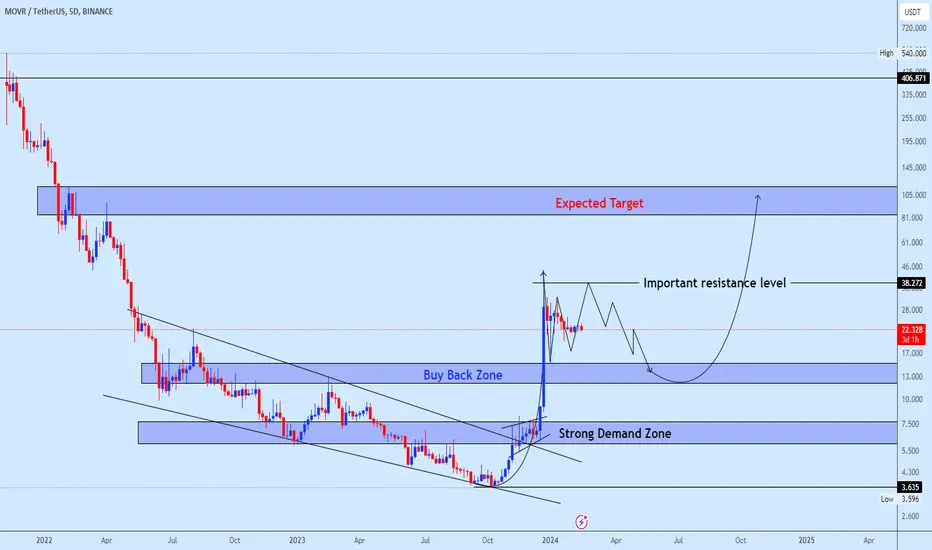
Movrusdt next trading planAfter a big increase where MOVRUSDT's value went up by more than 900% thanks to a positive market trend, it's now in a phase where its price is stable with potential sideways movements.
We've done well in the past by picking the formation of bullish divergence to buy, and you can see our strategy on this chart:
Right now, we're waiting to see what price do next. We've also picked out a specific price area where it might be a good idea to buy if the opportunity comes up.
Although, it will be good to keep an eye on important resistance level shown on the chart, this level has been hard for MOVRUSDT to get past. If the price goes up and doesn't fall after hitting this tough spot, our plan to buy at the lower price might not work anymore.
Your engagement is fully welcome on our view.