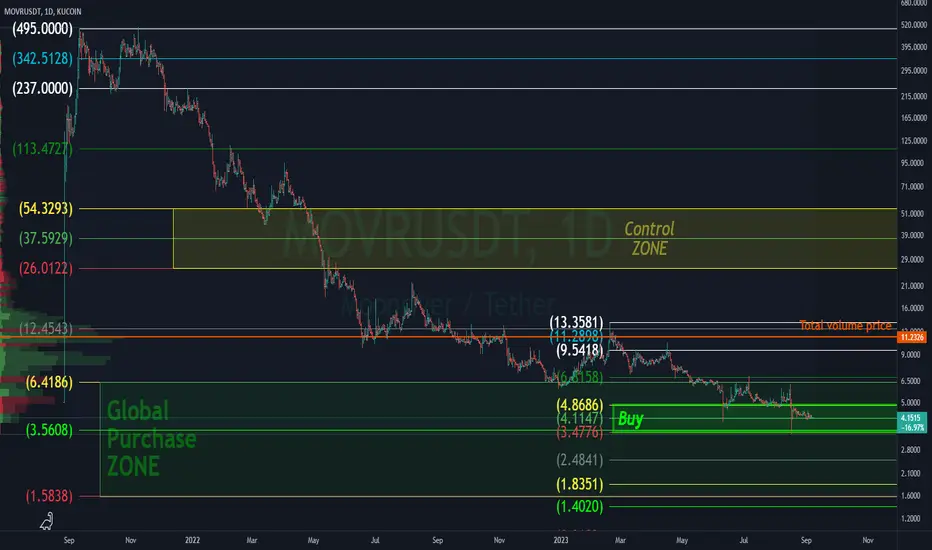
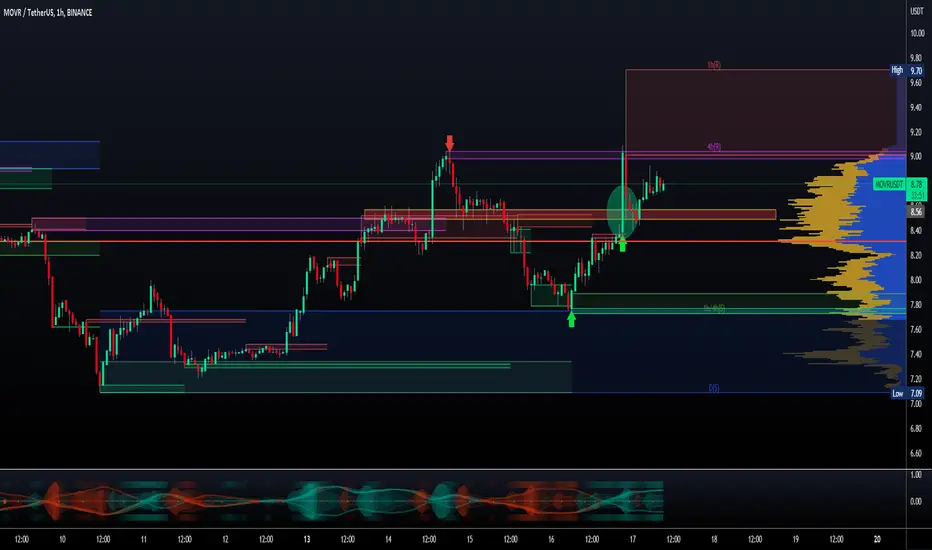
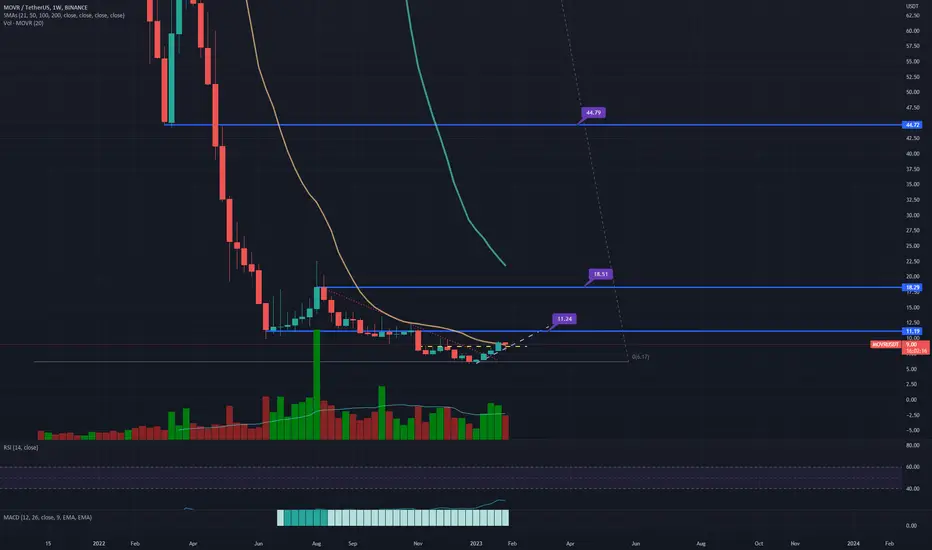
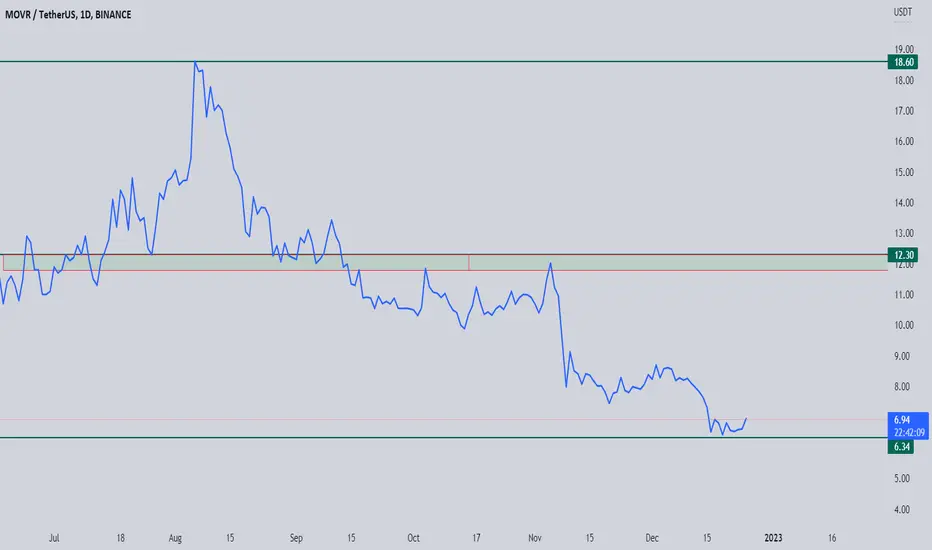
MOVR in the purchase zone!!!I set the levels for the global impulse (white) 495.0-237.0
Received the control zone 54.32-26.01 and the global purchase zone 6.41-1.58
The purchase level of this zone is 3.56
Set the levels according to the local pulse (white) 13.3-9.54
Got the purchase zone 4.86-3.47
Total volume price 11.2326
I do not expect a sharp exit, there will be accumulation and withdrawal of coins!!!
MOVRUSDT trade ideas
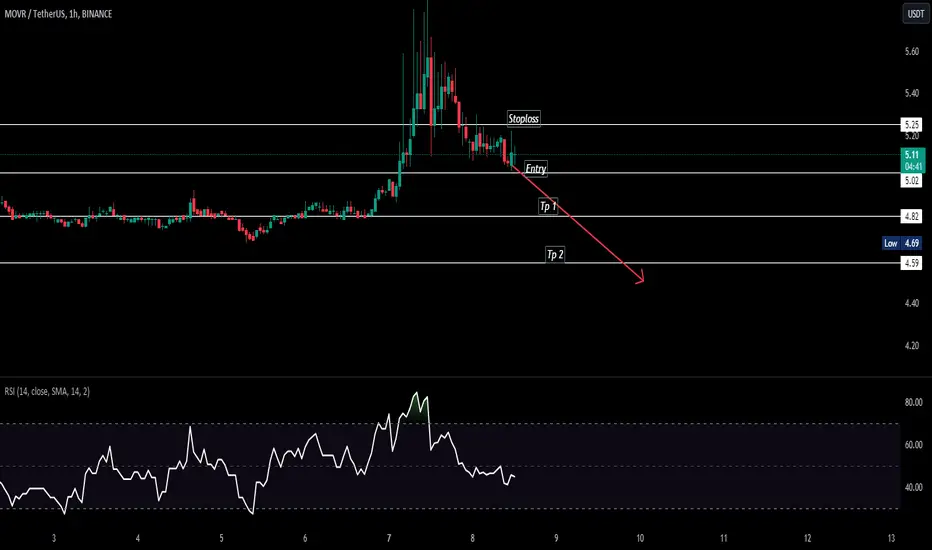
$MOVR Breakout Trendline & Retest Done $MOVR Breakout Trendline and Retest Done
Simple Way to Trade Trendline Breakouts
Talking Points:
Always wait for the current candle to close beyond the trendline to confirm the break.
Enter into the trade when price retraces back within a few pips of the original trendline, trading in the direction of the original breakout.
Set your Stop a few pips beyond the trendline and set your Limit at least twice as far as your Stop.
Step 1. - Locating the Trendline
As a review, a trendline is a line connecting two or more lows or two or more highs, with the lines projected out into the future. Traders than look at these projected lines and look for future prices to react around those levels. For a detailed lesson in identifying and drawing valid trendlines, check out my 3 Tips For Trendline Trading.
On the chart below is an example of a trendline that developed today on the MOVR/USDT on an Hourly chart. You can see how I connected the two swing lows to create a line and projected that line out into the future.
Step 2. – Wait For a Confirmed Breakout
Next, we need to see how the price reacts to the projected trendline. There are two potential outcomes when price comes into contact with a trendline:
The price will bounce off the trendline
The price will break through the trendline
This article focuses on the latter. So we wait to see if the price does in fact break through the price. But we aren’t ready to place a trade just because the price breaks through the trendline. We need to wait and see if the current candle closes beyond the trendline. We require a candle to close beyond the trendline to confirm the breakout. This is a very important rule.
Step 3. Set Up The Trade
Remember the first image I showed you of the GBP/USD Hourly chart? Let’s go back to that example because it actually ended up producing a near perfect breakout setup. Soon after that snapshot was taken, the GBP/USD fell and broke through our trendline with authority. A very short time after that, the Hourly candle closed below the trendline and confirmed the breakout as well. Once this happened, it was time to get to work to setup this trade.
There are 3 things we needed to do to execute this breakout trade:
Set an Entry order to Sell just below the original trendline.
Attach a Stop order several pips above the trendline.
Attach a Limit that is as least twice as large as our Stop .
There is a saying that goes “What once was resistance, can later become support. And what once was support, can later become resistance.” This is the mantra we rely on when setting an Entry order near the original trendline. We are looking for price to retrace back to the point of support/resistance it just broke through, and then continue back into the direction of the original breakout. Take a look at how the trade was setup below. I magnified the main part of the chart so it’s easier to read.

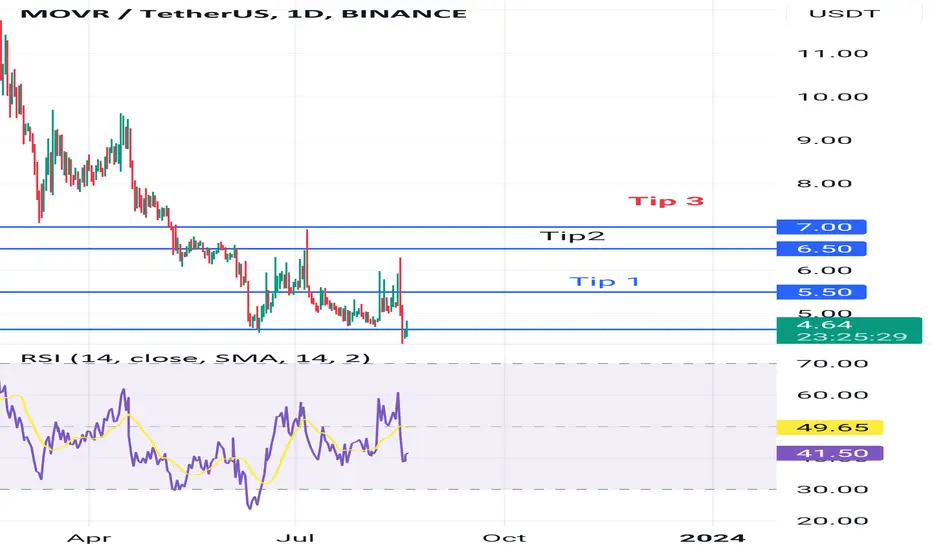
Don't miss this Tip 1 at 5.5$
Take 50% of the profit
Tip 2 at 6.5$
Take 30% of the profit
Tip 3 at 7$
Take the rest of the profit 📈 😴
movr:bullishafter we saw massive bearish on this token its time to see massive bullrun
trg1 : 30$
trg2 : 45$
trg3 : 80$
MOVRUSDTMOVRUSDT is in bearish phase potentially printing LH and LL>
There is no divergence shown which indicates trend is continue.
We wait and watch for the breakout of last LL.
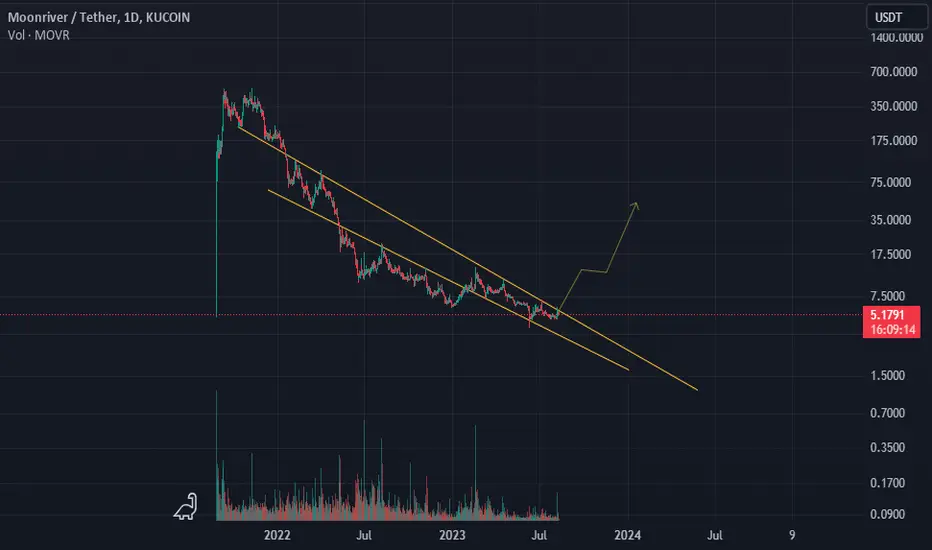
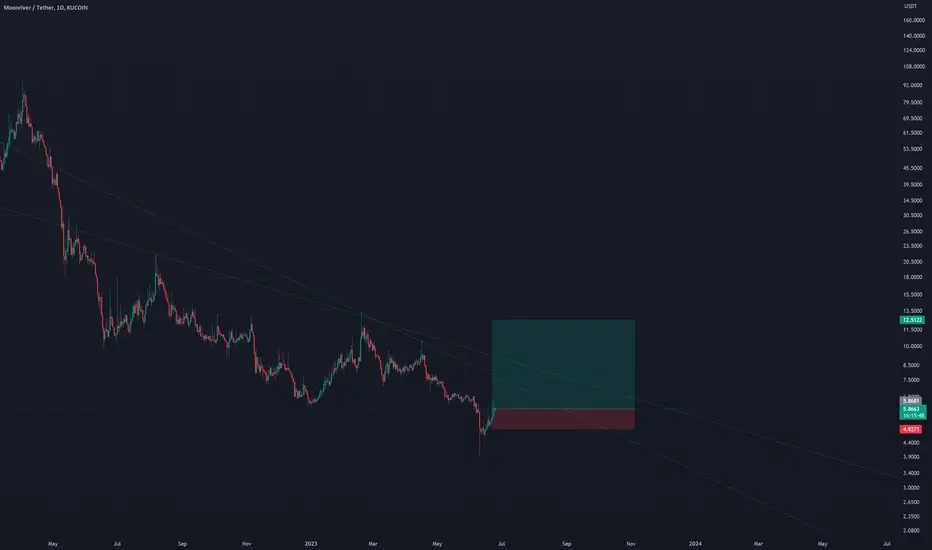
Movr Preparing For Bullish Rally Towards 10$ Seems Like Has Getting Ready for Bullish Rally Formed Descending Channel In daily Timeframe Incase Of breakout Expecting Move Towards 10$ Keep Eyes On For Breakout

At least 100% profit if BTC buyers continue the trendBig Buyers are waiting for it to break the resistance. If BTC keep the trend, it has the potential to reach at least 12$
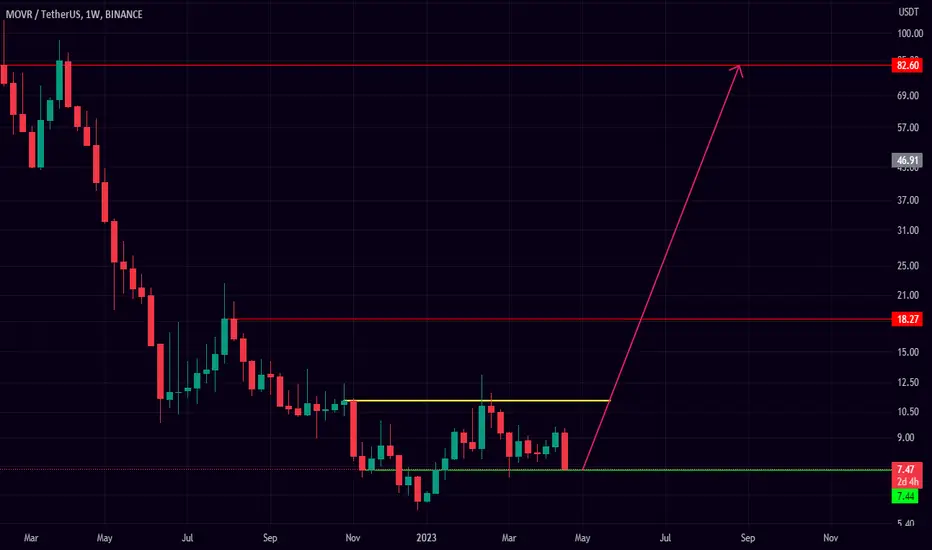
moonriver #movr
bounce price 6.3$
first tip 9.29$
second tip 13.1$
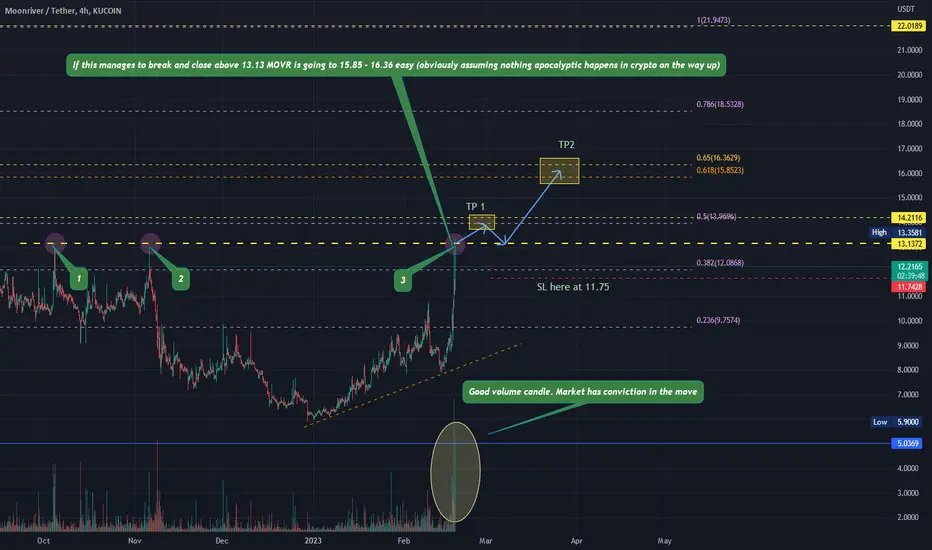
if it holds above 13$ and the week candle closed above 13$
expect the third target at 22$
if next week candle closed above 22$ final target would be 84.7$
#btc #bnb #cryptocurrency #pepe #XRP #binance #gem #memecoin #Eth
Moonriver ($MOVR) - Insane buy opportunityI think $MOVR has insane potential IF it manages to hold the green line
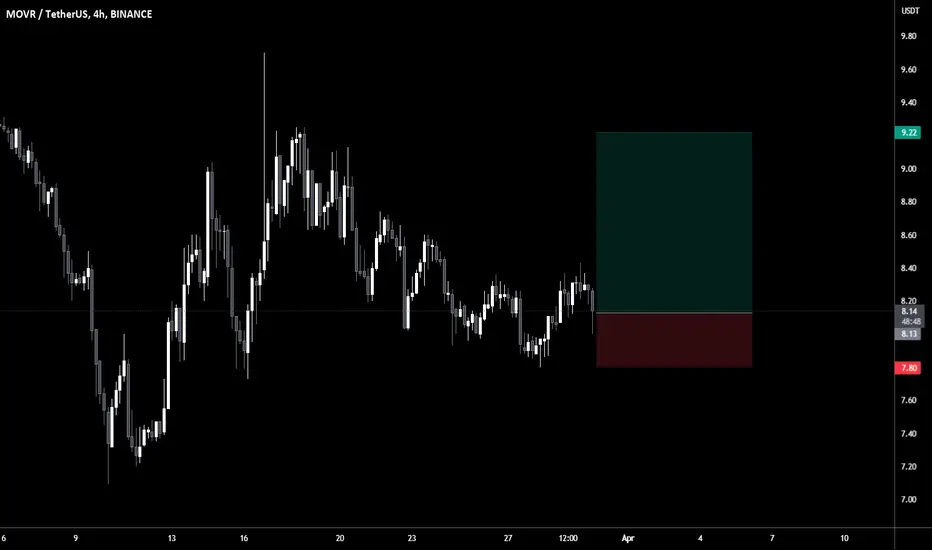
$MOVR/#USDT [#Moonriver]: Resistance_Breakout_Confirmation◳◱ A Resistance Breakout and Confirmation has been detected on the $MOVR / $USDT chart. The price has broken above a key resistance level and has been confirmed by a strong candle, indicating a potential bullish trend. The next resistance key levels are located at 9.22 | 10.38 | 12.6, and the major support zones can be found at 7 | 5.94 | 3.72. Consider entering a trade at the current price zone of 8.8 and targeting higher levels.
◰◲ General info :
▣ Name: Moonriver
▣ Rank: 318
▣ Exchanges: Binance, Kucoin, Huobipro, Gateio, Mexc
▣ Category/Sector: Infrastructure - Smart Contract Platforms
▣ Overview: Moonriver is a parachain on the Kusama network. Kusama is a "canary network" which encourages experimental development prior to implementation on the Moonbeam sister chain on Polkadot. Like Moonbeam, Moonriver is an EVM-compatible smart contract platform built using the Substrate framework. The network has a native token called Moonriver (MOVR), which will allow holders to participate in consensus through staking, paying for transactions, and vote on governance proposals.
◰◲ Technical Metrics :
▣ Mrkt Price: 8.8 ₮
▣ 24HVol: 3,450,237.846 ₮
▣ 24H Chng: 9.453%
▣ 7-Days Chng: 13.37%
▣ 1-Month Chng: -2.78%
▣ 3-Months Chng: 27.42%
◲◰ Pivot Points - Levels :
◥ Resistance: 9.22 | 10.38 | 12.6
◢ Support: 7 | 5.94 | 3.72
◱◳ Indicators recommendation :
▣ Oscillators: BUY
▣ Moving Averages: STRONG_BUY
◰◲ Technical Indicators Summary : BUY
◲◰ Sharpe Ratios :
▣ Last 30D: 0.02
▣ Last 90D: 1.08
▣ Last 1-Y: -1.19
▣ Last 3-Y: -0.39
◲◰ Volatility :
▣ Last 30D: 1.17
▣ Last 90D: 0.92
▣ Last 1-Y: 1.04
▣ Last 3-Y: 1.41
◳◰ Market Sentiment Index :
▣ News sentiment score is N/A
▣ Twitter sentiment score is 0.38 - Bearish
▣ Reddit sentiment score is 0.76 - V. Bullish
▣ In-depth MOVRUSDT technical analysis on Tradingview TA page
▣ What do you think of this analysis? Share your insights and let's discuss in the comments below. Your like, follow and support would be greatly appreciated!
◲ Disclaimer
Please note that the information and publications provided are for informational purposes only and should not be construed as financial, investment, trading, or any other type of advice or recommendation. We encourage you to conduct your own research and consult with a qualified professional before making any financial decisions. The use of the information provided is solely at your own risk.
▣ Welcome to the home of charting big: TradingView
Benefit from a ton of financial analysis features, instruments and data. Have a look around, and if you do choose to go with an upgraded plan, you'll get up to $30.
Discover it here - affiliate link -
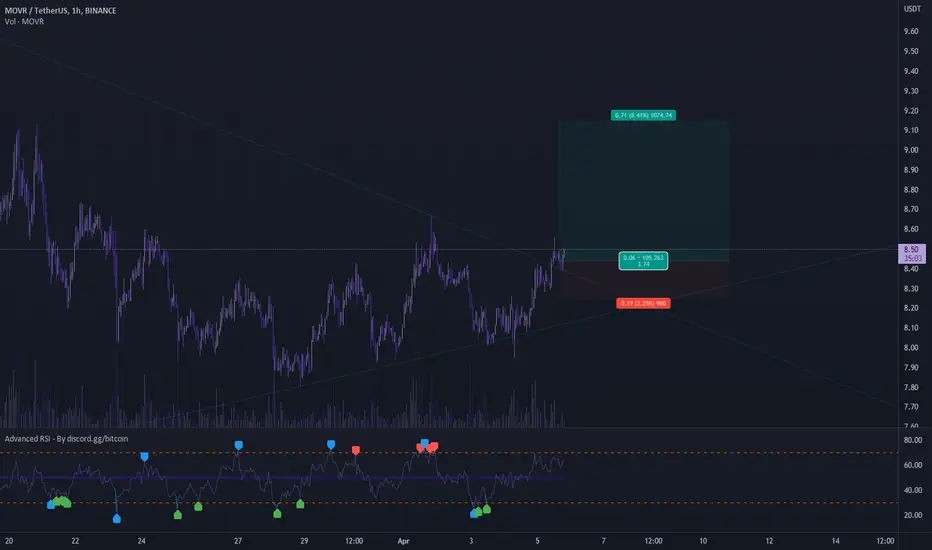
MOVR looking like it's ready to break out hereMOVR has breached trend and retested, looking for a decent leg up alongside the rest of the market.
Do you think we'll see a good alt season of the coming days/weeks???
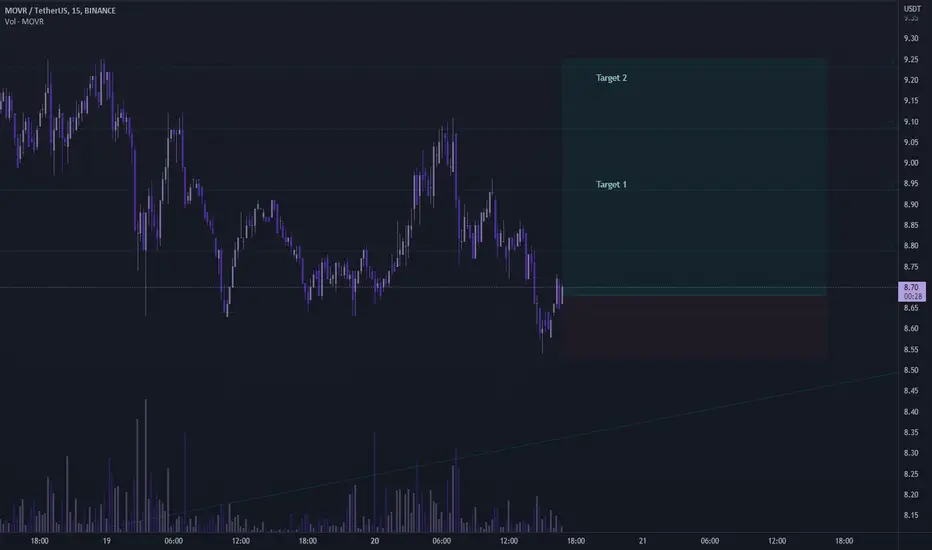
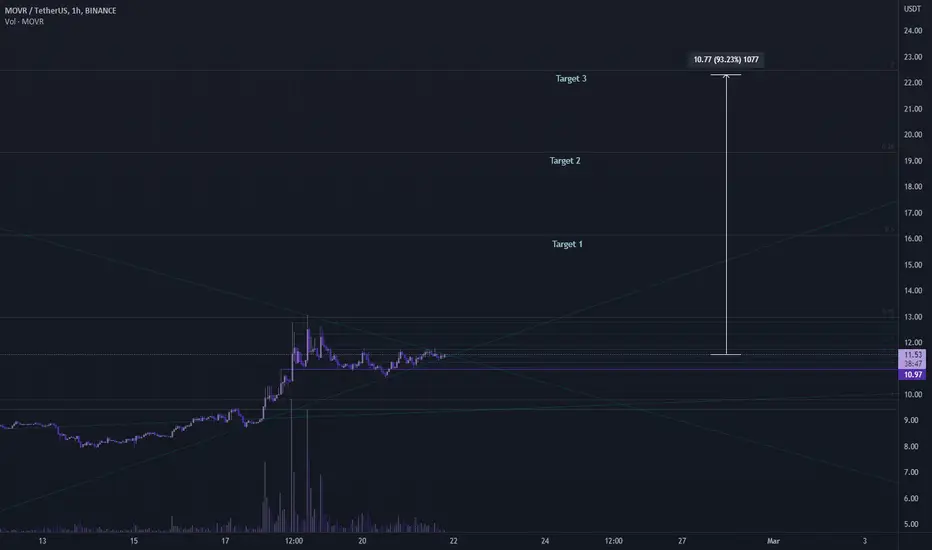
Scalp long on MOVRWe'll see if bitcoin can squeeze up, MOVR has reclaimed it's range after running a few equal lows, mid range and top of range are my targets.
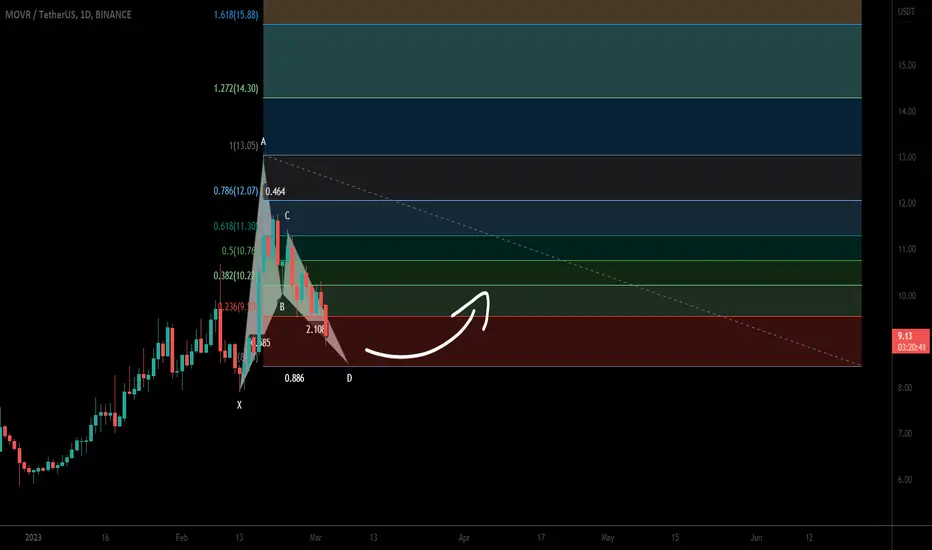
Moonriver (MOVR) forming bullish BAT for upto 52.50% moveHi dear friends, hope you are well and welcome to the new trade setup of Moonriver (MOVR) with US Dollar pair.
Now on a daily time frame, MOVR is about to complete the final leg of a bullish BAT move for another price revesal.
Note: Above idea is for educational purpose only. It is advised to diversify and strictly follow the stop loss, and don't get stuck with trade
Decision time for MOVRGetting to the end of this bull flag, resistance above around 11.73 level. Clear that and we see if the previous high gets swung or blasted past.
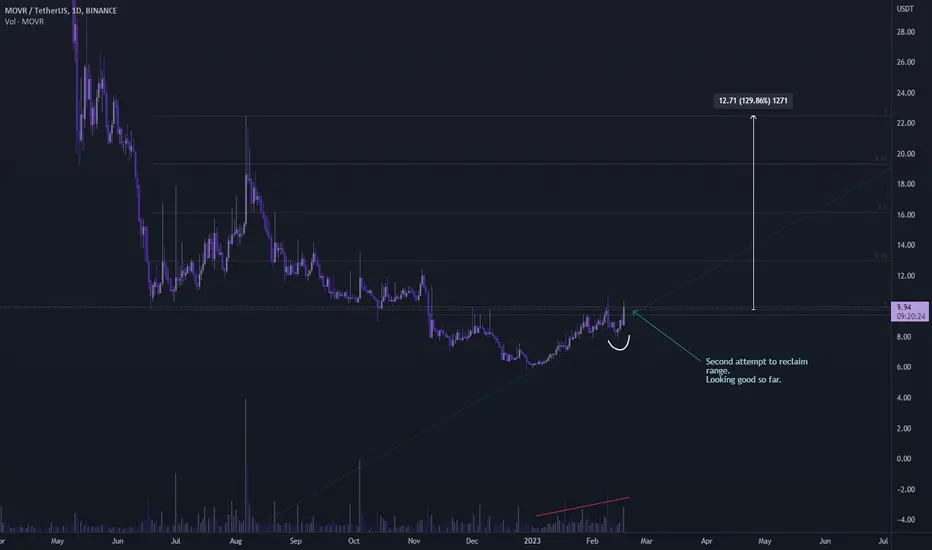
MOVR looking goodKeeping my eyes on MOVR.
Currently making its second attempt to reclaim the range. A solid move to the top of the range if it can do so.
It's holding inside the range and testing, may start loading a bag if the rest of the market is looking good for upside.
Mover is setting up for upsideAlts are having good rally and $MOVR is lagging behind, but seems it's all set now for firework.
Currently supporting daily trend line, above on 100 dMA, once it's clear 200 dMA and big resistance of $11, sky is the limit. above is weekly chart BINANCE:MOVRUSDT
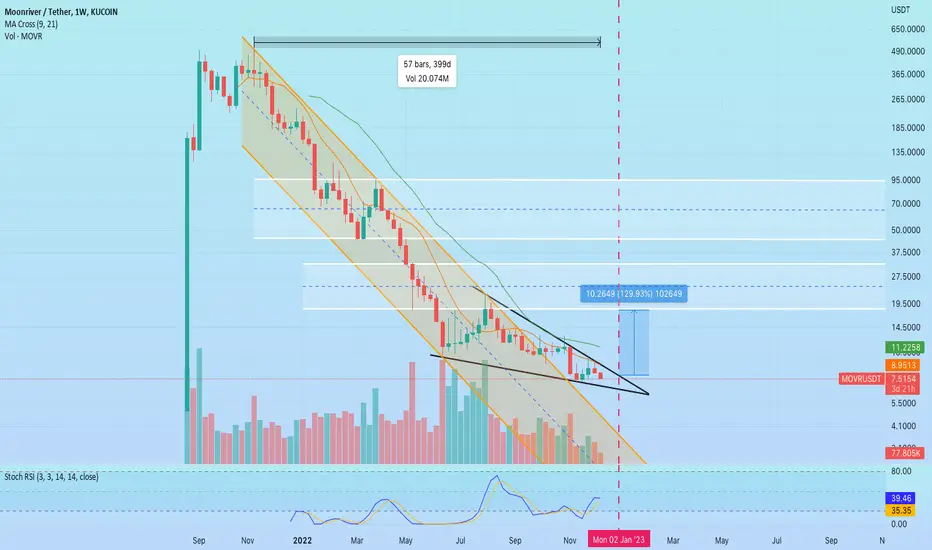
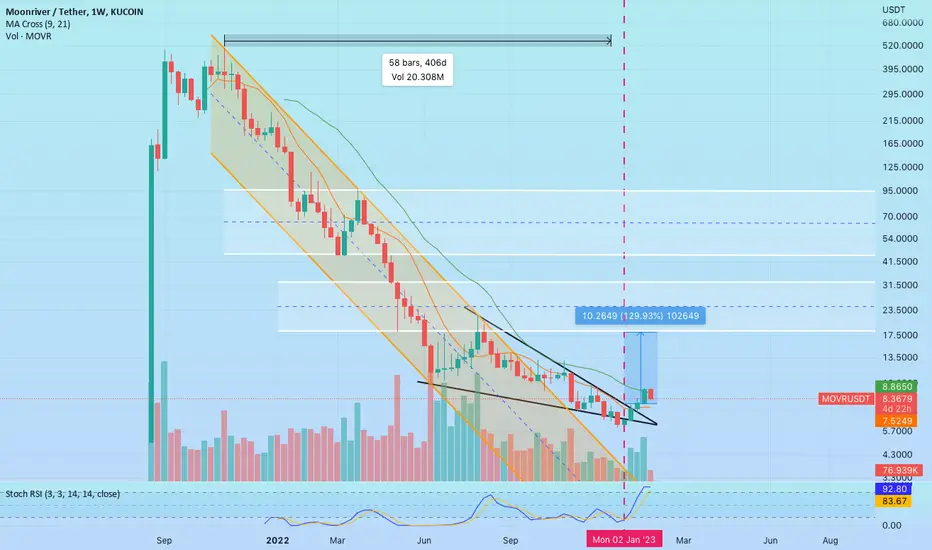
MOVR. The global trend has changed, but...MOVR lost its audience and community during the bear market. Few people at the moment consider this a promising thing. Note that during this bear there were no new projects launched on the moonriver as on the main network... The exception is bridges. But, bridges create integrations more for their own development, and not for a specific blockchain personally. Therefore, I have concerns about positive price fluctuations. On the other hand, a broken wedge indicates growth.
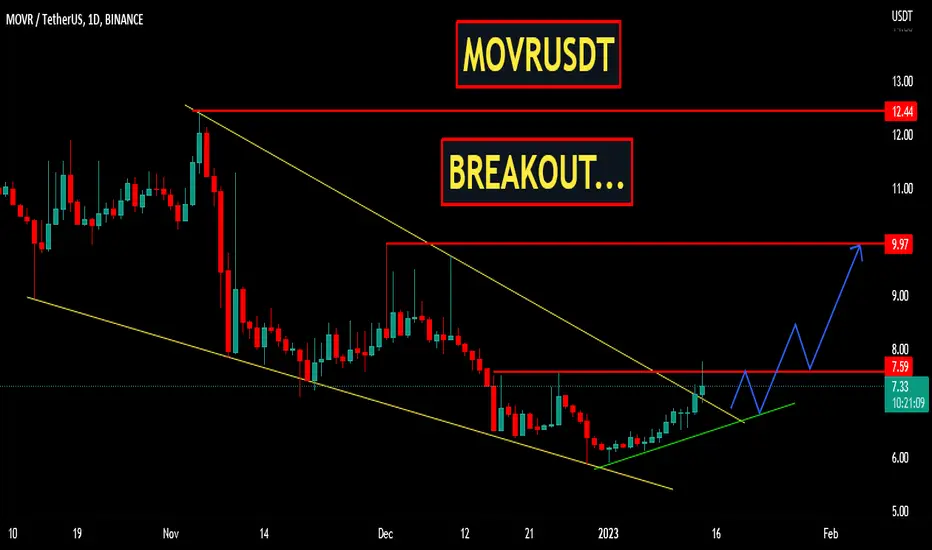
MOVRUSDT | BREAKOUT...MOVRUSDT has broken the falling wedge . The price is trading below the horizontal resistance. The bulls need to sustain price above the resistance zone .
We are expecting a bullish break above the mentioned horizontal level will bring bulls in complete control. While bears will be active below the break of rising support.
Trade your levels accordingly.
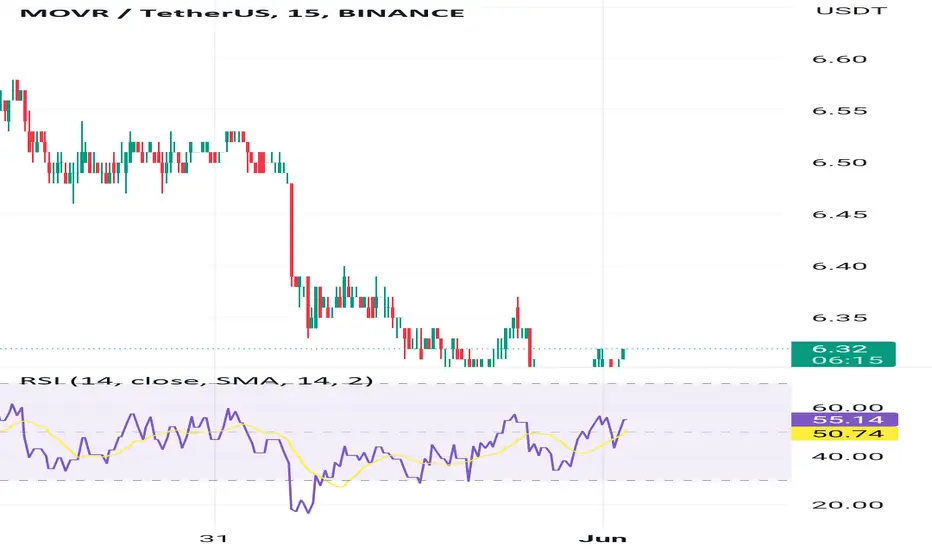
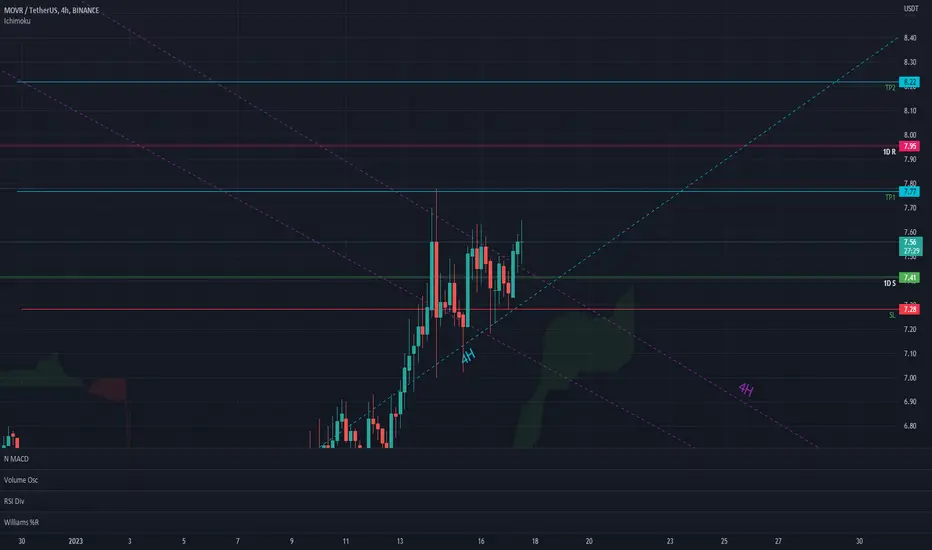
MOVR : INTERESTING FOR DAY TRADINGMOVR: INTERESTING FOR DAY TRADING
Volume range seems interesting on this coin.
MOVR. Potential global trend change.The price has formed a long bearish trend, which ends with the breakdown of descending channel and formation of a falling wedge. Based on this and continued bearish trend, the formation of a falling wedge indicates a potential trend reversal. In short term, if indicators show the right picture, you can get 130% gain.