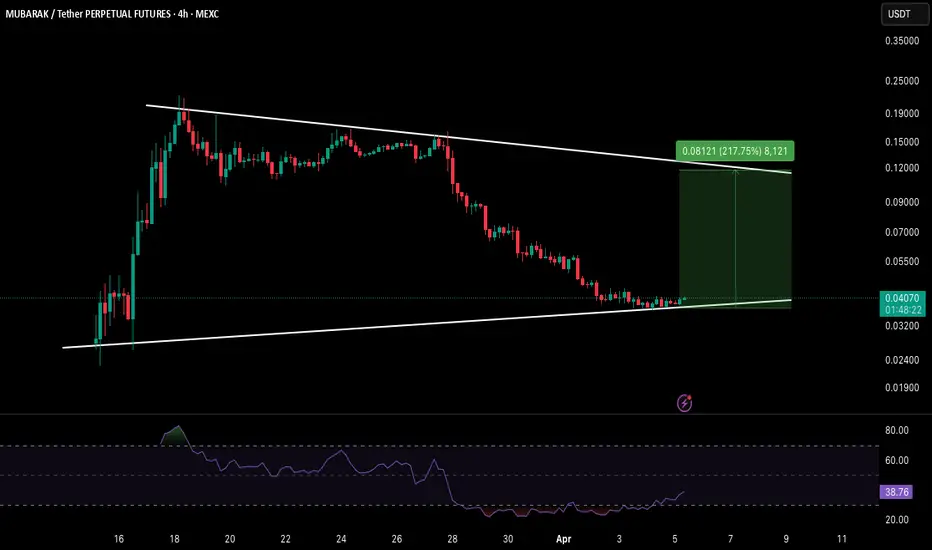
MUBARAKUSDT Forming Falling Wedge PatternMUBARAKUSDT is currently showcasing a classic falling wedge pattern, a widely recognized bullish reversal setup in technical analysis. After a period of steady decline within converging trendlines, the price appears to be approaching a breakout point. This pattern often signals a shift in market mom

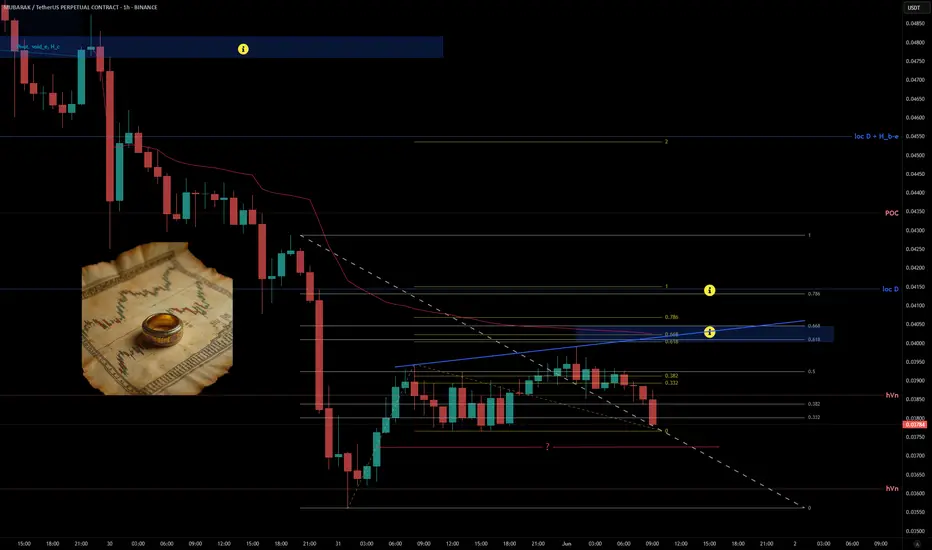
MUBARAK - Last Trades were BeautifulThis coins has really nice reactions to Fib and volume. Honestly this is one of my simplest coins. So nice reactions to fib and Vol
There is a really nice Short possibilities on those yellow marks. Lets see, what happens to volume if we reach there.
- There are very interesting confluences there. 2x
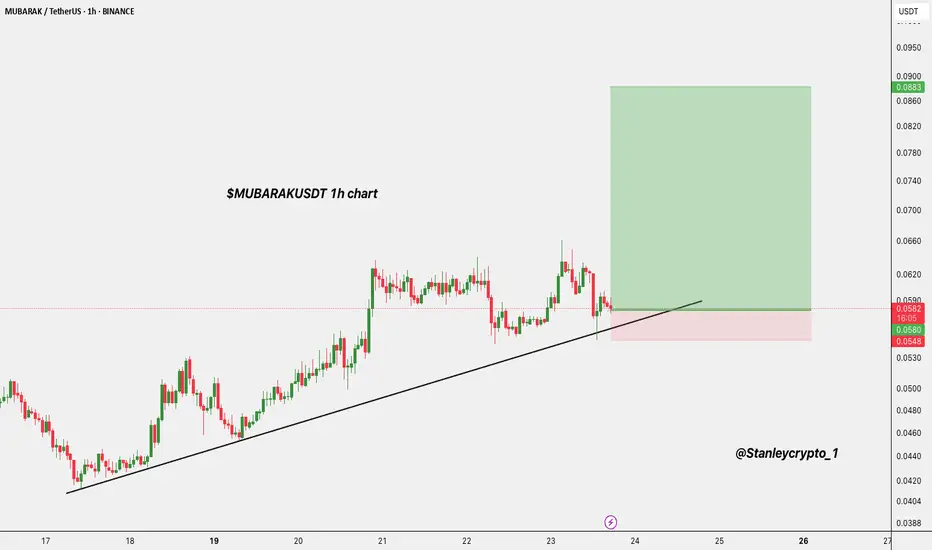
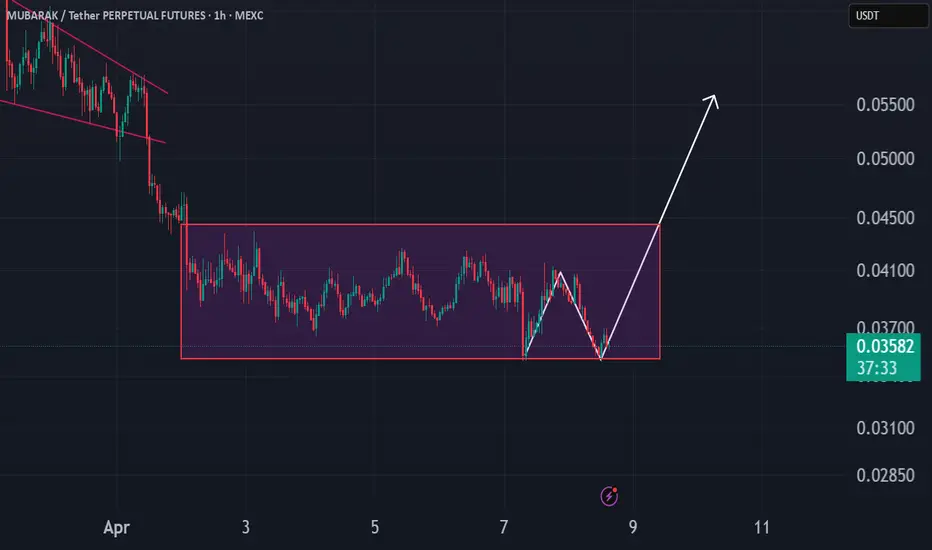
$MUBARAKUSDT Long Trade Setup Setup 1h ChartLooks like price is respecting the ascending trendline well, showing strength at key support levels.
Here’s the plan:
- Entry Zone: $0.0580
- Stop Loss: $0.0548
- Targets:
• TP1: $0.0740
• TP2: $0.0883
As long as the price holds above the trendline, we may see a strong move toward the upside.
Br
Mubarak the meme coinMubarak is a meme coin on the BNB chain, historically meme coins on binance do a minimum of 500 million marketcap.
good choice, not financial advice!!
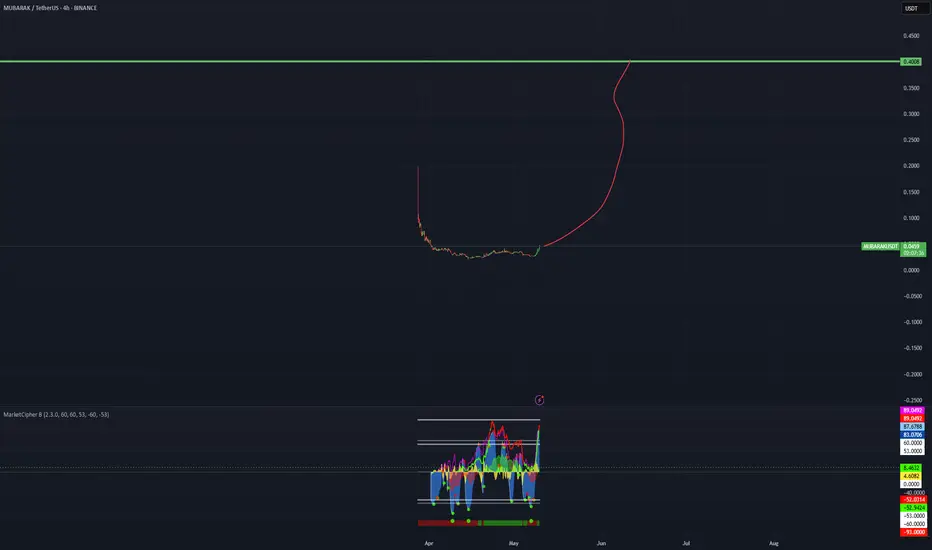
MUBARAK May Go Higher Than expected This chart illustrates the upside potential for Mubarak
Some coins did pullback today!
They may need to retest support
Bitcoin seems bullish
So altcoins could play ketchup
Mubarak can pump like Pengu did, could get volatile.
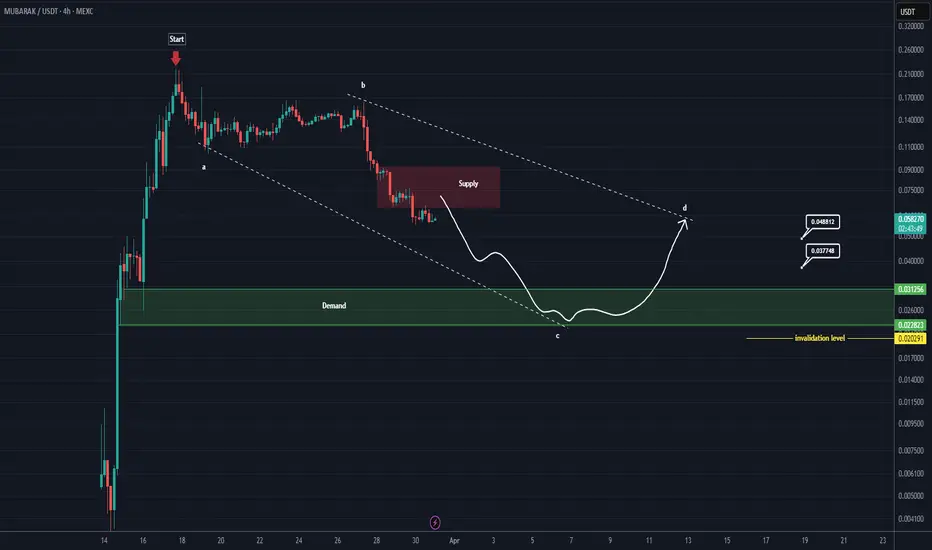
MUBARAK Roadmap (4H)The MUBARAK correction seems to have started from the point where I placed the red arrow on the chart.
The pattern could be a symmetrical, diametric, or expanding triangle. A strong demand zone lies ahead of the price, where we can look for buy/long positions.
Targets are marked on the chart.
A d
MUBARAKUSDT 4H AnalysisMUBARAK ~ 4H Analysis
#MUBARAK High Alert This trade carries a very high risk. Our analysis indicates this is a whale accumulation zone. Buy from here with a short-term target of at least 10%+.
MUBARAKUSDTWe can attempt to short MUBARAKUSDT from specified level as it make LH , also there is no bullish divergence occur indicate that it moves downward.

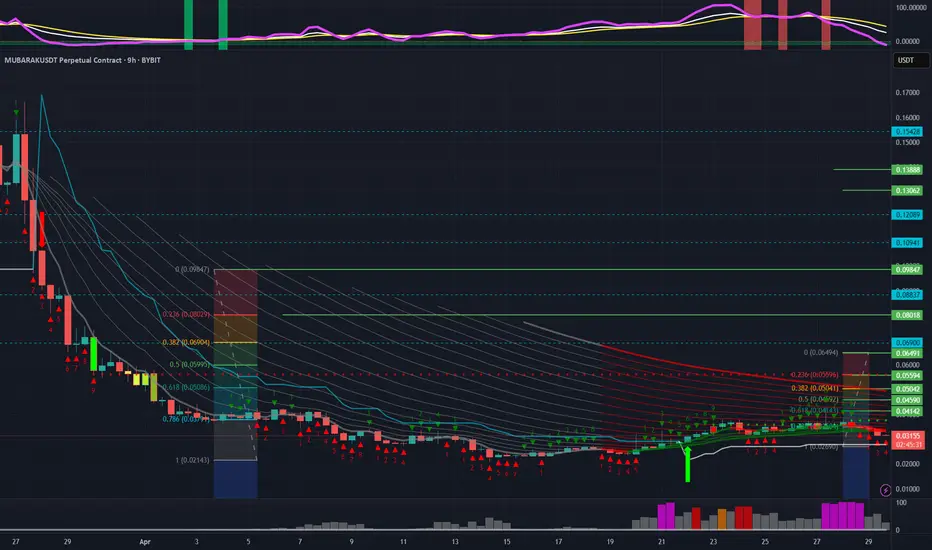
MUBARAK/USDT – Accumulation Ending? Double Bottom Signals Revers📊 Technical Overview: After a prolonged downtrend and descending wedge, MUBARAK has entered a consolidation range — clear signs of accumulation. The price has now bounced twice off the key support level at $0.003484, forming a textbook double bottom.
📈 Key Bullish Signals:
✅ Strong horizontal supp
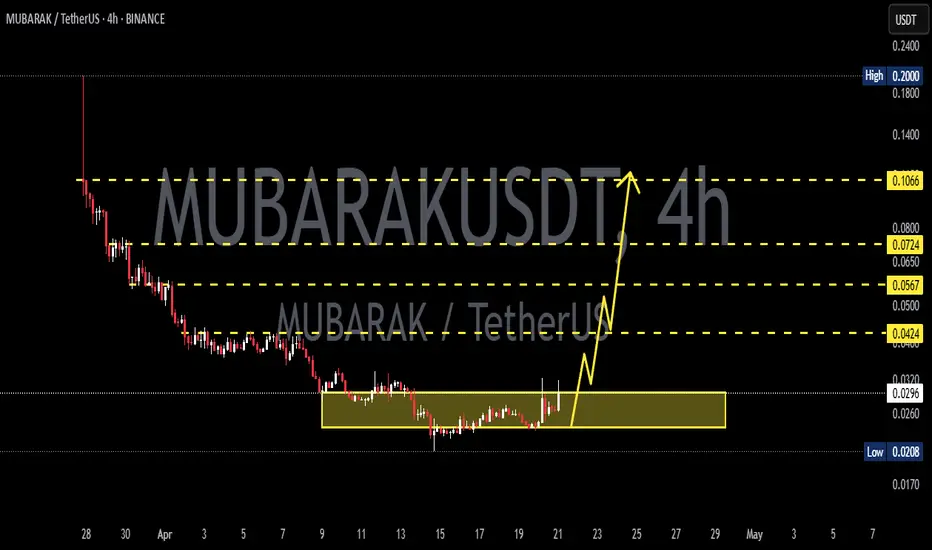
MUBARAK Long Trade SetupMUBARAK is a newly listed coin, and it is currently in a good position to rebound. I am expecting at least 150% to 200% rally soon.
Strategy:
~ Entry: $0.0375 to CMP.
~ Stop Loss: $$0.033.
~ Leverage: 5x to 10x.
~ Target: $0.051, $0.063, $0.085, $0.11.
Note: Always do your own analysis before inv
See all ideas
Summarizing what the indicators are suggesting.
Oscillators
Neutral
SellBuy
Strong sellStrong buy
Strong sellSellNeutralBuyStrong buy
Oscillators
Neutral
SellBuy
Strong sellStrong buy
Strong sellSellNeutralBuyStrong buy
Summary
Neutral
SellBuy
Strong sellStrong buy
Strong sellSellNeutralBuyStrong buy
Summary
Neutral
SellBuy
Strong sellStrong buy
Strong sellSellNeutralBuyStrong buy
Summary
Neutral
SellBuy
Strong sellStrong buy
Strong sellSellNeutralBuyStrong buy
Moving Averages
Neutral
SellBuy
Strong sellStrong buy
Strong sellSellNeutralBuyStrong buy
Moving Averages
Neutral
SellBuy
Strong sellStrong buy
Strong sellSellNeutralBuyStrong buy