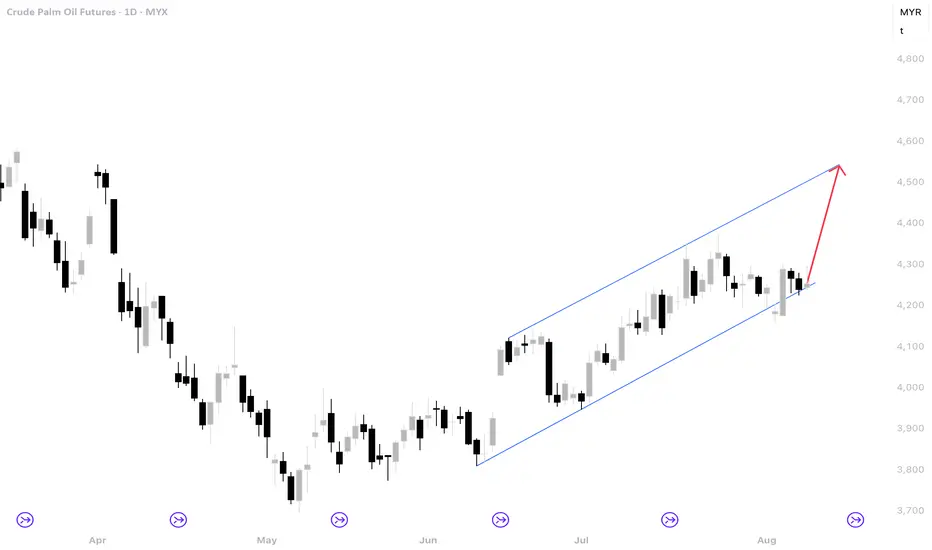
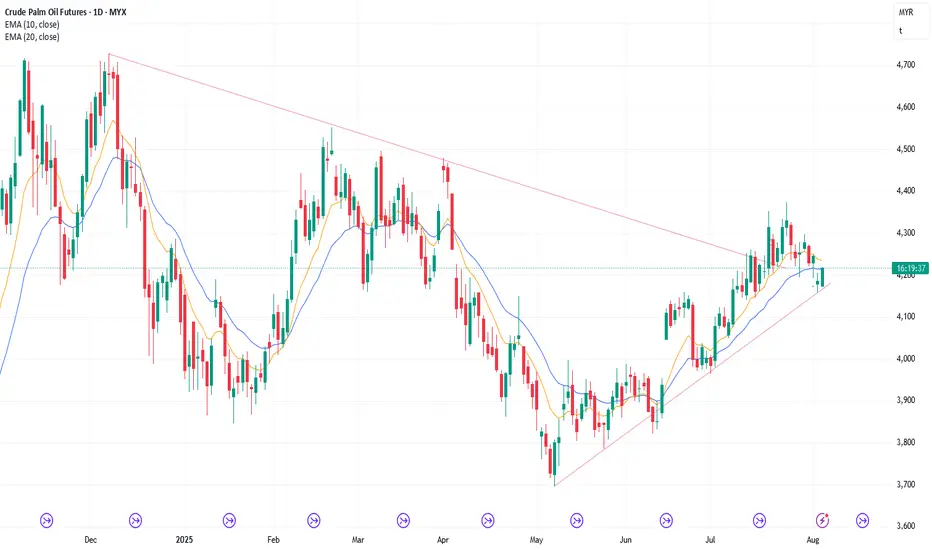
FCPO Week 33 2025: To continue higher towards 4500.It seems that the price has found support within the 4150 and 4200 area. For next week if price can break and close above 4300 another move higher is likely. Otherwise we will see more consolidation and this might lead to a test towards 4100.
Related commodities
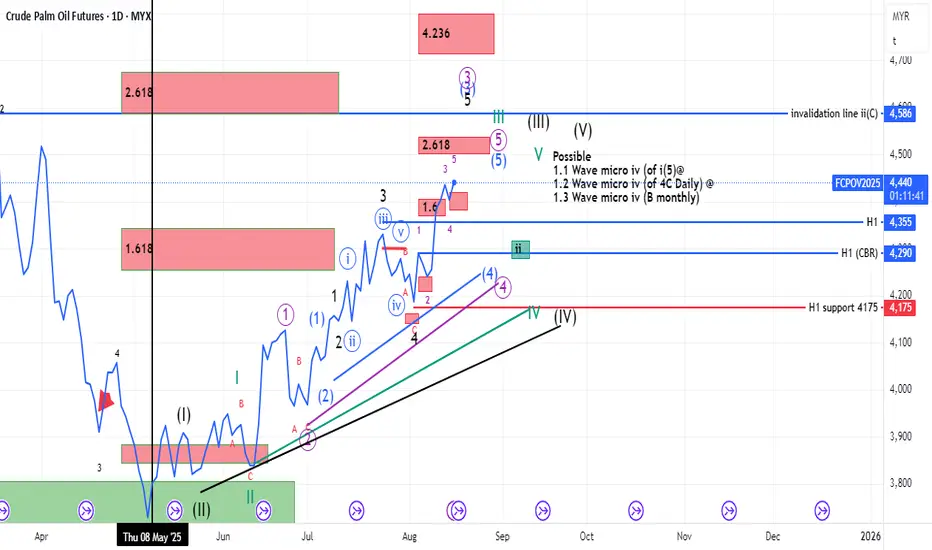
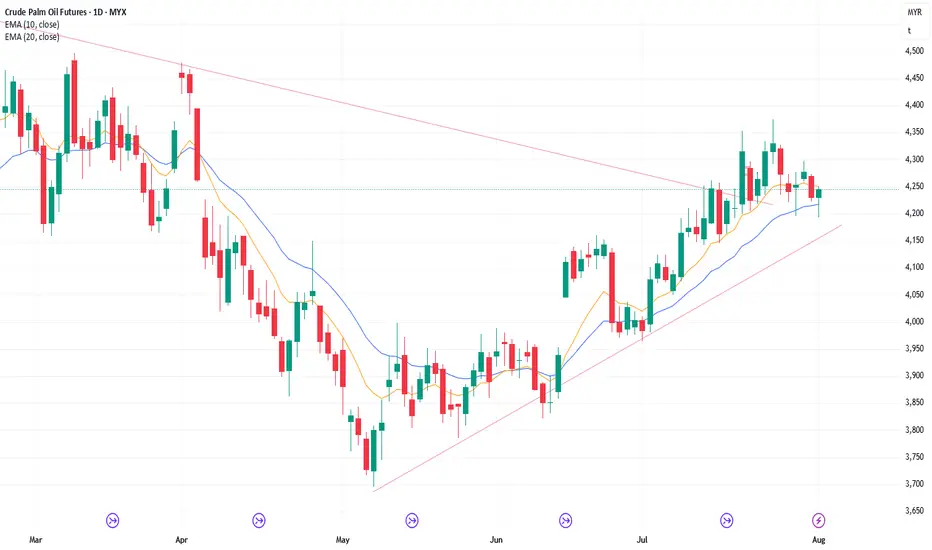
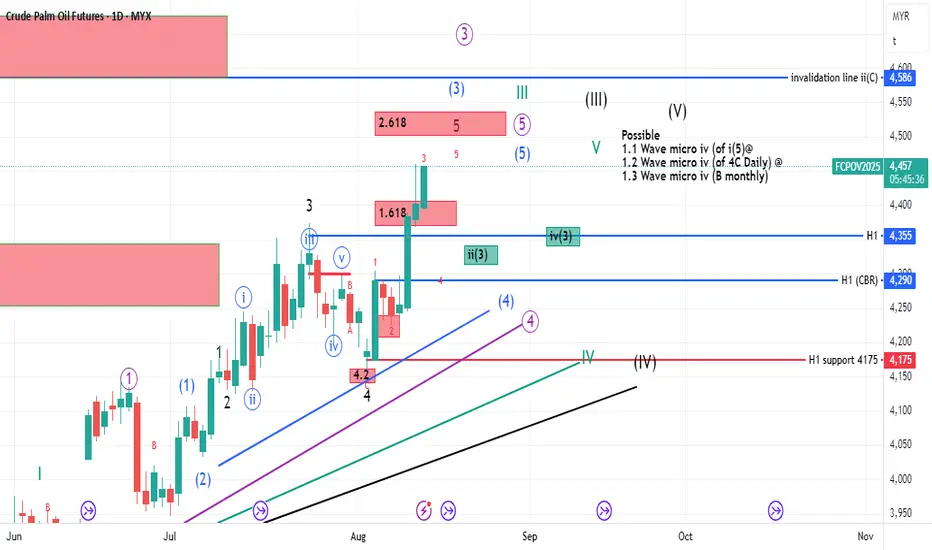
15082025 FCPO1! Daily ForecastWave 5(PURPLE)=Wave i(3)
From 4376 until 4455
Dari 4376 until 4474 (projected)
Previous wave
1) wave 4 (PURPLE)
From 4460 until 4376
From 4460 until 4420/4383 (projected)
Next wave
ii(3)
From 4455 until 4317/4279 (projected)
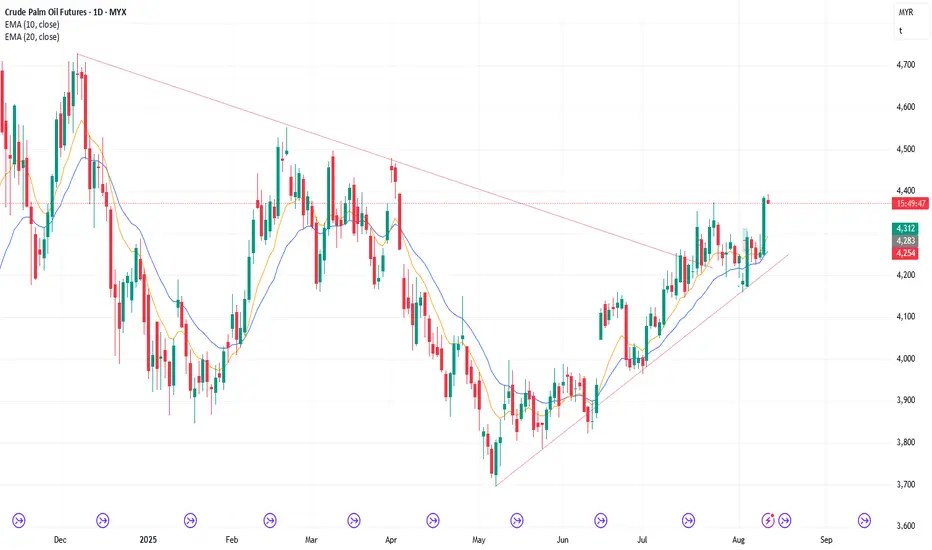
12/8/25 Bulls Need Follow-through Buying
Monday’s candlestick (Aug 11) was a big bull bar closing near its high.
In our last report, we said traders would see if the bears could create strong bear bars trading far below the 20-day EMA, or if the market would trade slightly lower, but lack follow-through selling (again), followed by a
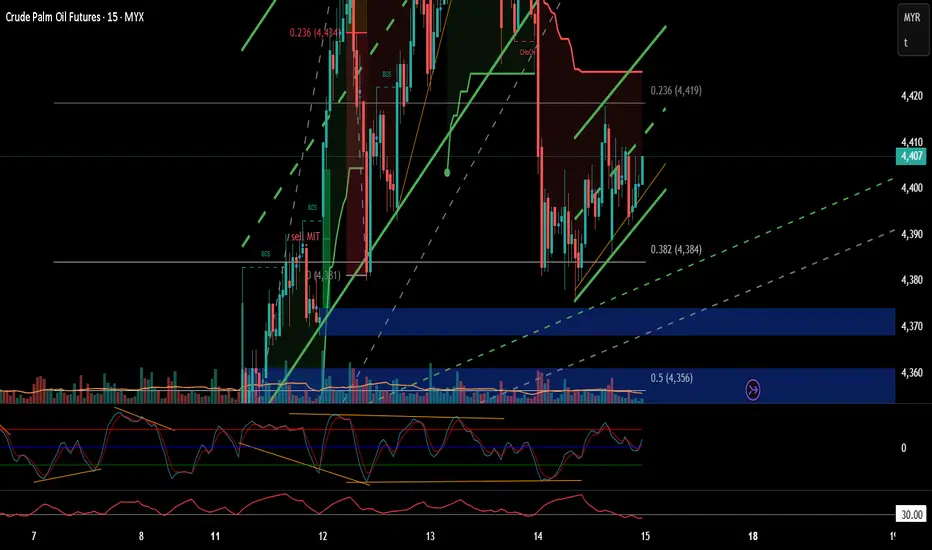
FCPO 15Aug25IF market open below 4395 it will go down potentially below 4376 for liquidity grab. If open and stay above 4400 it may reach TP 4486 eventually
5/8/25 Can Bulls Get A Bull Bar Above 20-Day EMA?
Monday’s candlestick (Aug 4) was a bull doji closing around the middle of its range with prominent tails.
In our last report, we said the market may gap down at the open. Traders would see if the bears could create follow-through selling, closing the day near its low, or if the market would lac
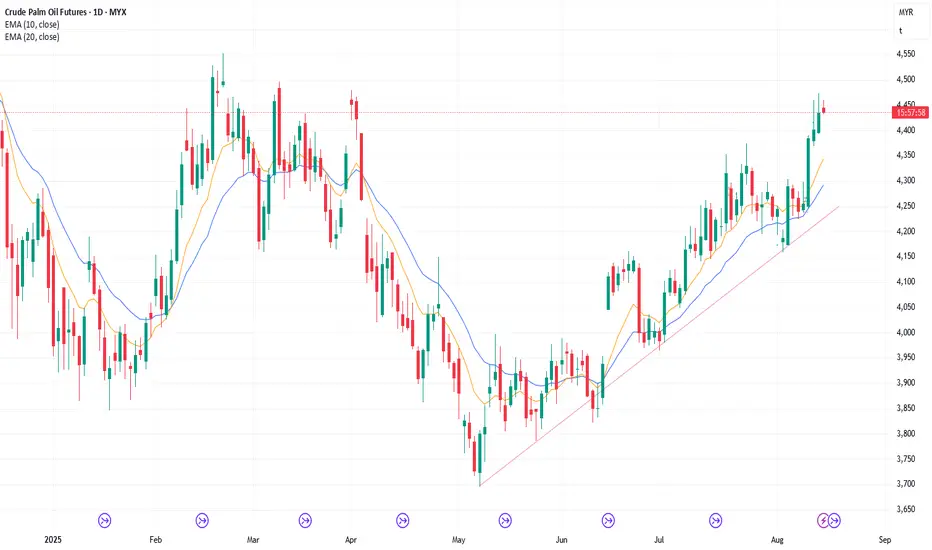
070825 FCPO1! Daily forecastProbability of forecast
1.1 Wave micro iv (of i(5)@
1.2 Wave micro iv (of 4C Daily) @
1.3 Wave micro iv (B monthly)
Observe H1 support (4173):
If candle closed < 4173, trend shall reverse to corrective mode or downtrend

4/8/25 Can Bears Create FT Selling or Not?
Friday’s candlestick (Aug 1) was a bull bar closing bear its high with a long tail below.
In our last report, we said traders would see if the bears could create a strong follow-through bear bar closing near its low, or if the market would trade lower, but close with a long tail below or a bull
15/8/15 Can Bears Create Strong PB or Fail to Do So?
Thursday’s candlestick (Aug 14) was a bear bar closing in its lower half with a prominent tail below.
In our last report, we stated that traders would see if the bulls could create more follow-through buying or if the market would begin to stall and form a pullback instead.
The market formed a
14/8/25 Bulls Want Big Leg up With Small Pullbacks
Wednesday’s candlestick (Aug 13) was a bull bar closing slightly above the middle of its range with a long tail above.
In our last report, we stated that traders would see if the bulls could create more follow-through buying, or if the bears would be able to generate some selling pressure inste
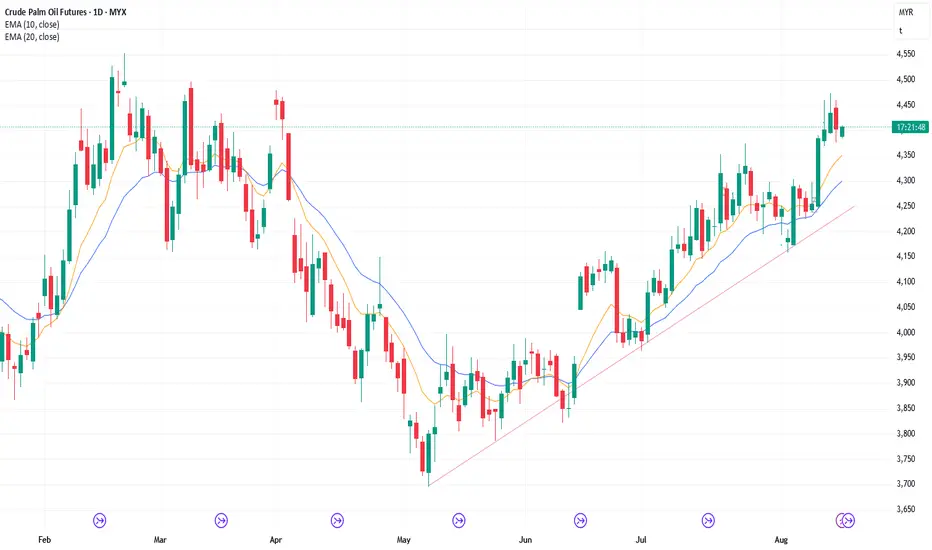
13/08/25 (am session) FCPO1!13/08/25 (am session)
(am) Now Daily (D1):
Wave: sub Wave 3 (red)
From 4225 until 4455
From 4225 until 4502/4537 (projected)
From 4225 until 4714/4799 (projected)
Previous Wave:
Wave 2 (red)
From 4292 until 4225
Next wave,
wave ii(3) at H1
From 4314 until 4341 (projected)
See all ideas
A representation of what an asset is worth today and what the market thinks it will be worth in the future.
Displays a symbol's price movements over previous years to identify recurring trends.
Frequently Asked Questions
Track more important stats on the Crude Palm Oil Futures chart.
The nearest expiration date for Crude Palm Oil Futures is Aug 14, 2026.
Traders prefer to sell futures contracts when they've already made money on the investment, but still have plenty of time left before the expiration date. Thus, many consider it a good option to sell Crude Palm Oil Futures before Aug 14, 2026.
Open interest is the number of contracts held by traders in active positions — they're not closed or expired. For Crude Palm Oil Futures this number is 0.00. You can use it to track a prevailing market trend and adjust your own strategy: declining open interest for Crude Palm Oil Futures shows that traders are closing their positions, which means a weakening trend.