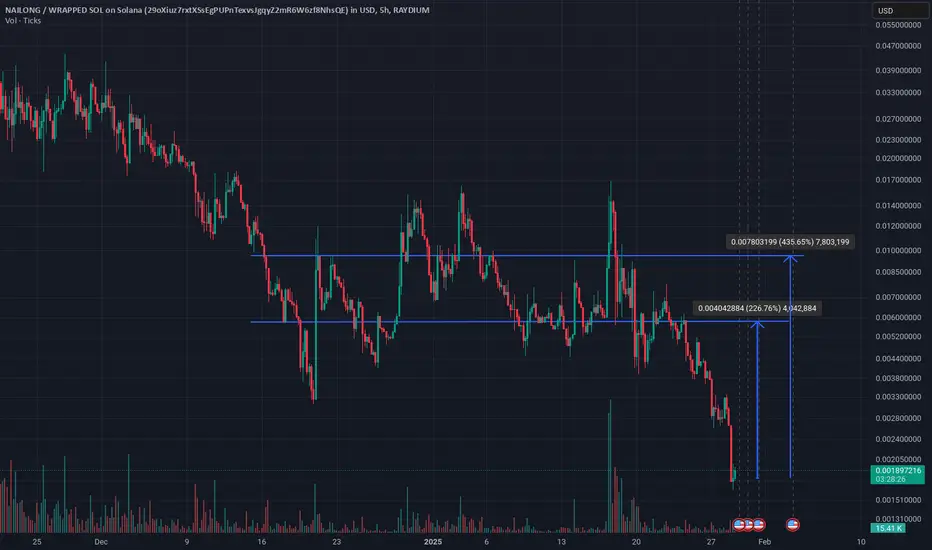
Nailong on Sol token chart analysis📍 4H Chart Analysis
NAILONG pulling back hard after a major pump — price currently testing ascending trendline + demand zone.
🔹 Key Zones:
✅ Strong Low marked — historically respected support
🟥 Supply Zone above — possible rejection if we bounce
🧭 Structure Breakdown:
CHoCH + BOS printed
RS
Key stats
Trading activity
Transactions 953
BuysSells
451502
Volume 199.03 KUSD
Buys volumeSells volume
105.21 K93.81 K
Traders 455
BuyersSellers
230225
Related DEX pairs

Summarizing what the indicators are suggesting.
Oscillators
Neutral
SellBuy
Strong sellStrong buy
Strong sellSellNeutralBuyStrong buy
Oscillators
Neutral
SellBuy
Strong sellStrong buy
Strong sellSellNeutralBuyStrong buy
Summary
Neutral
SellBuy
Strong sellStrong buy
Strong sellSellNeutralBuyStrong buy
Summary
Neutral
SellBuy
Strong sellStrong buy
Strong sellSellNeutralBuyStrong buy
Summary
Neutral
SellBuy
Strong sellStrong buy
Strong sellSellNeutralBuyStrong buy
Moving Averages
Neutral
SellBuy
Strong sellStrong buy
Strong sellSellNeutralBuyStrong buy
Moving Averages
Neutral
SellBuy
Strong sellStrong buy
Strong sellSellNeutralBuyStrong buy