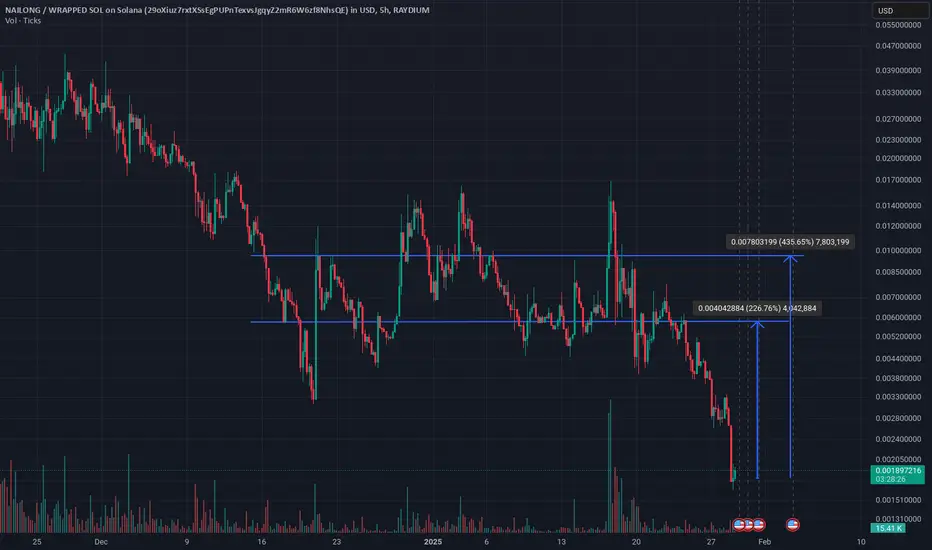
Nailong on Sol token chart analysis📍 4H Chart Analysis
NAILONG pulling back hard after a major pump — price currently testing ascending trendline + demand zone.
🔹 Key Zones:
✅ Strong Low marked — historically respected support
🟥 Supply Zone above — possible rejection if we bounce
🧭 Structure Breakdown:
CHoCH + BOS printed
RSI nearing bullish divergence territory
RSI at 39 and holding green support line = potential bounce?
---
🧪 Scenarios:
1. 🟢 Bullish: Bounce from trendline ➡️ reclaim BOS zone ➡️ 0.0030-0.0040 targets
2. 🔴 Bearish: Break below Strong Low ➡️ deeper retrace to pre-pump liquidity zone
---
🎯 Watching For:
Clean 4H bullish candle + RSI cross above MA
Reclaiming previous CHoCH zone for confirmation
---
Chart Like a Whale 🐋 Not a Shrimp 🦐.
#NAILONG #SmartMoney #RSIDivergence #CHoCH #BOS #CryptoAnalysis #TradingViewIdeas #Altcoins #TrendlineBounce