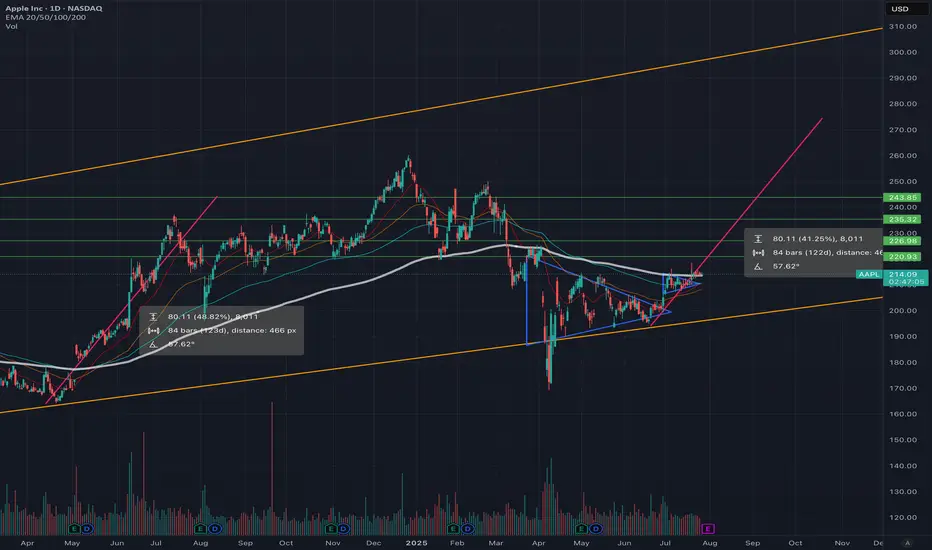
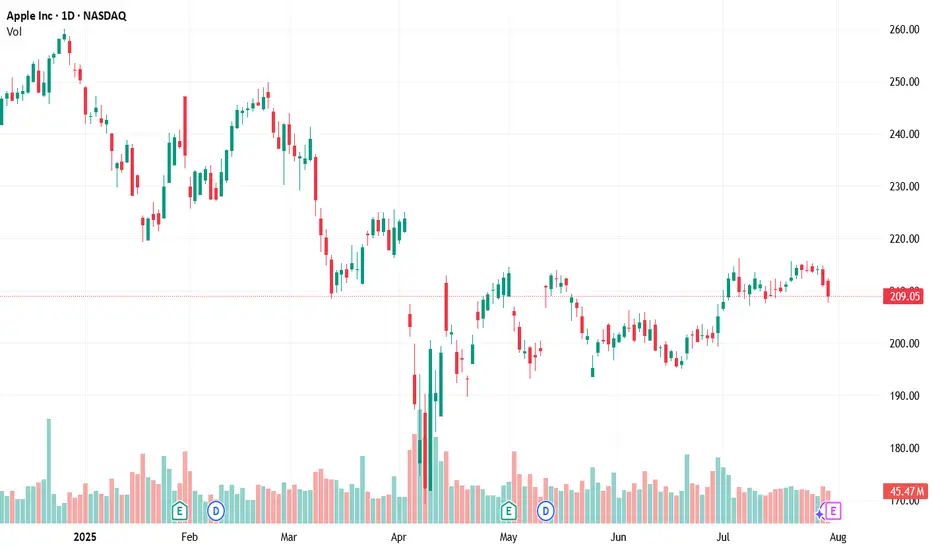
Time to buy? Too much negative press. Buy in Fear- Updated 28/7Apple has been making steady gains since April 8th. Trading volume has been consistently strong, increasing intermittently, with sell pressure exhausted at the 200 USD mark. The price point is now sitting above the 200 daily EMA support, which indicates strong potential for continued upward movement
Key facts today
Next report date
—
Report period
—
EPS estimate
—
Revenue estimate
—
6.44 USD
93.74 B USD
391.04 B USD
14.92 B
About Apple Inc
Sector
Industry
CEO
Timothy Donald Cook
Website
Headquarters
Cupertino
Founded
1976
FIGI
BBG000B9XRY4
Apple, Inc engages in the design, manufacture, and sale of smartphones, personal computers, tablets, wearables and accessories, and other variety of related services. It operates through the following geographical segments: Americas, Europe, Greater China, Japan, and Rest of Asia Pacific. The Americas segment includes North and South America. The Europe segment consists of European countries, as well as India, the Middle East, and Africa. The Greater China segment comprises of China, Hong Kong, and Taiwan. The Rest of Asia Pacific segment includes Australia and Asian countries. Its products and services include iPhone, Mac, iPad, AirPods, Apple TV, Apple Watch, Beats products, Apple Care, iCloud, digital content stores, streaming, and licensing services. The company was founded by Steven Paul Jobs, Ronald Gerald Wayne, and Stephen G. Wozniak in 1976 and is headquartered in Cupertino, CA.
Related stocks
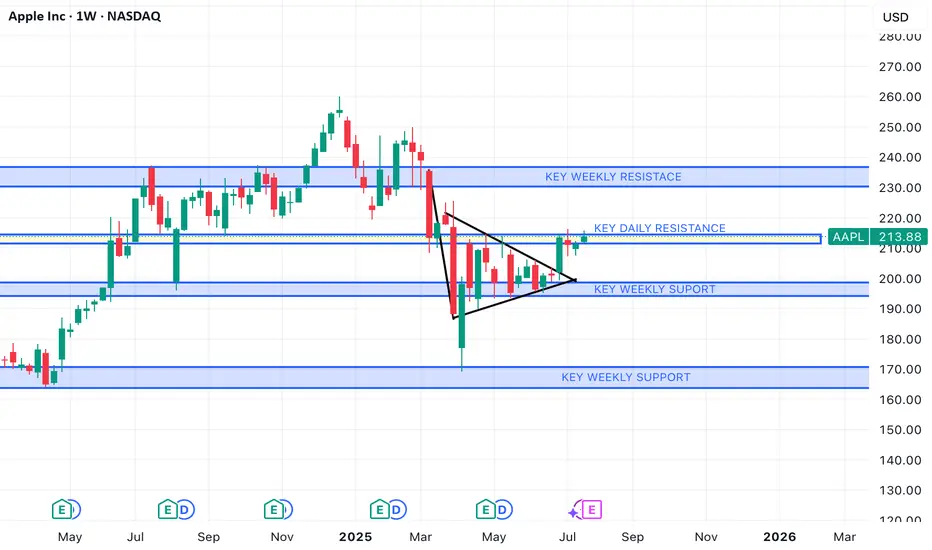
AAPL/SPY ratio + AAPL Weekly Triangle TradeIn this video I cover the weekly Triangle pattern, with explaining my current trade and what moves I am prepared for. I also cover the AAPL/SPY ratio chart and why this may be useful when trading AAPL.

AAPL BUY 1st target $223AAPL is forming a wedge and been lagging for 2 years. I was expecting $182 but we never saw that level, after weeks of $200 range consolidation it's clear this is basing, first target of resistance is $223 then we could be off to the races. I would expect to see this as soon as next week provided
Apple (AAPL) Shares Jump Following Earnings ReportApple (AAPL) Shares Jump Following Earnings Report
Yesterday, after the close of the regular trading session, Apple released its earnings report, which surpassed analysts’ expectations:
→ Earnings per share: actual = $1.57, forecast = $1.43;
→ Revenue: actual = $94.04 billion, forecast = $89.35
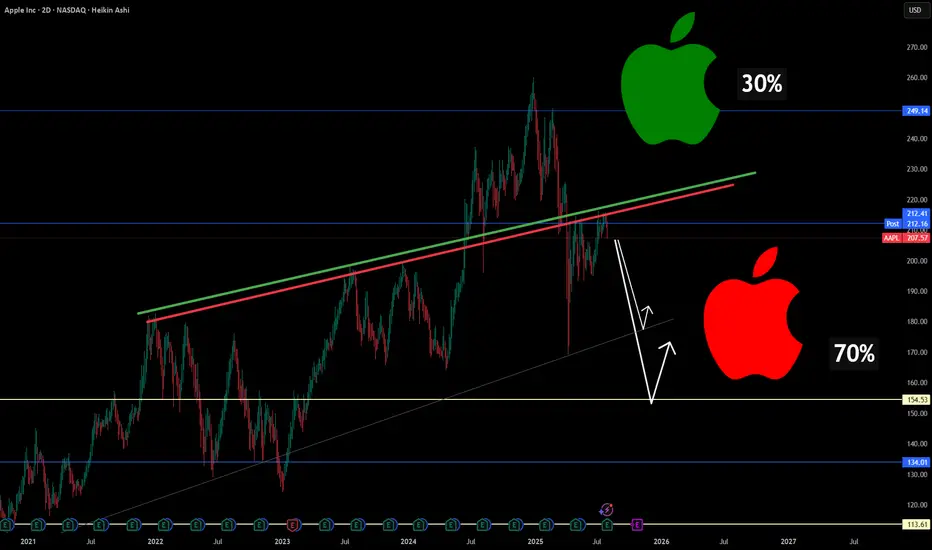
Why Apple Could Be Entering a Structural Correction🍎📉 Why Apple Could Be Entering a Structural Correction ⚠️🔍
After scanning major tech names today, one stock stood out— for all the wrong reasons : NASDAQ:AAPL .
Technically, Apple has broken below long-standing trendline support , and my chart now assigns a 70% probability(roughly guys...rough
Live data chart
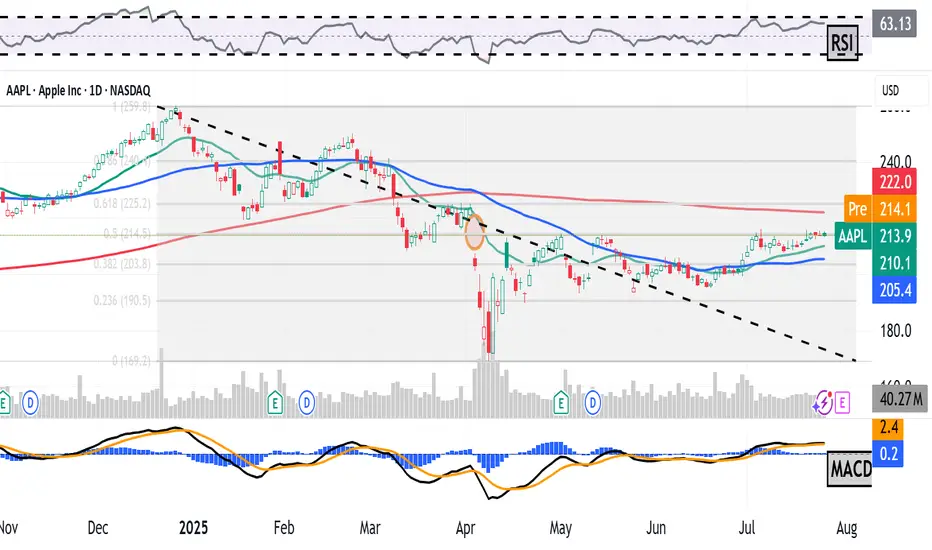
A technical analysis summary (moving averages, RSI, MACD, etc.)
A fundamental snapshot of Apple (revenue, EPS, P/E)
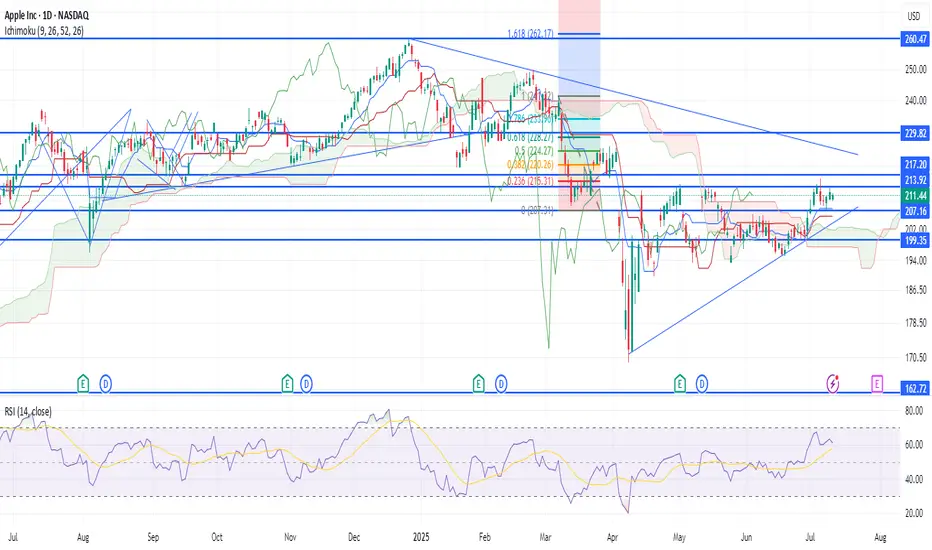
Apple - The next major push higher!🍎Apple ( NASDAQ:AAPL ) will head for new highs:
🔎Analysis summary :
Apple has been underperforming markets for a couple of months lately. However technicals still remain very bullish, indicating an inherent and substantial move higher soon. All we need now is bullish confirmation and proper ri

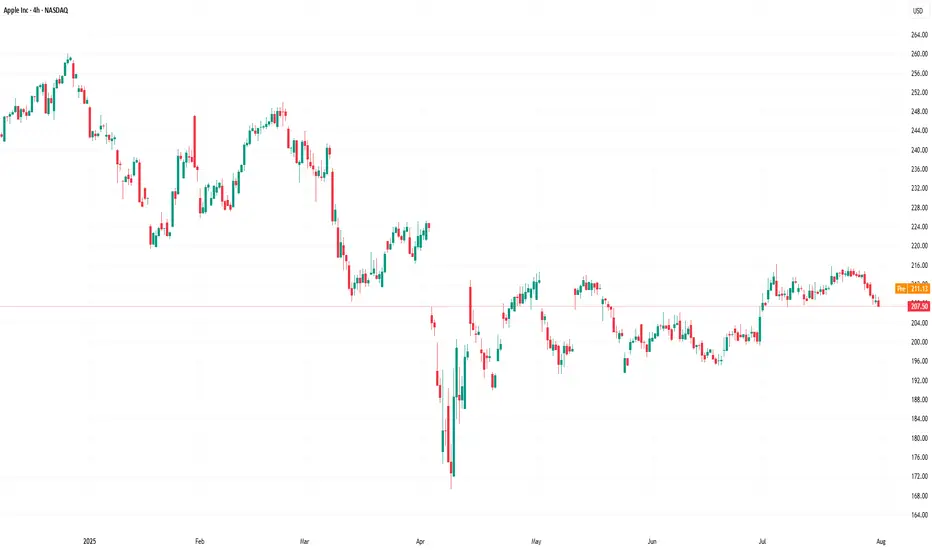
Apple Is Down YTD Ahead of Earnings. What Does Its Chart Say?Apple NASDAQ:AAPL will report earnings Thursday at a time when the tech giant has been struggling more than most other "Magnificent Seven" stocks or higher-end, AI-focused companies. What does fundamental and technical analysis say about AAPL heading into the report?
Let's see:
Apple's Fundamen
AAPL HEADING INTO AUG 25'AAPL TOPPED @ 250-260 TO CLOSE OUT 24
BAD Q1
Consistent since then.
Consolidation happened @ key weekly support $194-198 range, solid move up after.
Long Apple currently.
They have the IPHONE 17 releasing in Sept with a few new colors and new back design as well as other affordable options to
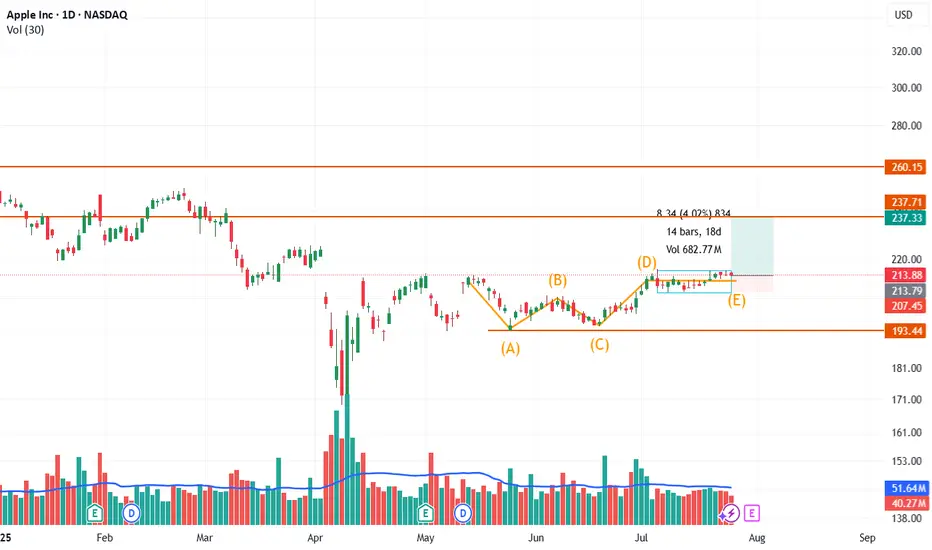
Apple Inc. (NASDAQ: AAPL) – Potential Breakout from Bullish ABCDApple has recently formed a well-structured ABCDE corrective pattern inside a broader sideways range, suggesting accumulation and possible trend continuation on breakout.
Technical Breakdown:
🔸 ABCDE Formation: The structure resembles a contracting triangle or bullish consolidation, marked by highe
See all ideas
Summarizing what the indicators are suggesting.
Neutral
SellBuy
Strong sellStrong buy
Strong sellSellNeutralBuyStrong buy
Neutral
SellBuy
Strong sellStrong buy
Strong sellSellNeutralBuyStrong buy
Neutral
SellBuy
Strong sellStrong buy
Strong sellSellNeutralBuyStrong buy
An aggregate view of professional's ratings.
Neutral
SellBuy
Strong sellStrong buy
Strong sellSellNeutralBuyStrong buy
Neutral
SellBuy
Strong sellStrong buy
Strong sellSellNeutralBuyStrong buy
Neutral
SellBuy
Strong sellStrong buy
Strong sellSellNeutralBuyStrong buy
Displays a symbol's price movements over previous years to identify recurring trends.
US37833DZ0
APPLE 20/50Yield to maturity
6.88%
Maturity date
Aug 20, 2050
US37833EF3
APPLE 21/51Yield to maturity
6.81%
Maturity date
Feb 8, 2051
US37833EG1
APPLE 21/61Yield to maturity
6.81%
Maturity date
Feb 8, 2061
US37833EL0
APPLE 21/61Yield to maturity
6.77%
Maturity date
Aug 5, 2061
US37833DW7
APPLE 20/50Yield to maturity
6.77%
Maturity date
May 11, 2050
US37833EK2
APPLE 21/51Yield to maturity
6.75%
Maturity date
Aug 5, 2051
US37833EA4
APPLE 20/60Yield to maturity
6.66%
Maturity date
Aug 20, 2060
US37833DQ0
APPLE 19/49Yield to maturity
6.52%
Maturity date
Sep 11, 2049
US37833EE6
APPLE 21/41Yield to maturity
6.18%
Maturity date
Feb 8, 2041
US37833DD9
APPLE 17/47Yield to maturity
5.95%
Maturity date
Sep 12, 2047
US37833BA7
APPLE 15/45Yield to maturity
5.94%
Maturity date
Feb 9, 2045
See all AAPL bonds
Curated watchlists where AAPL is featured.


Frequently Asked Questions
The current price of AAPL is 202.38 USD — it has decreased by −0.71% in the past 24 hours. Watch Apple Inc stock price performance more closely on the chart.
Depending on the exchange, the stock ticker may vary. For instance, on NASDAQ exchange Apple Inc stocks are traded under the ticker AAPL.
AAPL stock has fallen by −2.96% compared to the previous week, the month change is a 0.44% rise, over the last year Apple Inc has showed a −9.80% decrease.
We've gathered analysts' opinions on Apple Inc future price: according to them, AAPL price has a max estimate of 275.00 USD and a min estimate of 139.00 USD. Watch AAPL chart and read a more detailed Apple Inc stock forecast: see what analysts think of Apple Inc and suggest that you do with its stocks.
AAPL reached its all-time high on Dec 26, 2024 with the price of 260.10 USD, and its all-time low was 0.05 USD and was reached on Jul 8, 1982. View more price dynamics on AAPL chart.
See other stocks reaching their highest and lowest prices.
See other stocks reaching their highest and lowest prices.
AAPL stock is 6.00% volatile and has beta coefficient of 1.02. Track Apple Inc stock price on the chart and check out the list of the most volatile stocks — is Apple Inc there?
Today Apple Inc has the market capitalization of 3.10 T, it has decreased by −1.06% over the last week.
Yes, you can track Apple Inc financials in yearly and quarterly reports right on TradingView.
Apple Inc is going to release the next earnings report on Oct 23, 2025. Keep track of upcoming events with our Earnings Calendar.
AAPL earnings for the last quarter are 1.57 USD per share, whereas the estimation was 1.44 USD resulting in a 9.18% surprise. The estimated earnings for the next quarter are 1.72 USD per share. See more details about Apple Inc earnings.
Apple Inc revenue for the last quarter amounts to 94.04 B USD, despite the estimated figure of 89.56 B USD. In the next quarter, revenue is expected to reach 99.93 B USD.
AAPL net income for the last quarter is 23.43 B USD, while the quarter before that showed 24.78 B USD of net income which accounts for −5.43% change. Track more Apple Inc financial stats to get the full picture.
Yes, AAPL dividends are paid quarterly. The last dividend per share was 0.26 USD. As of today, Dividend Yield (TTM)% is 0.49%. Tracking Apple Inc dividends might help you take more informed decisions.
Apple Inc dividend yield was 0.43% in 2024, and payout ratio reached 16.11%. The year before the numbers were 0.55% and 15.32% correspondingly. See high-dividend stocks and find more opportunities for your portfolio.
As of Aug 2, 2025, the company has 164 K employees. See our rating of the largest employees — is Apple Inc on this list?
EBITDA measures a company's operating performance, its growth signifies an improvement in the efficiency of a company. Apple Inc EBITDA is 141.70 B USD, and current EBITDA margin is 34.44%. See more stats in Apple Inc financial statements.
Like other stocks, AAPL shares are traded on stock exchanges, e.g. Nasdaq, Nyse, Euronext, and the easiest way to buy them is through an online stock broker. To do this, you need to open an account and follow a broker's procedures, then start trading. You can trade Apple Inc stock right from TradingView charts — choose your broker and connect to your account.
Investing in stocks requires a comprehensive research: you should carefully study all the available data, e.g. company's financials, related news, and its technical analysis. So Apple Inc technincal analysis shows the strong sell today, and its 1 week rating is sell. Since market conditions are prone to changes, it's worth looking a bit further into the future — according to the 1 month rating Apple Inc stock shows the buy signal. See more of Apple Inc technicals for a more comprehensive analysis.
If you're still not sure, try looking for inspiration in our curated watchlists.
If you're still not sure, try looking for inspiration in our curated watchlists.