Apple Is Down YTD Ahead of Earnings. What Does Its Chart Say?Apple NASDAQ:AAPL will report earnings Thursday at a time when the tech giant has been struggling more than most other "Magnificent Seven" stocks or higher-end, AI-focused companies. What does fundamental and technical analysis say about AAPL heading into the report?
Let's see:
Apple's Fundamental Analysis
Apple was down 14.4% year to date as of Friday's close, while the S&P 500 was up 8.6%.
Meanwhile, fellow Mag-7 members Nvidia NASDAQ:NVDA and Microsoft NASDAQ:MSFT -- the only publicly traded U.S. companies other than Apple with more than a $3 trillion market cap -- are up 29.2% and 21.9%, respectively.
AAPL has lagged largely because the consumer-electronics giant has dragged its feet on innovation, as well as on the great chase into the world of generative artificial intelligence.
Readers might recall that back in early May, Apple's board increased the firm's dividend payout and authorized a whopping $100 billion share-repurchase program in an attempt to attract investment. But so far, that hasn't seemed to impress Wall Street much.
As for Apple's upcoming fiscal Q3 earnings, the Street is looking for the company to post $1.42 a GAAP EPS of $1.42 on some $89 billion of revenue.
That would represent 1.4% earnings growth and 3.7% better revenues from the $1.40 EPS on $85.8 billion of revenues that the iPhone maker reported in the same period last year.
If this sounds like weak growth, it is. Apple saw 6% year-over-year growth during fiscal Q2 2025, as well as 4.9% in fiscal Q3 2024.
In fact, 20 of the 29 sell-side analysts that I found that cover AAPL lowered their earnings estimates lower for the fiscal Q3 since the period began. (Five have boosted their numbers, while four have made no changes.)
Apple's Technical Analysis
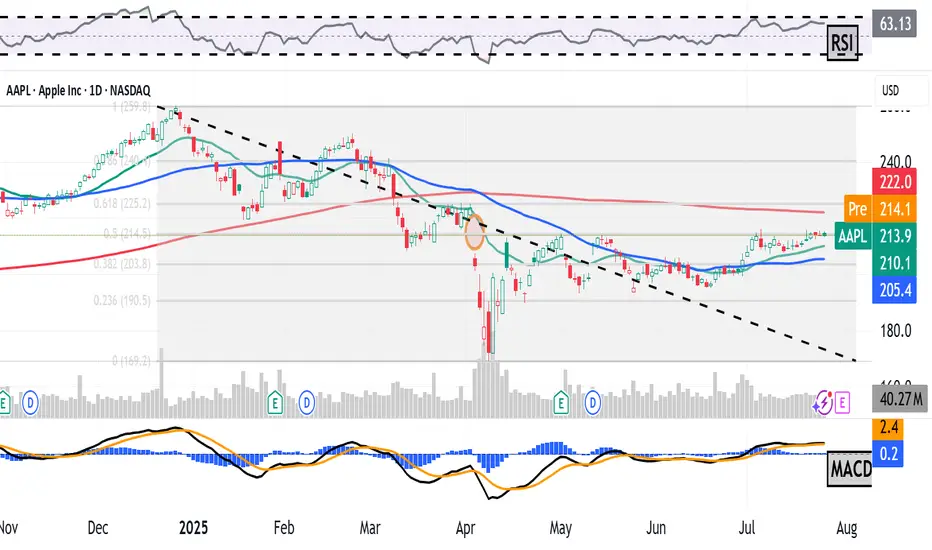
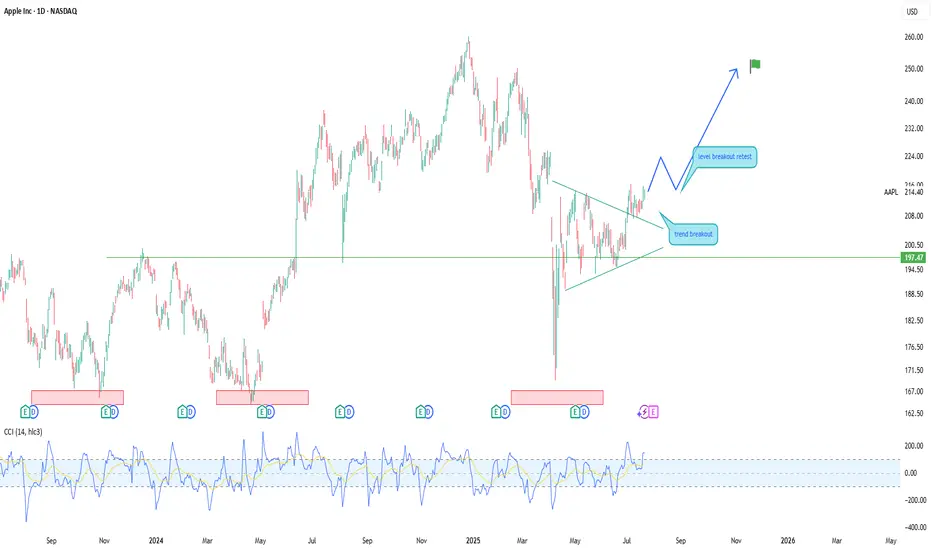
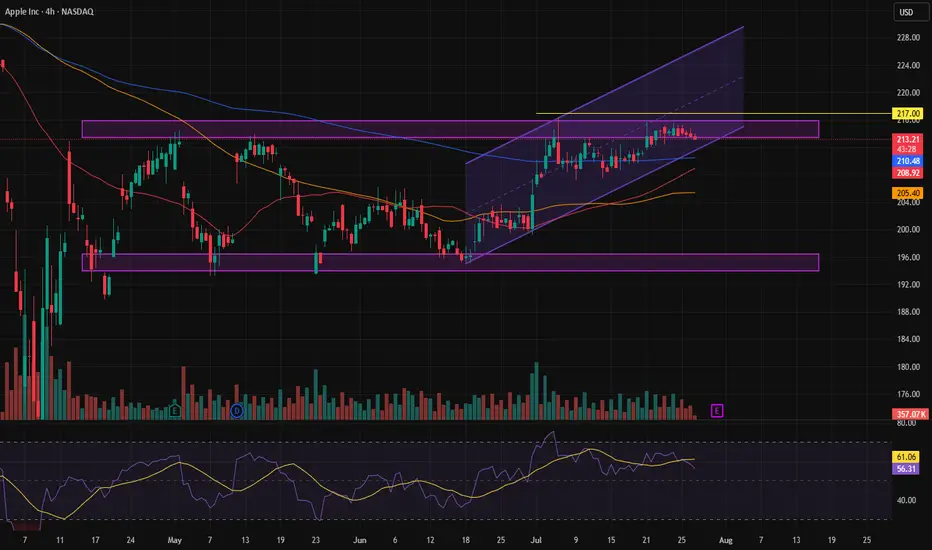
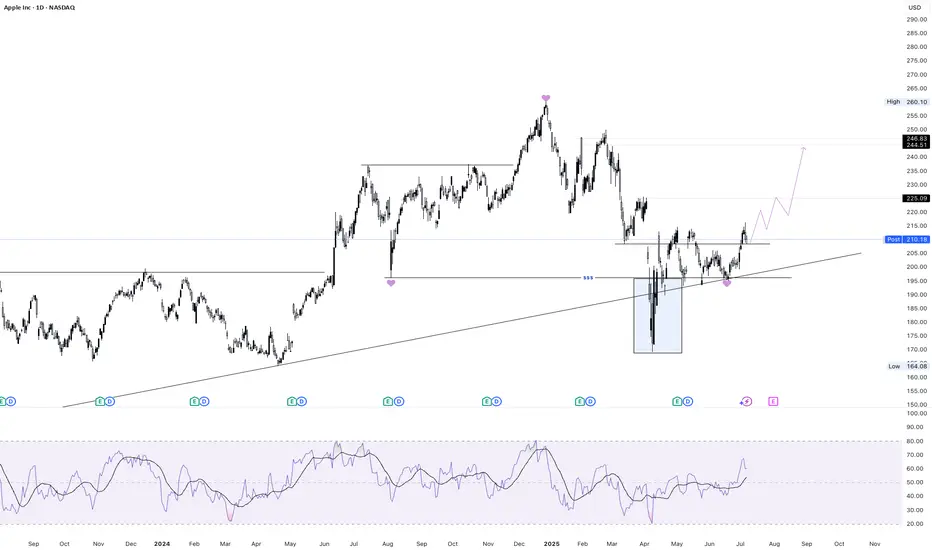
Now let's look at Apple's chart going back to November:
Readers will see that the stock appears to be at a crossroads.
On one hand, Apple developed a "triple-top" pattern of bearish reversal beginning in early May, as marked with red boxes at the above chart's right.
A triple top occurs when a "double-top" pattern fails and a stock retests its resistance from below for a third time.
However, we can see at the chart's extreme right that AAPL has just about reached its resistance level for a fourth time.
What now? Often when someone knocks on a door often enough, that door will open.
Perhaps even more interestingly, we can see that Apple's roughly $215 resistance level (vs. the $213.88 AAPL closed at Friday) appeared at almost precisely the 50% retracement point of the stock's December 2024-April 2025 sell-off.
Note that while they're included with most Fibonacci retracement models, 50% retracements aren't true Fibonacci levels. They are their own thing, but just as technically noteworthy.
All in, Apple now has two potential upside pivots.
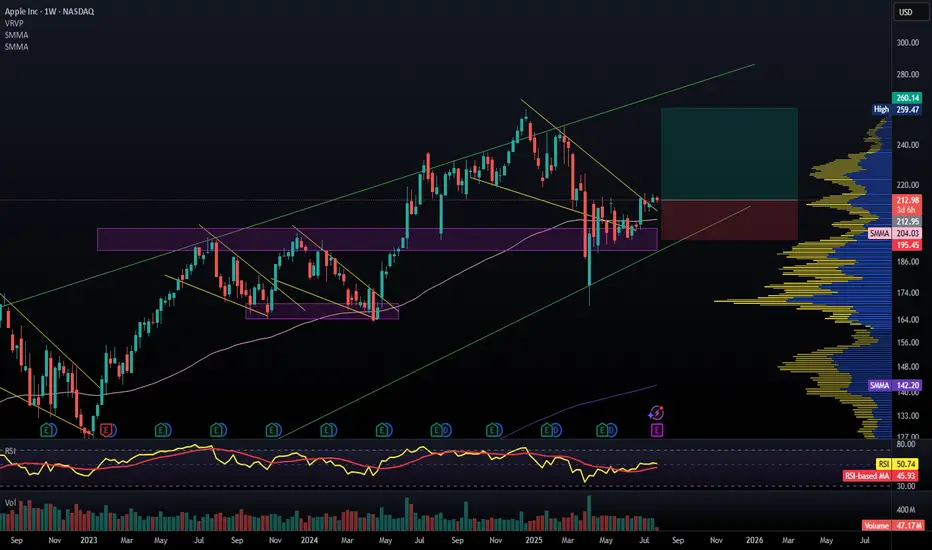
One would be the break above the apex of the pattern that's in place. The other would be Apple's 200-day Simple Moving Average (or "SMA," marked with a red line above.)
That creates a potentially bullish set-up. Apple could see support from both its 21-day Exponential Moving Average (or "EMA," denoted with a green line above) and from its 50-day SMA (the blue line above). That's likely where we'll find out if professional managers are willing to defend the stock.
Meanwhile, Apple's Relative Strength Index (or "RSI," marked with a gray line at the chart's top) is robust, but not in a technically overbought state.
Similarly, the stock's daily Moving Average Convergence Divergence indicator (or "MACD," denoted with black and gold lines and blue bars at the chart's bottom), has a bullish look to it, but not overwhelmingly so.
The histogram of Apple's 9-day EMA (the blue bars) is above zero, which is historically a short-term positive signal.
Additionally, both the 12-day EMA (black line) and 26-day EMA (gold line) are above zero, with the black line above the gold line. That's traditionally a short- to medium-term positive signal as well.
Still, it's what happens at that fourth top in the above chart that will likely decide Apple's fate technically.
(Moomoo Technologies Inc. Markets Commentator Stephen “Sarge” Guilfoyle had no position in AAPL at the time of writing this column.)
This article discusses technical analysis, other approaches, including fundamental analysis, may offer very different views. The examples provided are for illustrative purposes only and are not intended to be reflective of the results you can expect to achieve. Specific security charts used are for illustrative purposes only and are not a recommendation, offer to sell, or a solicitation of an offer to buy any security. Past investment performance does not indicate or guarantee future success. Returns will vary, and all investments carry risks, including loss of principal. This content is also not a research report and is not intended to serve as the basis for any investment decision. The information contained in this article does not purport to be a complete description of the securities, markets, or developments referred to in this material. Moomoo and its affiliates make no representation or warranty as to the article's adequacy, completeness, accuracy or timeliness for any particular purpose of the above content. Furthermore, there is no guarantee that any statements, estimates, price targets, opinions or forecasts provided herein will prove to be correct.
Moomoo is a financial information and trading app offered by Moomoo Technologies Inc. In the U.S., investment products and services on Moomoo are offered by Moomoo Financial Inc., Member FINRA/SIPC.
TradingView is an independent third party not affiliated with Moomoo Financial Inc., Moomoo Technologies Inc., or its affiliates. Moomoo Financial Inc. and its affiliates do not endorse, represent or warrant the completeness and accuracy of the data and information available on the TradingView platform and are not responsible for any services provided by the third-party platform.
AAPL trade ideas
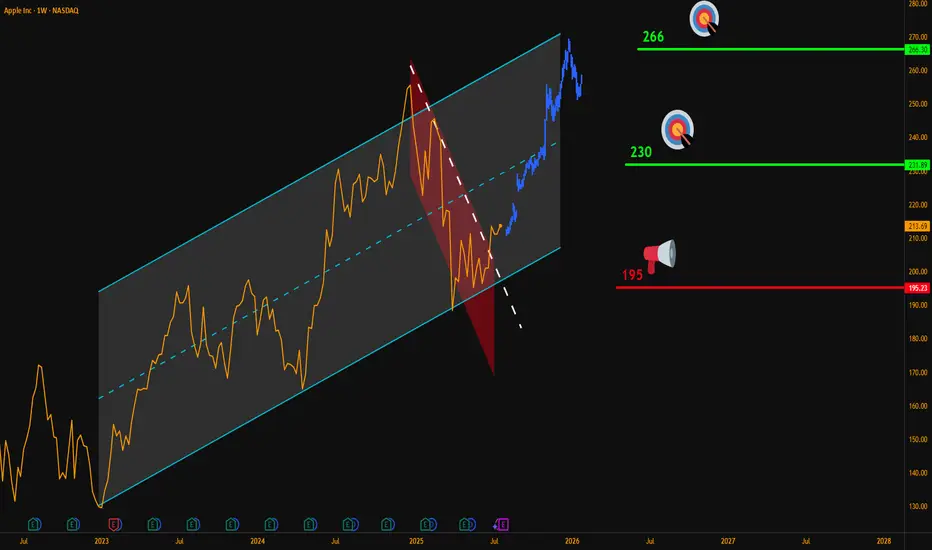
AAPL Weekly Breakout – Targeting $266Hello Traders,
Here’s my latest analysis on Apple (AAPL) based on the weekly chart.
🔍 Chart Breakdown:
Main Uptrend Channel (Blue): Price has respected this channel since 2023.
Red Downtrend Sub-Channel: Recent corrective phase is now broken.
Breakout Signal: Last week, AAPL closed above the sub-channel’s upper line, confirming bullish momentum.
📌 Updated Trade Setup Section:
Entry Zone: Around $215 (current price)
Stop-Loss: Weekly close below $195 (Risk = $20)
Targets:
✅ $230 (Reward = $15 → R:R = 0.75:1)
✅ $266 (Reward = $51 → R:R = 2.55:1)
Always confirm with your own strategy before entering a trade. Position sizing and risk control are key.
💬 Do you think AAPL can reach $266 before Q4 2025? Share your thoughts below!
NASDAQ:AAPL
AAPL HEADING INTO AUG 25'AAPL TOPPED @ 250-260 TO CLOSE OUT 24
BAD Q1
Consistent since then.
Consolidation happened @ key weekly support $194-198 range, solid move up after.
Long Apple currently.
They have the IPHONE 17 releasing in Sept with a few new colors and new back design as well as other affordable options to assist with consumer retention, entry and re entry into the apple hemisphere for consumers.
Earnings July 31st, currently expected to increase YOY for Q3.
I expect earnings to come in strong to assist with the move up to try and work back to retest ATH again.
Long back up to $247 range to close out 2025 for Apple. End of year Q3, Q4 is always their time to shine. Don't think we see a break of ATH in 2025 for Apple though. Retest, to come back down slightly again before major break.
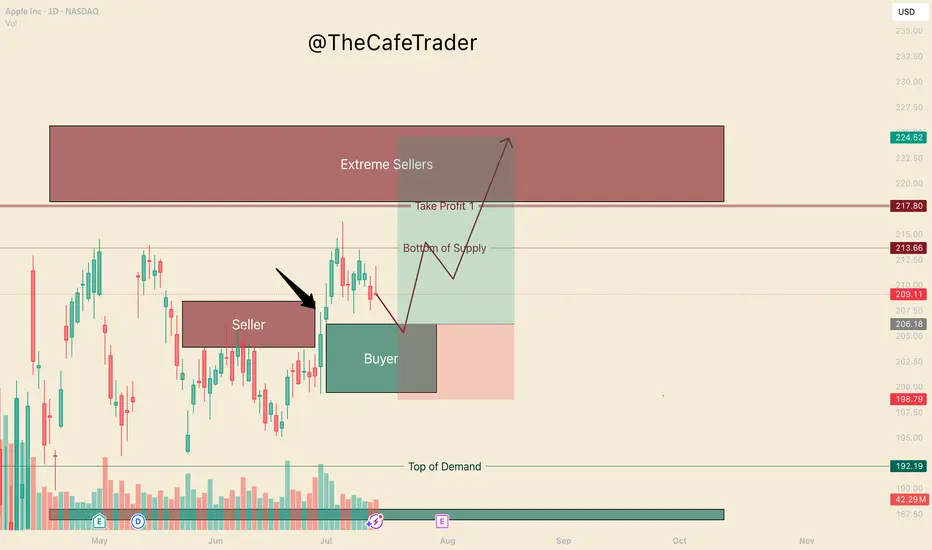
APPL. Bulls are in ControlHello, I’m TheCafeTrader.
This post is for technical traders looking to capitalize on short swings and options.
What you’re seeing here are supply and demand zones — areas where liquidity is concentrated. These levels are identified using a system built around footprint data, order flow, and market imbalances.
🔹 Key Observation:
I’ve marked a seller that price has now broken above. This tells us that buyers have overpowered a sell-side participant, and are now likely targeting deeper liquidity in the $218–$225 range.
🔹 On Apple’s Behavior:
Apple can be slow and choppy at times. So, if you’re trading options, consider going as close to the money as possible and give yourself some time on the contracts.
🔹 New Buyer in the Market:
Between $199–$206, a new aggressive buyer has stepped in. This player appears to be pressuring the first line of sellers (labeled “beginning of supply”).
🟢 My Expectation:
I expect AAPL to pull back to around $206 before catching a bid. As long as price holds above $199, buyers remain in control. In this range, I anticipate further accumulation by bulls.
🔸 Take Profit Levels:
• First TP: Just before the major selling cluster around $218
• Final TP: Deep inside the seller zone near $223
⸻
📊 Follow for more short-term analysis. This week, we’re covering both short- and long-term views of the MAG 7.
⸻
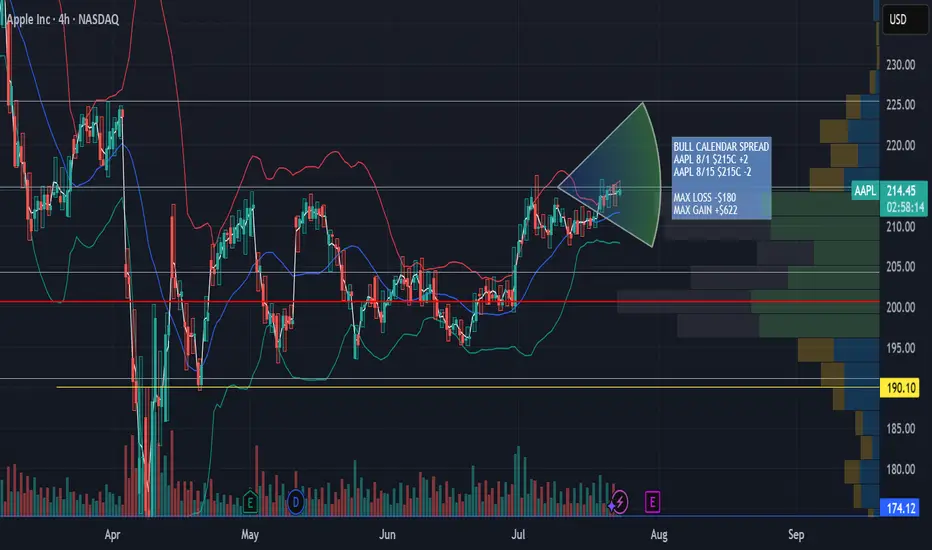
AAPL Aug 1st - Aug 8th 215 Calendar Call SpreadAAPL Aug 1st - Aug 8th 215 Calendar Call Spread
AAPL earnings after market close 7/31/25. Looking for an upward move into earnings with resistance at $225 then retesting support at $215. This zone falls between the .5 and .618 fib retracement. Great risk/ reward ratio 3.5:1
Magnificent 7 buy signalMagnificent 7 buy signal. These stocks are trading above their moving averages on 3 hour candle chart which is bullish. This basket made on tradingview consists of the 7 stocks.
Right now there is break through the resistance level and further upside is expected.

Time to buy? Too much negative press. Buy in Fear- Updated 18/7Apple has significantly underperformed compared to the other Magnificent 7 stocks, but I don’t believe it’s a company you should bet against in the current climate. With a slow rollout of AI and recent statements from Apple, they may not always be first to market, but they generally execute well. The remarks regarding Sony, Samsung, and Netflix by Apple were very revealing and demonstrate a solid long-term strategy. However, there may be some bumps along the way as they work toward their goals, potentially involving acquisitions.
The fear spread in the media is similar to the FUD (fear, uncertainty, doubt) often associated with Bitcoin, and this is typically a good time to buy. Remember the saying: if retail investors miss the boat, it’s gone, but if institutions miss it, they often bring the boat back.
While this is not financial advice, based on the green weekly candle, it's hard not to pay attention, and Apple may now have a very positive year ahead! Especially with the weakening dollar and reports stating that this will benefit them greatly.
Apple has been consolidating in the 210 USD region, forming a smaller flag pattern that is nearing completion. Based on this previous pattern, the next upward move is expected to reach >$220, where consolidation will likely begin again. With Apple’s earnings rapidly approaching and stronger-than-expected results anticipated, July and August could be very positive months for Apple holders.
A golden cross appears likely, with the 50-day EMA just $5.50 below the 200-day EMA. This would be very bullish for Apple and could trigger significant interest from both institutional and retail investors. Additionally, Apple has been lagging behind the other “Magnificent Seven” stocks, experiencing considerable selling pressure; however, this trend is now reversing. Apple is shaping up to be a good short-term and long-term hold.
Apple (AAPL) — Expected 20% GrowthThe fundamental outlook for Apple stock remains positive: the upcoming fall presentation and anticipated AI-related announcements are driving bullish sentiment.
Technical picture:
The price has broken through a key trendline, signaling a shift in momentum toward growth.
Near-term target: a move toward the 225.0 level.
Next step: a possible pullback to 214.0 for a retest of the support level.
Long-term scenario: after the correction, I expect a rise toward 250.0, which could bring approximately 20% growth within 1–2 months.
This growth potential may coincide with Apple’s upcoming earnings report and further AI news.
AAPL: 202.92Bullish Entry: Level: 206.00 / 208.00 Target 210.00 Stop 206.00 Bearish Entry: 200.00/198.00 Stop 201.00 Target 196.00

Apple Chart Fibonacci Analysis 080425Trading Idea
1) Find a FIBO slingshot
2) Check FIBO 61.80% level
3) Entry Point 203/61.80%
Chart time frame:B
A) 15 min(1W-3M)
B) 1 hr(3M-6M)
C) 4 hr(6M-1year)
D) 1 day(1-3years)
Stock progress:C
A) Keep rising over 61.80% resistance
B) 61.80% resistance
C) 61.80% support
D) Hit the bottom
E) Hit the top
Stocks rise as they rise from support and fall from resistance. Our goal is to find a low support point and enter. It can be referred to as buying at the pullback point. The pullback point can be found with a Fibonacci extension of 61.80%. This is a step to find entry level. 1) Find a triangle (Fibonacci Speed Fan Line) that connects the high (resistance) and low (support) points of the stock in progress, where it is continuously expressed as a Slingshot, 2) and create a Fibonacci extension level for the first rising wave from the start point of slingshot pattern.
When the current price goes over 61.80% level , that can be a good entry point, especially if the SMA 100 and 200 curves are gathered together at 61.80%, it is a very good entry point.
As a great help, tradingview provides these Fibonacci speed fan lines and extension levels with ease. So if you use the Fibonacci fan line, the extension level, and the SMA 100/200 curve well, you can find an entry point for the stock market. At least you have to enter at this low point to avoid trading failure, and if you are skilled at entering this low point, with fibonacci6180 technique, your reading skill to chart will be greatly improved.
If you want to do day trading, please set the time frame to 5 minutes or 15 minutes, and you will see many of the low point of rising stocks.
If want to prefer long term range trading, you can set the time frame to 1 hr or 1 day.

AAPL ShortBroader Market Structure (AAPL 1H):
The overall market structure on this 1-hour chart has shifted from a consolidation phase into a clear bearish trend. A Change of Character (CHoCH) occurred at $224.88, marking the breakdown of a key higher low and signaling the end of the previous bullish phase. This was followed by a Break of Structure (BOS) at lower levels, confirming bearish continuation. The structure now favors lower highs and lower lows, indicating a bearish directional bias.
Supply and Demand Analysis:
The supply zone near $224–228 is strong, as price dropped sharply from this area after a brief consolidation, showing aggressive selling and validating it as a significant resistance. Buyers previously stepped in around $194–196, creating a well-respected demand zone; price rallied with conviction from this level in the past, making it a strong base where buyers are likely to be active again.
Price Action Within Marked Region:
Price recently exited the upper consolidation range and is now moving impulsively lower toward the marked demand zone around $194–196. The rejection from supply was swift, and candles within the marked area show sustained bearish momentum with minimal bullish interruption. There is a clear lack of buying interest mid-structure, implying that price may continue descending into the demand zone.
Current Trade Bias & Outlook:
The bias remains bearish, with price likely to test the $194–196 demand area. Expect a potential short-term bounce once that zone is tagged. However, if buyers fail to hold this level, further downside toward $172–174 becomes plausible. An invalidation of this bearish outlook would occur if price reclaims and holds above $208, breaking the recent lower high.
Momentum & Candlestick Behavior:
Momentum favors sellers—price is printing strong bearish candles with minimal wicks, indicating conviction. No significant reversal patterns (like bullish engulfing or hammer candles) are visible yet, which supports continuation lower in the short term.

AAPL: 202.38Bullish Entry: 206.00 / 208.00 Stop 202.00 Bullish Target: 210.00 / 213.00
Bearish Entry: 200.00 / 198.00 Stop 202.00 Bearish Target: 196.00 / 194.00

Apple Short Trade ideaAfter the positive earning brought enough buyside liquidity to be taken i have executed this short trade idea on Friday with almost 3 RR #Apple #short #smc #smartmoney #liquidity #trader #ict #liquiditygrab

Apple Stock looking bearishThe positive earnings brought enough buyside liquidity to be taken by the short sellers and im having this almost 3 RR trade idea that I executed on Friday

Apple repeating pattern to ATHA pattern I've used multiple times with Apple, looks like the same setup as April 2024 earnings.
AAPL - A potential earnings rallyDoes not mean it has to straight up jump after earnings it also can shortly go into the opposite direction but the main direction is up for the moment

End of correction or a drop?In the long-term trend of Apple stock, we all know it's clearly bullish. However, it has been going through a correction for a while now, and signs are starting to suggest that the correction may be ending. Once a trigger is confirmed, we can consider trading this stock and going for a buy.
APPLE: Weak Market & Bearish Continuation
Looking at the chart of APPLE right now we are seeing some interesting price action on the lower timeframes. Thus a local move down seems to be quite likely.
Disclosure: I am part of Trade Nation's Influencer program and receive a monthly fee for using their TradingView charts in my analysis.
❤️ Please, support our work with like & comment! ❤️
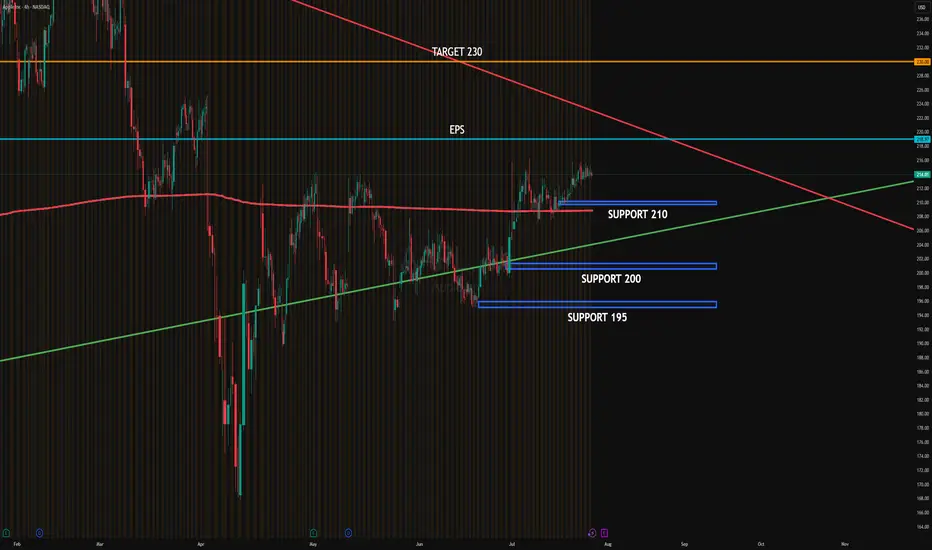
AAPL EARNINGSAAPL is consolidating just below the post-EPS resistance zone near 219, while institutions are actively defending support around 210. There's visible absorption at 210 and 205, aligning with high PUT interest, suggesting a strong institutional floor.
Distribution is evident in the 220–225 area, where CALLs are being sold to cap upside and benefit from theta decay.
Upside target: 230 if price breaks above 225 with volume.
Downside target: 200–195 if 210 fails to hold.
#AAPL #globaltrade #investment #investing #stockmarket #wealth #realestate #markets #economy #finance #money #forex #trading #price #business #currency #blockchain #crypto #cryptocurrency #airdrop #btc #ethereum #ico #altcoin #cryptonews #Bitcoin #ipo
Apple battles resistance area – Can Earnings Turn It Around?Shares in Apple Inc. (symbol ‘AAPL’) gained back a large percentage of the losses incurred at the beginning of the second quarter. The company’s earnings report for the fiscal quarter ending June 2025 is set to be released on Thursday, 31st of July, after market close. The consensus EPS is $1,42 compared to $1,40 of the same quarter last year.
2025 is a hard year for the company so far since it lost more than 17% of its share value. The recent minor bullish rally might give some hope for a positive overall result at the end of the year, but the price needs to rise above $260 to be considered a positive year, and the company is still far from this number. Also, the financial image of the company is not looking great with the current ratio at 0.82 as of 31 March 2025. This means that the company is not liquid enough to cover the short-term liabilities with the current assets at hand. The payout ratio (percentage of the total earnings of the company paid out as dividends) is at 15,74% indicating that the company is looking forward to keeping most of its earnings for economic growth/strength, which is a good sign for the overall performance of the company.
On the technical side, the price is testing the resistance area between the upper band of the Bollinger bands and the 50% of the weekly Fibonacci retracement level. The level of $212 is also an inside resistance area of price reaction in early May and early July, making it a strong technical resistance level. The Bollinger bands are quite expande,d showing that there is volatility to support big moves. The Stochastic oscillator is near the extreme overbought level, but it's not in there just yet. On the other hand, the moving averages are still validating an overall bearish trend in the market.

AAPL next leg up?A daily close above 213.75 could set AAPL to move towards 220
We are retesting some strong resistance at 215, and above it we could see price moving faster to retest trendline.
Keeping this on the watch as ERs is not far and we can see a pre run
Aapl long ideaNASDAQ:AAPL is on trendline support from March 2020 and has made a nice reversal. It looks good for a swing trade through August or September.
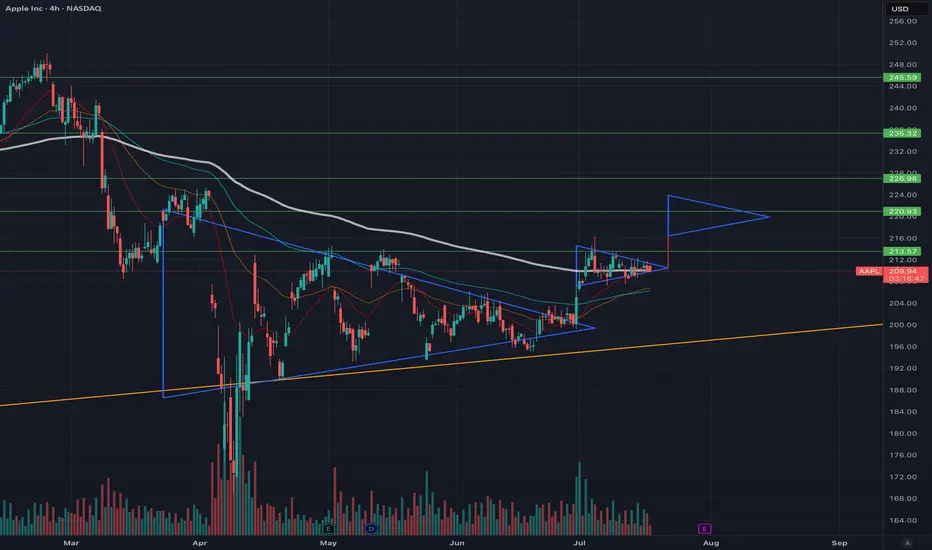
AAPL’s Pennant Breakout: Is $214.5 the Final Hurdle?Apple Inc. (AAPL) has been moving sideways since May, stuck in a tight trading range. It’s been following a classic rectangle pattern — showing that the market hasn’t quite made up its mind.
Today, AAPL finally broke out of a pennant pattern, giving traders a reason to look up. But the real test is still ahead: the stock is once again bumping into the $214.5 resistance level — the same spot where recent rallies have lost steam.
Apple’s P/E ratio is sitting at 33.2, which feels a bit stretched. That could explain why some investors are hesitating, waiting for stronger earnings or a new catalyst to justify higher prices.
If Apple can break above $214.5 with strong volume, it might kick off a new leg higher. Until then, the stock could keep drifting in this range. The breakout is promising — but not convincing just yet.
(Disclaimer : This is not financial advice. Always do your own research)
