AMD Explodes +9%! Will Momentum Continue or Fade? Jun 17AMD Explodes +9%! Will Momentum Continue or Fade into the Gamma Ceiling? 🧠
🧬 GEX Options Sentiment Breakdown:
* Key Gamma Zones:
* Gamma Wall / CALL Resistance: $125 – currently the pivot zone, also the NET GEX peak.
* CALL Walls:
* $128.12 → Local high, thin resistance.
* $130 → 2nd CALL Wall.
* $135 → Final ceiling (GEX9/10 cluster).
* PUT Walls:
* $114–$113 → Major PUT support and gamma flip danger zone.
* Below $114 could trigger accelerated dealer hedging to the downside.
* Options Metrics:
* IVR: 12.3 (low vol, potential expansion)
* IVx avg: 46.7
* Calls Flow: 47.2% — highly bullish options flow
* GEX Sentiment: 🟢🟢🟢🟢 (strong bullish tilt)
* Interpretation:
* AMD is parked at the Gamma Resistance Wall (GEX max zone) — further upside requires volume + broad strength.
* A rejection could push price back toward $120–123, which is also where gamma flips to neutral.
📉 15-Minute SMC Chart Breakdown:
* Current Price: $125.09
* Structure:
* Clean BOS (Break of Structure) from $116 → $128.
* Now experiencing CHoCH (Change of Character) at the supply zone, signaling possible short-term pullback.
* Price just tapped the supply zone and reversed; currently consolidating around the Gamma Wall.
* Trendline + Demand Zones:
* Strong ascending trendline holds above $120.
* Multiple demand zones from $117.8 → $115 (where volume initiated the breakout).
* Watch for retests of the gap zone (shaded FVGs) for bounce entries.
🧭 Trade Scenarios:
✅ Bullish Continuation Setup:
* Trigger: Break and hold above $128.12
* Target 1: $130 (2nd CALL Wall)
* Target 2: $135 (GEX9 cluster)
* Stop-loss: Below $124.50 (if fails to hold breakout)
This would confirm dealer chasing and continuation of the breakout move.
🚨 Bearish Reversal Setup:
* Trigger: Clean break below $124.00 and failure to reclaim
* Target 1: $120–$123 (gamma flip + support zone)
* Target 2: $117.80 → Demand box
* Stop-loss: Above $126.50
Ideal for short-term PUTs or premium fade. Watch for volume confirmation below supply.
🧠 My Thoughts:
* Strong move today, but now sitting at the gamma apex — could magnetize or reject hard.
* IV is still low (IVR 12), so options premiums may expand if volatility reenters.
* Volume surged on breakout — likely institution-backed. But if price fails to reclaim $126–$128, profit-taking could kick in.
* Stay nimble — this is not the ideal place to chase unless price cleanly reclaims highs.
📌 Conclusion:
AMD has printed a textbook breakout and is now testing the Gamma Wall at $125. If bulls reclaim $128+, the move to $130+ is on the table. Otherwise, expect a pullback toward $120–$123 as dealer positioning cools off.
Disclaimer: This analysis is for educational purposes only and does not constitute financial advice. Always trade with proper risk management.
AMD trade ideas

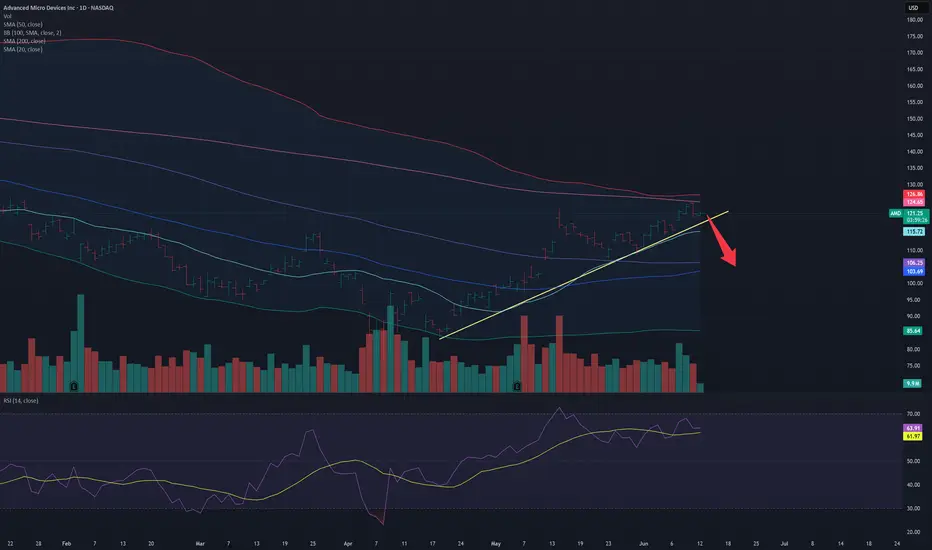
retrace to 105-110 likely after "Advancing AI" event wraps todayAMD has not had a significant retrace since the bottom on 4-21-2025 and is overdue for one.
AMD stock dropped ~4% after the previous "Advancing AI" event on 10-10-2024, and went into correction over a 2 week period following.
Note that AMD stock did not sustain positive momentum today after the Saudi Arabia cloud news, lending more weight to buyer exhaustion in the short term.
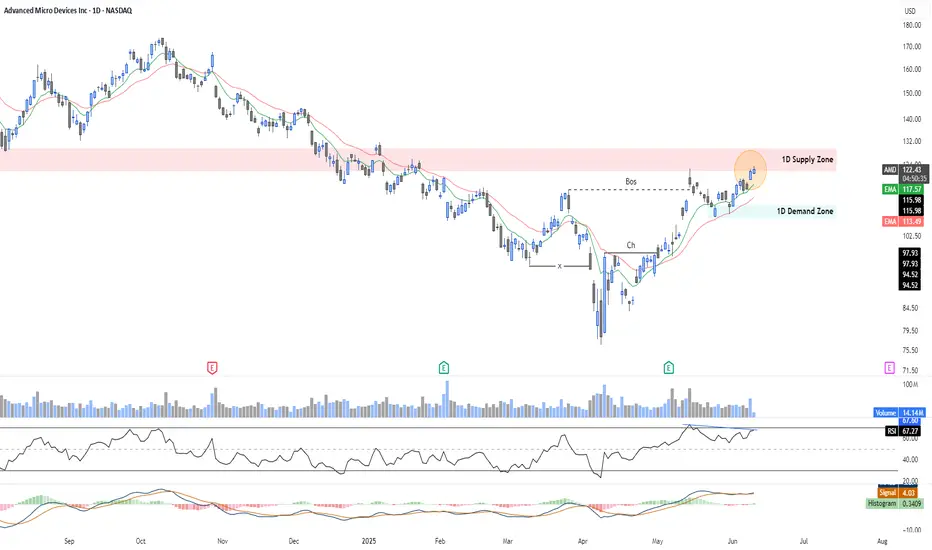
AMD Approaching Key Supply Zone – Rejection or Breakout?📌 Thesis:
AMD is approaching a critical 1D supply zone ($122–$130) with bearish RSI divergence, suggesting possible short-term exhaustion.
🔍 Technical Overview:
✅ Structure: Bullish recovery confirmed with Break of Structure (BoS).
📈 Price Action: Higher highs into known supply zone.
📉 RSI: Forming lower highs, showing classic bearish divergence — a common warning signal near key resistance.
🧭 MACD: Still positive, but momentum is slowing.
📊 Volume: Healthy, but not confirming a breakout (yet).
📌 Base Case (Bias):
Rejection from supply zone is likely, given weakening momentum. Watch for bearish reversal candles around $122–$130.
If rejection confirms:
🎯 First target: EMA cluster ($116).
🛑 Invalidation: Clean breakout above $130 with volume.
🔁 Alternate Scenario:
If AMD breaks and holds above $130, divergence is invalidated.
Next upside target: $140–$150 (previous resistance zone).
✅ Trade Plan:
🔹 Short setup: Bearish rejection + divergence confirmation at supply zone.
🔹 Long setup: Breakout + retest of supply zone turned support.
Conclusion:
This is a technical inflection point for AMD. Price action in the coming sessions will likely define the short-term direction. Trade the setup, not the prediction.

AMD: Short-term Upward PotentialAMD has continued to face downward pressure, preventing further progress in green wave . While this wave still has room to rise, its top should form below resistance at $141.16. Once wave completes, wave should follow—finishing the larger green impulse to the downside and completing the corrective structure of blue wave (II). This move is expected to conclude in our blue Long Target Zone between $62.82 and $35.19. That said, we continue to monitor a 30% alternative scenario: it suggests that wave alt.(II) has already bottomed at $76.12. In that case, AMD wouldn’t visit the blue zone but instead break out directly above the resistances at $141.16 and $174.98—marking the beginning of wave alt.(III).
📈 Over 190 precise analyses, clear entry points, and defined Target Zones - that's what we do.

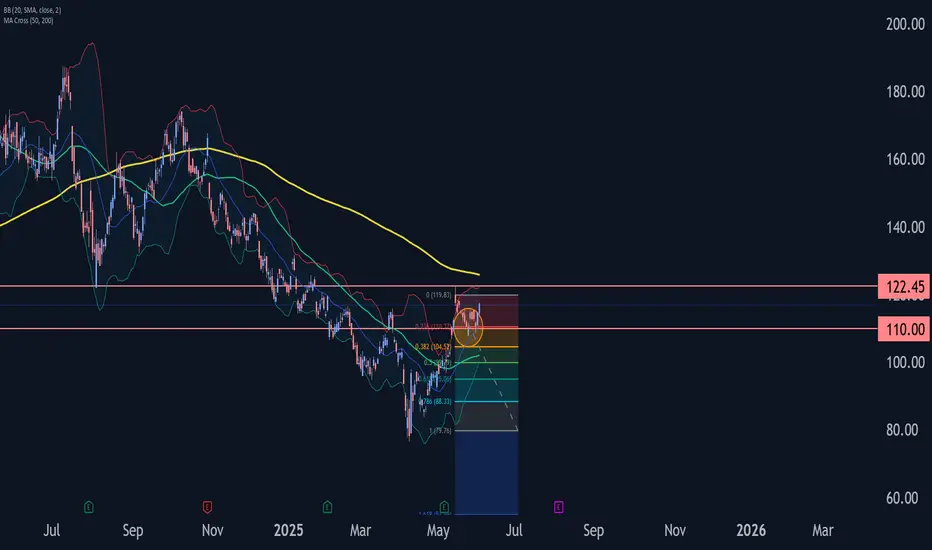
AMD Wave Analysis – 3 June 2025
- AMD reversed from the support zone
- Likely to rise to the resistance level 122.45
AMD recently reversed up from the support zone between the support level 110.00 (low of the previous correction (2)), the 20-day moving average and the 38.2.% Fibonacci correction of the upward impulse from April.
The upward reversal from this support zone started the active intermediate impulse wave (3).
AMD can be expected to rise to the next resistance level 122.45 (which stopped the earlier intermediate impulse wave (1) at the start of May).
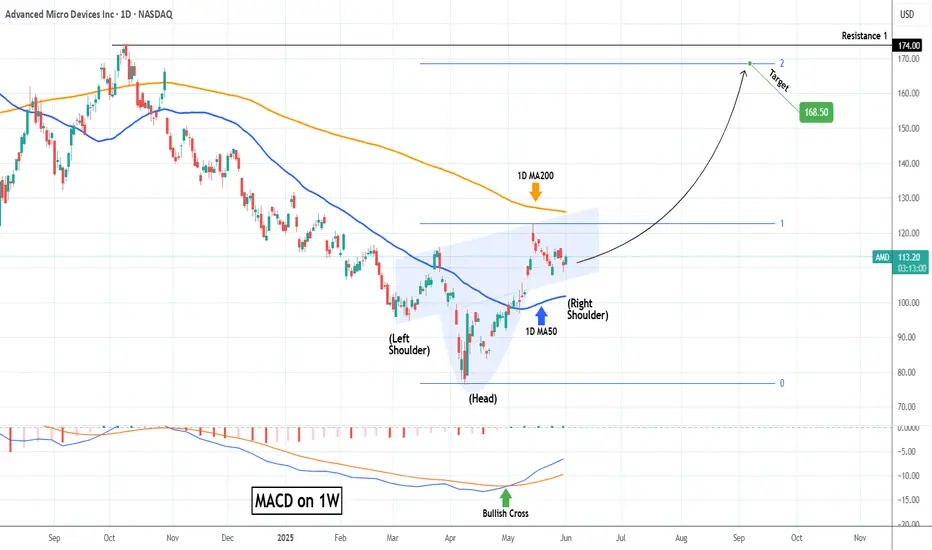
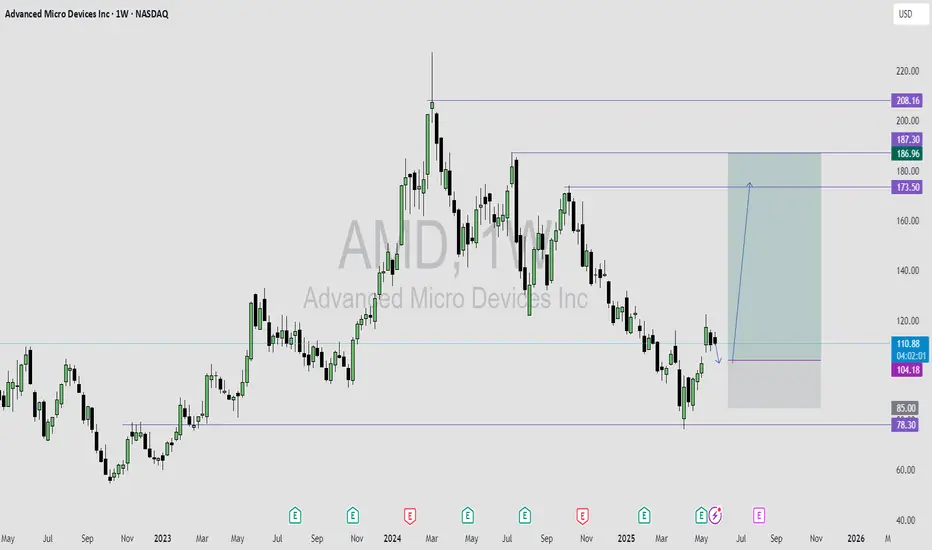
AMD Inverse Head and Shoulders waiting for massive break-out.Advanced Micro Devices (AMD) has entered a wide consolidation range within the 1D MA50 (blue trend-line) and 1D MA200 (orange trend-line) following the May 14 High. From a wider scale, this is technically seen as the Right Shoulder of an Inverse Head and Shoulders (IH&S) pattern.
This is generally a bullish reversal pattern and it is no coincidence that the Head was formed exactly on the market bottom (April 08). With the first long-term buy signal already given by the 1W MACD Bullish Cross, as long as the 1D MA50 holds, a break above the 1D MA200 would confirm the next rally phase.
Technically when the Right Shoulder break-outs take place, they target the pattern's 2.0 Fibonacci extension. That's now exactly at $168.50 and this is our medium-term Target.
-------------------------------------------------------------------------------
** Please LIKE 👍, FOLLOW ✅, SHARE 🙌 and COMMENT ✍ if you enjoy this idea! Also share your ideas and charts in the comments section below! This is best way to keep it relevant, support us, keep the content here free and allow the idea to reach as many people as possible. **
-------------------------------------------------------------------------------
💸💸💸💸💸💸
👇 👇 👇 👇 👇 👇
$AMD $120 retest then $130 push through. R/R looks incredible..Hello, NASDAQ:AMD Advanced Micro Devices, INC looks TASTY. I'm almost salivating. NASDAQ:NVDA may take a backseat and NASDAQ:AMD could start seeing monster upside. Something in my gut is telling me this name wants to GO. I'm looking at $120c for 6/20 and $130c for 6/20. This thing can launch.. it's hanging on an upside trendline, it may break but this $110 area may represent local support. Earnings report were good and after an abysmal 2024 after having highs and totally wiping them out hitting lows of $80, I think this could be the time for NASDAQ:AMD longs. It has taken the 20 day EMA/SMA over and now could curl to the 200 day EMA/SMA. 200 SMA is $126. This seems like a really good setup especially R/R here. Very cheap calls for a name that can see a 10-15% week.
WSL.
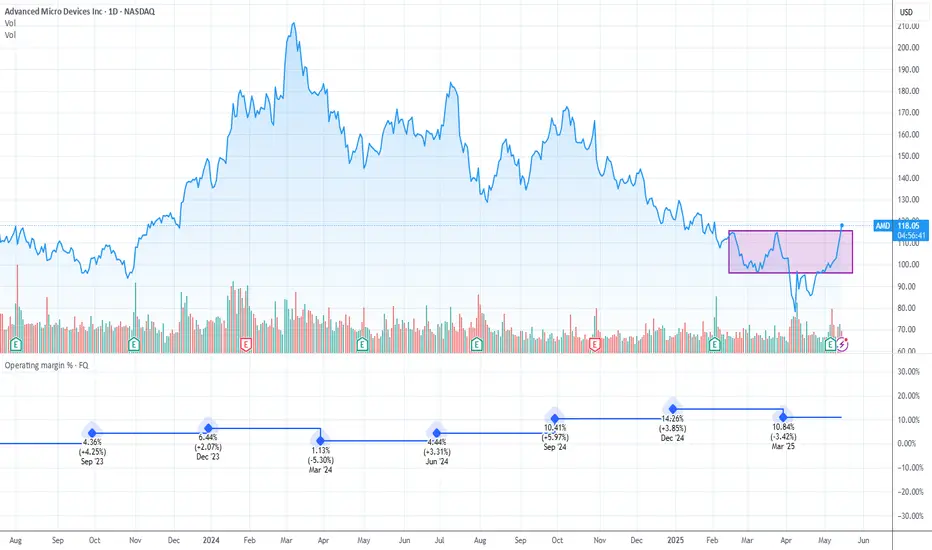
AMD breaking outAMD entered the 96 to 115 box like a rocket, and it is now showing a lot of strength after being dormant for a while.
The conditions are now there for a gradual run-up towards the 172 level. If it comes back below the 96 mark, I would argue that the movement has aborted.
$AMD When, not IF! 105% UPSIDENASDAQ:AMD - It's not a matter of if, but when...🚀
Once this downtrend on the weekly is broken out of with a big fat engulfing candle we will launch off this volume shelf like a SpaceX rocket to mars!
All indictors are curling up and I think the time is coming for AMD to make their ascent higher and back to ATHs!
AMD LONG IDEA: AMD IS READY FOR A GOOD BULLISH RUNAMD is bouncing off the monthly time frame key level that is acting as support for price.
On weekly time frame and daily we had a shift in market structure from bearish trend to bullish.
I will be buying AMD on this retracement to the recent weekly gap created by price.
Once I see a good bullish price confirming that the retracement is over, i will enter for a buy trade.
My overall target is the 187 price level.
AMD heads up at $120: Buyback news spiked into ResistanceAMD recovering well and buyback news spiked it today.
Currently testing a key resistance zone $119.79-120.23
Look for a Dip-to-Fib to Break-n-Retest for long entries.
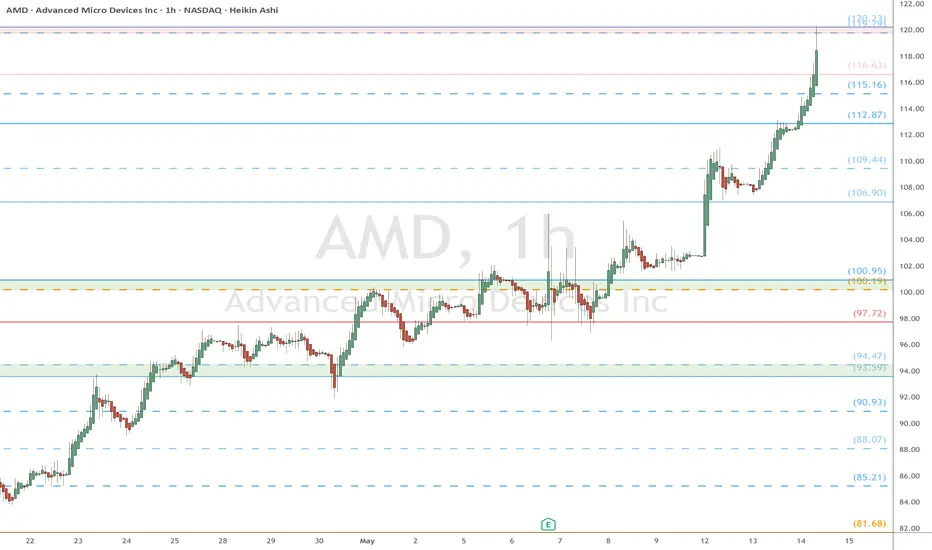
Quick View: $AMD-Strong bullish trend. on the 1h chart
- Bullish crossover on the dailly with pullback on the go
Watching $151 as key resistance.
Support → $106.50

Establishing Real-Time Price Action! 1). With Huge Wave 1, price typically will go to the previous high! 2). Buy corrective waves 2 & 4 Blue candles on smaller time frames! 3). Sell corrective waves ABC Black candles on smaller time frames! 3). Always use a FIB. tool for projections, based off a previous move! 4). Keep an eye on the gold line indicator, which is the liquidity provided by Banks for direction! 5). Check fundamentals, as Earnings were high, which pushes up price! 6). Establish a trend line based off the first two Candes! 7). Establish a relationship with Volume profile and Retail candles 8). Observe the multicolored Specialist line indicator, which reveals fair price! 9). Use this approach on any Instrument 10). Contact me for additional coaching!

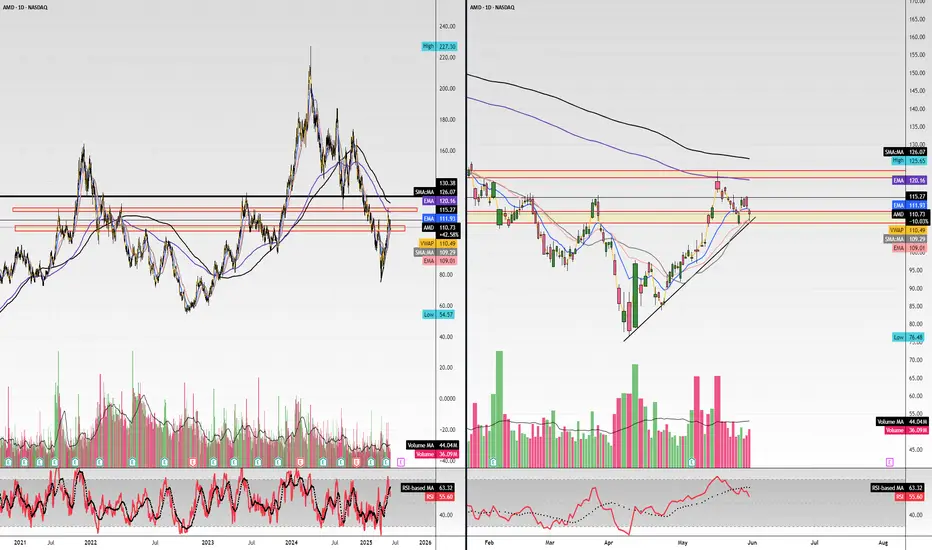
AMD: Short and Long Position IdeasThe current market structure indicates a potential bullish reversal within a broader descending channel. Following a previous decline of approximately 12.76% (−14.11 points), the price has staged a notable recovery, rallying 17.53% (+16.96 points) from a key horizontal support zone near 93.61. This area has historically acted as a demand zone, validating its significance with multiple touchpoints and a recent strong reaction.
Currently, the price action is approaching a critical resistance zone near 115.81, which also aligns closely with the upper boundary of the downward sloping blue channel. A sustained breakout above this resistance would constitute a technical breakout from the bearish structure and could signal a shift toward a medium-term bullish trend. In such a scenario, the next target would be the horizontal resistance zone around 120–122, supported by previous highs and structural confluence.
From a trade setup perspective, a long position could be considered on confirmation of a breakout and close above 115.81, with a target range of 120–122. A more conservative entry may be planned on a retest of the breakout level (115.81) as new support. Stop-loss levels could be strategically placed below the most recent higher low or the green support band near 105 to maintain a favourable risk-reward ratio. Conversely, failure to break above the resistance could trigger a reversion back to the mid-channel zone or retest of the 93.61 support level, favoring a range-bound or mean-reversion strategy in the short term.
Overall, the chart suggests a tactical bullish bias, contingent on breakout confirmation and broader market momentum.

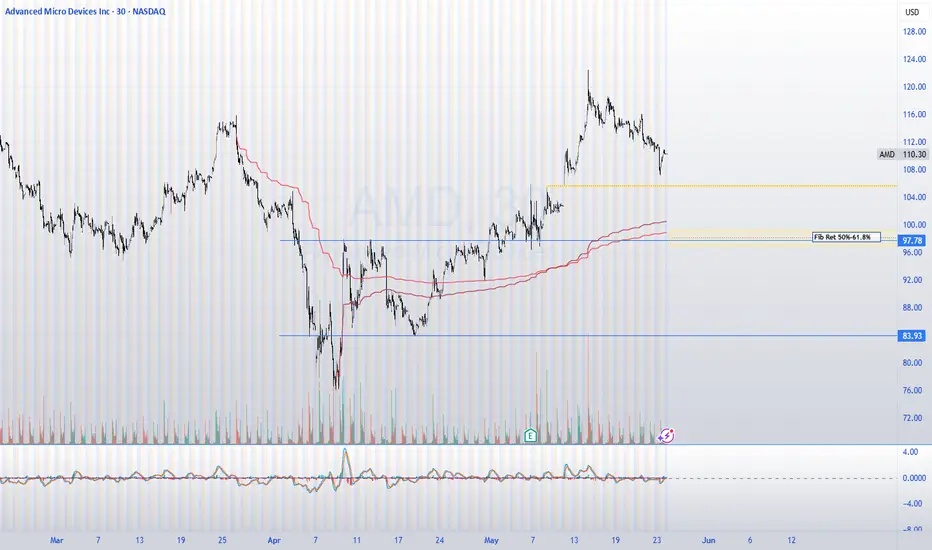
$AMDWatching NASDAQ:AMD closely tomorrow pre-market.
🔍 Key level: $105
✅ If it holds as support, expecting upside toward $112–$114 and possibly $120.
❌ If $105 fails, likely continuation of pullback toward the $100 area.
📐 That’s the 50%–61.8% Fib retracement zone — potential support for the next leg up.
Chart attached for visual reference.
#AMD #Stocks #Trading #TechnicalAnalysis #SupportResistance
AMD LONG IDEAAMD stock has been in a downtrend for a while. This is also confirmed with the awesome oscillator being in oversold region. However, there's a breakout of the downtrend. This is also supported with price breaking and closing above a support level. An aggressive trader or investor can buy at the current market price. While a conservative trader or investor can wait for price to pull back to the support level before buying.
The entry will be 101.70 while the stop will be 76.05 and the final target will be 226.77.
Confluence for this signal are as follows:
1. Awesome oscillator in oversold region
2. Awesome oscillator divergence
3. Downtrend breakout
4. Weekly bullish candle closing above down trend line and support level.
5. Price respecting uptrend
Disclaimer: This is not a financial advice. The outcome maybe different from the projection. If you can't accept the risk, don't take the signal.


AMD analysis What I’m seeing here is that the price made a false breakout below the 200 EMA, just like it did in the previous move back in early 2023. It dipped below, tricked a lot of people, then snapped back up strong.
Now it’s kind of repeating that same behavior another fake break below the 200 EMA and a bounce If history repeats we might see a similar upside move from here.
Just my personal view — not financial advice. Markets are unpredictable, so always be cautious.

AMD DAILY CHART NEEDS A WAVE 5 NORTH TO COMPLETE THE MOTIVE WAVECharts like the 27.8% Fib level even more than the 61.8 Golden Ratio! Also, the Bank Liquidity shown by the Golden line indicator is selling, so it's likely a market manipulation north on retail candles, creating a Bull-Trap on wave 5 before the drop! Since it's very risky at the moment to go Long, we're going Short at 127!

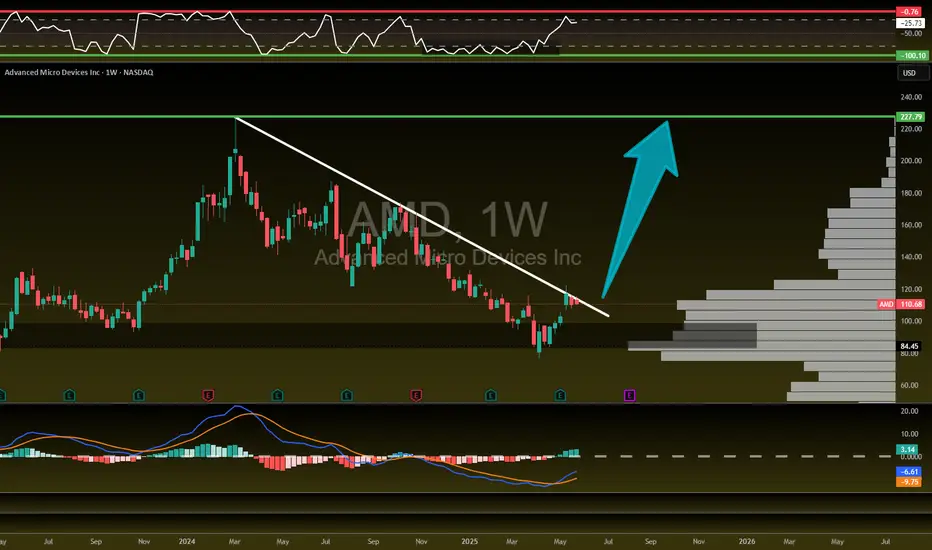
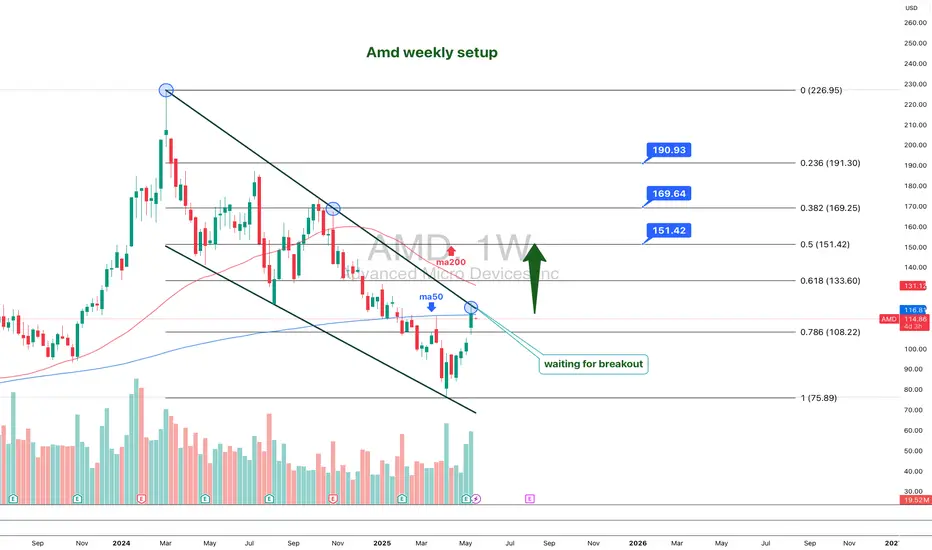
AMD 1W: If Not Now — Then When?The weekly chart of AMD looks like it’s holding its breath: a well-defined falling wedge, double bottom support, and price pressing right against long-term trendline resistance. Everything’s in place — now it just needs to break and run, preferably without tripping over nearby Fibonacci levels.
The stock is trading around $114 and attempting to hold above the 50-week MA. Just ahead is the 200-week MA (~131) — not only a technical hurdle but also a psychological pivot. A move above it could reignite talk of $150+ targets.
The wedge has been narrowing since late 2024. After repeated bounces off support, price has returned to the top of the pattern. A confirmed weekly close above the wedge could trigger a real breakout. Without that — it risks yet another scripted pullback.
Key Fibonacci levels:
0.618 — $133.60
0.5 — $151.42
0.382 — $169.25
0.236 — $191.30
0.0 — $226.95 (all-time high)
The roadmap looks clean — but only if volume follows through. There are signs of quiet accumulation at the bottom, but no explosive buying just yet.
Fundamentals:
AMD delivered solid Q1 results: revenue is growing, EPS beat expectations, and margins are holding. More importantly, the company launched a new $6 billion stock buyback program — showing clear internal confidence in its long-term trajectory.
There’s also a strategic AI partnership underway with a Middle Eastern tech group. This move positions AMD to challenge not just for GPU market share, but for future AI infrastructure dominance — long game stuff.
Analyst sentiment has turned bullish again, with new price targets in the $130–150 range. All of this makes the current chart structure more than just technical noise — it’s backed by strong tailwinds.
AMD Shorts?Already out of the intraday positions. Looking at this for possible short opportunity. The technicals are there to support the setup even though indices are bullish. Risk free on this trade and will take partials along the way, doesn't need to hit full TP. Indices retracements can favor this trade.
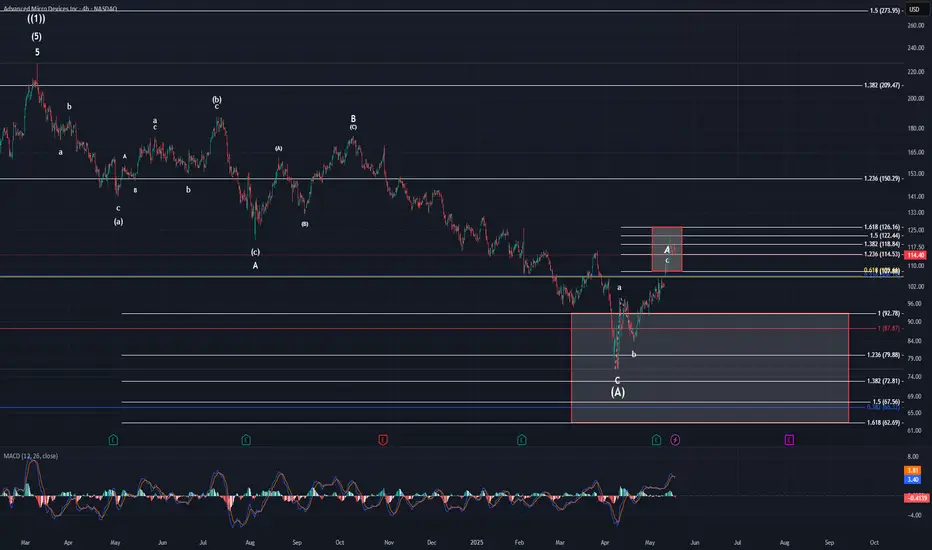
AMDWell, price made it into the box as I had forecasted. Is the pattern done for now to the upside? We cannot say yet, but if it does move higher, we should be looking to the 1.618 @ $126.16 for a reaction. I think another high to the 1.618 would fit great into the pattern after some slight consolidation to lower MACD. If we can do that before making another high, we would be carving out some neg div to help push price down for minor B.
Once we do in fact have a top in place for minor A, I will draw some fibs to help track the move lower. As of now, I am seeing the $85-$92 area for B to drop to.
Eventually, I see this pattern up in the $150-$180 range for the (B) wave completion. It will be some time before (B) completes though. (A) took 13 months to complete. If (B) follows suit that means it won't be done until around April-May 2026.
Let me know if you have any questions.