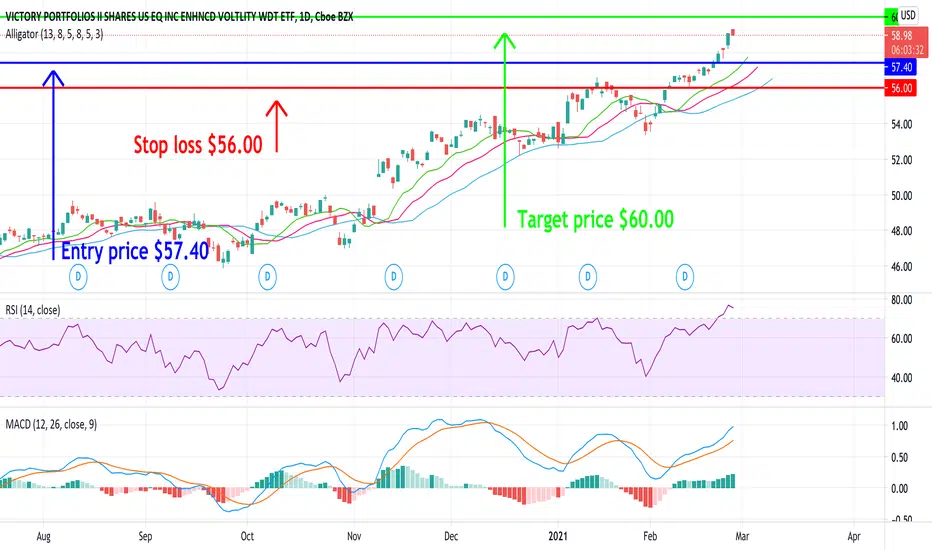
CDC LongWilliams Alligator Indicator shows that the alligator has an ¨open mouth¨, meaning there is strong bullish momentum.
RSI shows that CDC is not overbought or oversold, therefore, a trend reversal or corrective pullback are unlikely to happen in the near future.
MACD line is over the signal li
Key stats
About VictoryShares US EQ Income Enhanced Volatility Wtd ETF
Home page
Inception date
Jul 2, 2014
Structure
Open-Ended Fund
Replication method
Physical
Dividend treatment
Distributes
Distribution tax treatment
Qualified dividends
Income tax type
Capital Gains
Max ST capital gains rate
39.60%
Max LT capital gains rate
20.00%
Primary advisor
Victory Capital Management, Inc. (Investment Management)
Distributor
Foreside Fund Services LLC
CDC looks for income in the large-cap space, with an eye toward avoiding downside via a variety of safety features. It starts with the basket held by its sibling fund CFA: 500 names ranked by market cap and screened for quality in the form of recent positive earnings. Then it ranks them by dividend yield and grabs the top 100 names for the basket but weights them by low volatility. However, when market conditions drop and the index falls 8% or more from its all-time closing high, it can move to 75% cash holdings. The index is reconstituted every March and September.
Related funds
Classification
What's in the fund
Exposure type
Utilities
Finance
Consumer Non-Durables
Stock breakdown by region
Top 10 holdings
Summarizing what the indicators are suggesting.
Oscillators
Neutral
SellBuy
Strong sellStrong buy
Strong sellSellNeutralBuyStrong buy
Oscillators
Neutral
SellBuy
Strong sellStrong buy
Strong sellSellNeutralBuyStrong buy
Summary
Neutral
SellBuy
Strong sellStrong buy
Strong sellSellNeutralBuyStrong buy
Summary
Neutral
SellBuy
Strong sellStrong buy
Strong sellSellNeutralBuyStrong buy
Summary
Neutral
SellBuy
Strong sellStrong buy
Strong sellSellNeutralBuyStrong buy
Moving Averages
Neutral
SellBuy
Strong sellStrong buy
Strong sellSellNeutralBuyStrong buy
Moving Averages
Neutral
SellBuy
Strong sellStrong buy
Strong sellSellNeutralBuyStrong buy
Displays a symbol's price movements over previous years to identify recurring trends.
Frequently Asked Questions
An exchange-traded fund (ETF) is a collection of assets (stocks, bonds, commodities, etc.) that track an underlying index and can be bought on an exchange like individual stocks.
CDC trades at 63.47 USD today, its price has risen 0.21% in the past 24 hours. Track more dynamics on CDC price chart.
CDC net asset value is 63.51 today — it's risen 2.46% over the past month. NAV represents the total value of the fund's assets less liabilities and serves as a gauge of the fund's performance.
CDC assets under management is 728.75 M USD. AUM is an important metric as it reflects the fund's size and can serve as a gauge of how successful the fund is in attracting investors, which, in its turn, can influence decision-making.
CDC price has risen by 0.79% over the last month, and its yearly performance shows a 8.76% increase. See more dynamics on CDC price chart.
NAV returns, another gauge of an ETF dynamics, have risen by 2.46% over the last month, showed a −1.17% decrease in three-month performance and has increased by 12.22% in a year.
NAV returns, another gauge of an ETF dynamics, have risen by 2.46% over the last month, showed a −1.17% decrease in three-month performance and has increased by 12.22% in a year.
CDC fund flows account for −147.96 M USD (1 year). Many traders use this metric to get insight into investors' sentiment and evaluate whether it's time to buy or sell the fund.
Since ETFs work like an individual stock, they can be bought and sold on exchanges (e.g. NASDAQ, NYSE, EURONEXT). As it happens with stocks, you need to select a brokerage to access trading. Explore our list of available brokers to find the one to help execute your strategies. Don't forget to do your research before getting to trading. Explore ETFs metrics in our ETF screener to find a reliable opportunity.
CDC invests in stocks. See more details in our Analysis section.
CDC expense ratio is 0.42%. It's an important metric for helping traders understand the fund's operating costs relative to assets and how expensive it would be to hold the fund.
No, CDC isn't leveraged, meaning it doesn't use borrowings or financial derivatives to magnify the performance of the underlying assets or index it follows.
In some ways, ETFs are safe investments, but in a broader sense, they're not safer than any other asset, so it's crucial to analyze a fund before investing. But if your research gives a vague answer, you can always refer to technical analysis.
Today, CDC technical analysis shows the buy rating and its 1-week rating is buy. Since market conditions are prone to changes, it's worth looking a bit further into the future — according to the 1-month rating CDC shows the buy signal. See more of CDC technicals for a more comprehensive analysis.
Today, CDC technical analysis shows the buy rating and its 1-week rating is buy. Since market conditions are prone to changes, it's worth looking a bit further into the future — according to the 1-month rating CDC shows the buy signal. See more of CDC technicals for a more comprehensive analysis.
Yes, CDC pays dividends to its holders with the dividend yield of 3.33%.
CDC trades at a premium (0.06%).
Premium/discount to NAV expresses the difference between the ETF’s price and its NAV value. A positive percentage indicates a premium, meaning the ETF trades at a higher price than the calculated NAV. Conversely, a negative percentage indicates a discount, suggesting the ETF trades at a lower price than NAV.
Premium/discount to NAV expresses the difference between the ETF’s price and its NAV value. A positive percentage indicates a premium, meaning the ETF trades at a higher price than the calculated NAV. Conversely, a negative percentage indicates a discount, suggesting the ETF trades at a lower price than NAV.
CDC shares are issued by Victory Capital Holdings, Inc.
CDC follows the Nasdaq Victory U.S. Large Cap High Dividend 100 Long/Cash Volatility Weighted Index. ETFs usually track some benchmark seeking to replicate its performance and guide asset selection and objectives.
The fund started trading on Jul 2, 2014.
The fund's management style is passive, meaning it's aiming to replicate the performance of the underlying index by holding assets in the same proportions as the index. The goal is to match the index's returns.