Coherus BioSciences | Chart & Forecast SummaryKey Indicators On Trade Set Up In General
1. Push Set Up
2. Range Set up
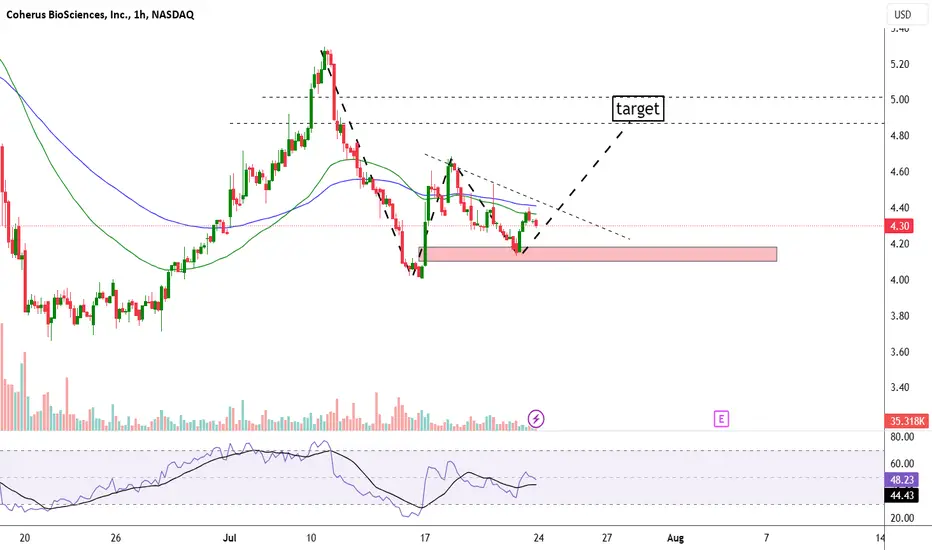
3. Break & Retest Set Up
Notes On Session
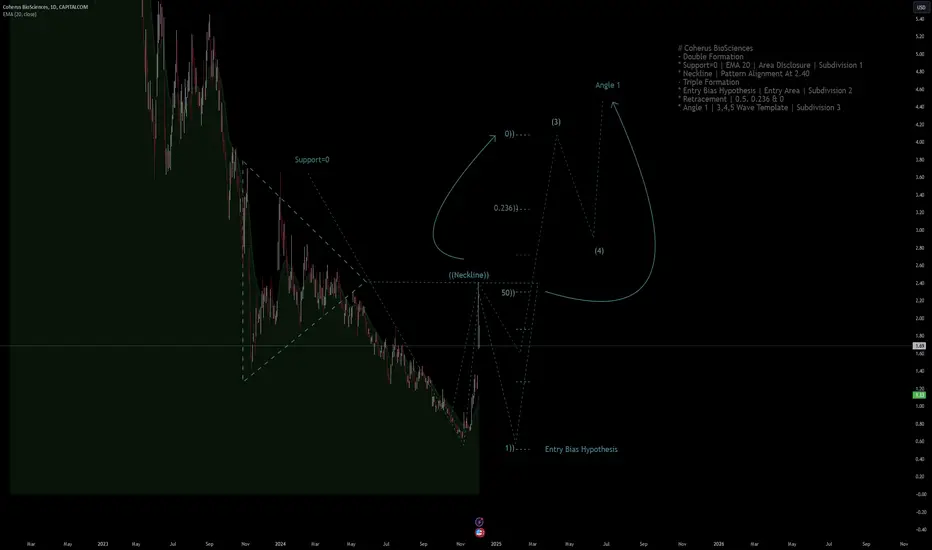
# Coherus BioSciences
- Double Formation
* Support=0 | EMA 20 | Area DIsclosure | Subdivision 1
* Neckline | Pattern Alignment At 2.40
- Triple Formation
* Entry Bias Hypothesis | Entr
Next report date
—
Report period
—
EPS estimate
—
Revenue estimate
—
−1.1334 USD
28.51 M USD
266.96 M USD
105.41 M
About Coherus Oncology, Inc.
Sector
Industry
CEO
Denny M. Lanfear
Website
Headquarters
Redwood City
Founded
2010
FIGI
BBG0063N8V69
Coherus Oncology, Inc. is a commercial-stage biopharmaceutical company, which engages in the development and commercialization of biosimilar therapeutics. Its products include UDENYCA and LOQTORZI. The company was founded by Dennis M. Lanfear, Stuart E. Builder, Dr. Alan Herman, Doug Farrar and Steve Glover in September 2010 and is headquartered in Redwood City, CA.
Related stocks
CHRS - upcoming catalyst - breakout ahead ?Coherus BioSciences Inc is a commercial-stage biopharmaceutical company building an immuno-oncology franchise funded with cash generated by its diversified portfolio of FDA-approved therapeutics. The company is focused on the research, development, and commercialization of its portfolio of FDA-appro


CHRS - BULLISHhealthy pullback with a run up to the .5 area
followed by a pullback for a double bottom.
bullish volume confirmed, long positon and call option position open.
nice run to $5 area.
Junshi Biosciences and Coherus Announce Positive Interim OverallCHRS: Junshi Biosciences
2021-12-13 07:00:00
Junshi Biosciences and Coherus Announce Positive Interim Overall Survival Results of CHOICE-01, a Phase 3 Clinical Trial Evaluating Toripalimab in Combination with Chemotherapy as First-Line Treatment for Non-Small Cell Lung Cancer

Coherus and Junshi Biosciences Announce Toripalimab Granted OrphCHRS: Coherus BioSciences, Inc.
2021-11-15 08:30:00
Coherus and Junshi Biosciences Announce Toripalimab Granted Orphan Drug Designation in the United States for Esophageal Cancer

Next candidate for a short squeeze?Rated by CNBC as one of the three stocks most vulnerable to a squeeze.
Will see))

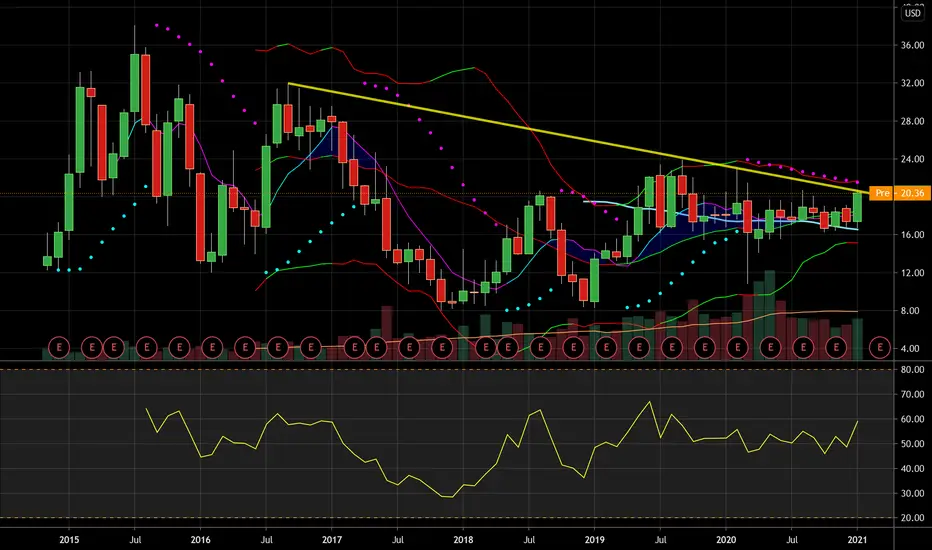
COHERUS cracking $21 will unleash major bullish potentialCOHERUS BIOSCIENCES Inc., NASDAQ:CHRS , is a bioscience company that has not yet not benefited from the sector's outperformance despite significantly improving financials and the business becoming profitable. When the stock price cracks the $21 level it will unlock a significant bullish potential.

CHRS, Stochastic Oscillator left the overbought zone on Oct 09This is a signal that CHRS's price trend could be reversing, and it may be an opportunity to sell the stock or take a defensive position. Tickeron A.I.dvisor identified 63 similar cases where CHRS's stochastic oscillator exited the overbought zone, and 58 of them led to successful outcomes. Odds of
See all ideas
Summarizing what the indicators are suggesting.
Neutral
SellBuy
Strong sellStrong buy
Strong sellSellNeutralBuyStrong buy
Neutral
SellBuy
Strong sellStrong buy
Strong sellSellNeutralBuyStrong buy
Neutral
SellBuy
Strong sellStrong buy
Strong sellSellNeutralBuyStrong buy
An aggregate view of professional's ratings.
Neutral
SellBuy
Strong sellStrong buy
Strong sellSellNeutralBuyStrong buy
Neutral
SellBuy
Strong sellStrong buy
Strong sellSellNeutralBuyStrong buy
Neutral
SellBuy
Strong sellStrong buy
Strong sellSellNeutralBuyStrong buy
Displays a symbol's price movements over previous years to identify recurring trends.
Frequently Asked Questions
The current price of CHRS is 0.8839 USD — it has increased by 0.60% in the past 24 hours. Watch Coherus Oncology, Inc. stock price performance more closely on the chart.
Depending on the exchange, the stock ticker may vary. For instance, on NASDAQ exchange Coherus Oncology, Inc. stocks are traded under the ticker CHRS.
CHRS stock has fallen by −11.10% compared to the previous week, the month change is a 18.14% rise, over the last year Coherus Oncology, Inc. has showed a −36.41% decrease.
We've gathered analysts' opinions on Coherus Oncology, Inc. future price: according to them, CHRS price has a max estimate of 7.00 USD and a min estimate of 1.10 USD. Watch CHRS chart and read a more detailed Coherus Oncology, Inc. stock forecast: see what analysts think of Coherus Oncology, Inc. and suggest that you do with its stocks.
CHRS reached its all-time high on Jul 22, 2015 with the price of 38.1000 USD, and its all-time low was 0.6603 USD and was reached on Nov 5, 2024. View more price dynamics on CHRS chart.
See other stocks reaching their highest and lowest prices.
See other stocks reaching their highest and lowest prices.
CHRS stock is 7.38% volatile and has beta coefficient of 1.00. Track Coherus Oncology, Inc. stock price on the chart and check out the list of the most volatile stocks — is Coherus Oncology, Inc. there?
Today Coherus Oncology, Inc. has the market capitalization of 106.16 M, it has increased by 3.78% over the last week.
Yes, you can track Coherus Oncology, Inc. financials in yearly and quarterly reports right on TradingView.
Coherus Oncology, Inc. is going to release the next earnings report on Aug 7, 2025. Keep track of upcoming events with our Earnings Calendar.
CHRS earnings for the last quarter are −0.41 USD per share, whereas the estimation was −0.30 USD resulting in a −37.86% surprise. The estimated earnings for the next quarter are −0.22 USD per share. See more details about Coherus Oncology, Inc. earnings.
Coherus Oncology, Inc. revenue for the last quarter amounts to 7.60 M USD, despite the estimated figure of 54.67 M USD. In the next quarter, revenue is expected to reach 9.35 M USD.
CHRS net income for the last quarter is −56.57 M USD, while the quarter before that showed −50.70 M USD of net income which accounts for −11.58% change. Track more Coherus Oncology, Inc. financial stats to get the full picture.
No, CHRS doesn't pay any dividends to its shareholders. But don't worry, we've prepared a list of high-dividend stocks for you.
As of Aug 7, 2025, the company has 228 employees. See our rating of the largest employees — is Coherus Oncology, Inc. on this list?
EBITDA measures a company's operating performance, its growth signifies an improvement in the efficiency of a company. Coherus Oncology, Inc. EBITDA is −103.09 M USD, and current EBITDA margin is −37.32%. See more stats in Coherus Oncology, Inc. financial statements.
Like other stocks, CHRS shares are traded on stock exchanges, e.g. Nasdaq, Nyse, Euronext, and the easiest way to buy them is through an online stock broker. To do this, you need to open an account and follow a broker's procedures, then start trading. You can trade Coherus Oncology, Inc. stock right from TradingView charts — choose your broker and connect to your account.
Investing in stocks requires a comprehensive research: you should carefully study all the available data, e.g. company's financials, related news, and its technical analysis. So Coherus Oncology, Inc. technincal analysis shows the sell today, and its 1 week rating is sell. Since market conditions are prone to changes, it's worth looking a bit further into the future — according to the 1 month rating Coherus Oncology, Inc. stock shows the sell signal. See more of Coherus Oncology, Inc. technicals for a more comprehensive analysis.
If you're still not sure, try looking for inspiration in our curated watchlists.
If you're still not sure, try looking for inspiration in our curated watchlists.