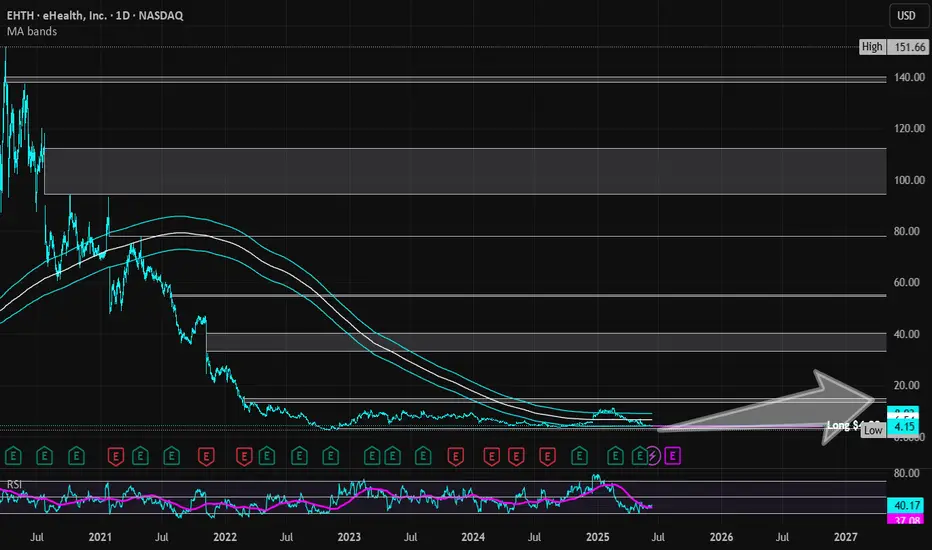
eHealth | EHTH | Long at $4.22eHealth NASDAQ:EHTH , the largest online private health insurance marketplace, may be undervalued. The book value is listed around $19 a share and it has a debt-to-equity of 0.07x (healthy), a quick ratio of 2.5 (strong liquidity, can cover liabilities), growing revenue since 2021 (over $500M in 2024), and insiders have recently bought shares/awarded options. However, profitability is still a concern, but the company is expected to be profitable by 2026. With the US's aging population and the need for affordable healthcare coverage, eHealth *may* standout as a major insurance marketplace... but time will tell.
From a technical analysis perspective, the stock price is near the bottom of its historical simple moving average. I do not doubt, however, that the stock may slip to cover the small price gap between $3.09 and $3.23 (which will be another entry point if fundamentals do not change). This stock may trade sideways for some time. But it has a 27M float and as we saw in 2014 and 2020, it can REALLY get going if buyers see the opportunity...
Thus, at $4.22, NASDAQ:EHTH is in a personal buy zone with more opportunity potentially near $3 in the future.
Targets:
$6.00 (+42.2%)
$8.00 (+89.6%)
EHTH trade ideas
Two stocks that are in accumulation right now to buy for huge gaSphere 3D Corp. (NASDAQ:ANY) and EHealth (NASDAQ:EHTH) are showing great buy setups. ANY is a BTC mining company similar to MIGI and both are showing huge volumes on charts in anticipation of BTC halving and Crypto bull run.
Disclaimer: Do your own analysis before investing or trading. This is not a financial advice.

Nice Risk Reward on EHealthPrevious high is tgt 1 and weekly 50.
Breaks that tgt is 12 & channel line

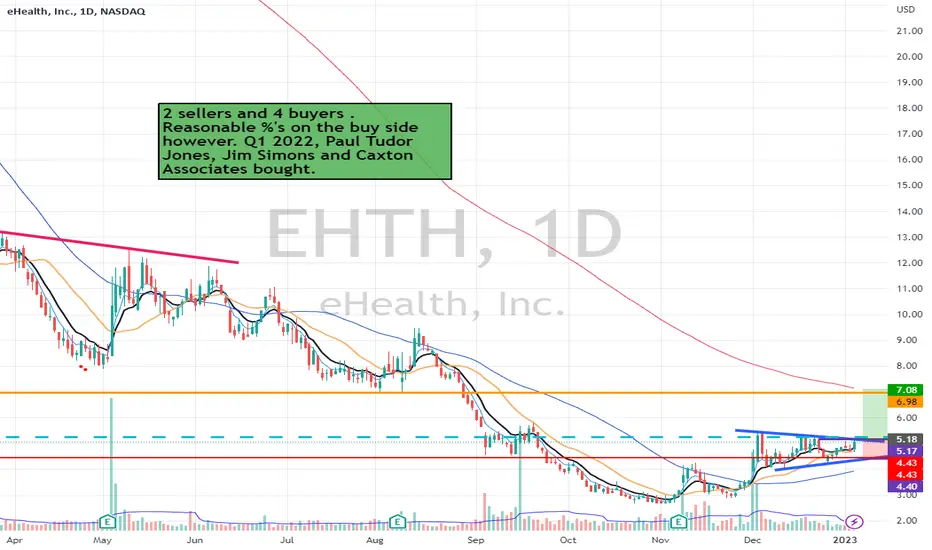
EHTH - Long Setup Pennant - We are looking for a break above 5.23, stop signal below 4.43, target 1: 6.98 target 2: momentum
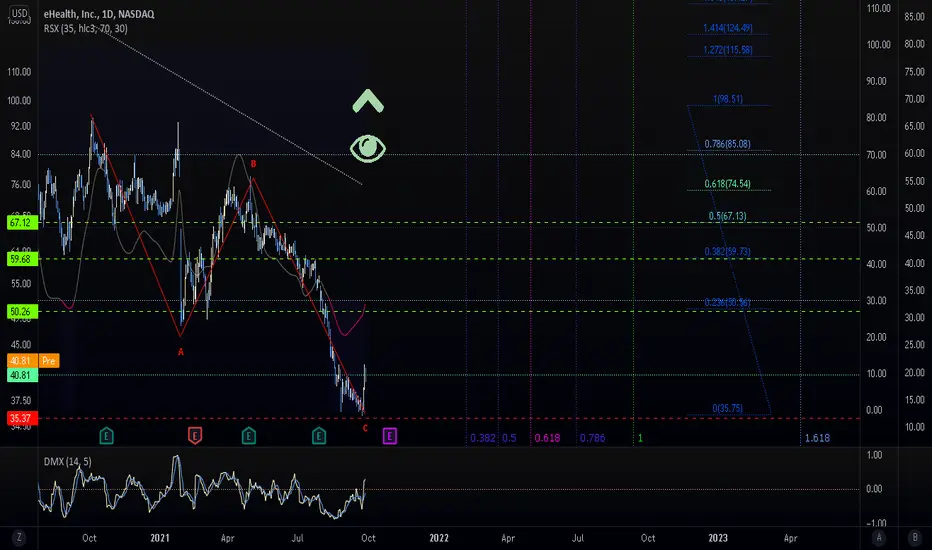
EHealth Inc moving up in the interim. EHTHWe are moving up after correcting with an impulse. This one will be relatively short and vey temporary. We need to go through this motion first begore any chance of a lower low in this instance.
We are not in the business of getting every prediction right, no one ever does and that is not the aim of the game. The Fibonacci targets are highlighted in green with invalidation in red. Fibonacci goals, it is prudent to suggest, are nothing more than mere fractally evident and therefore statistically likely levels that the market will go to. Having said that, the market will always do what it wants and always has a mind of its own. Therefore, none of this is financial advice, so do your own research and rely only on your own analysis. Trading is a true one man sport. Good luck out there and stay safe!
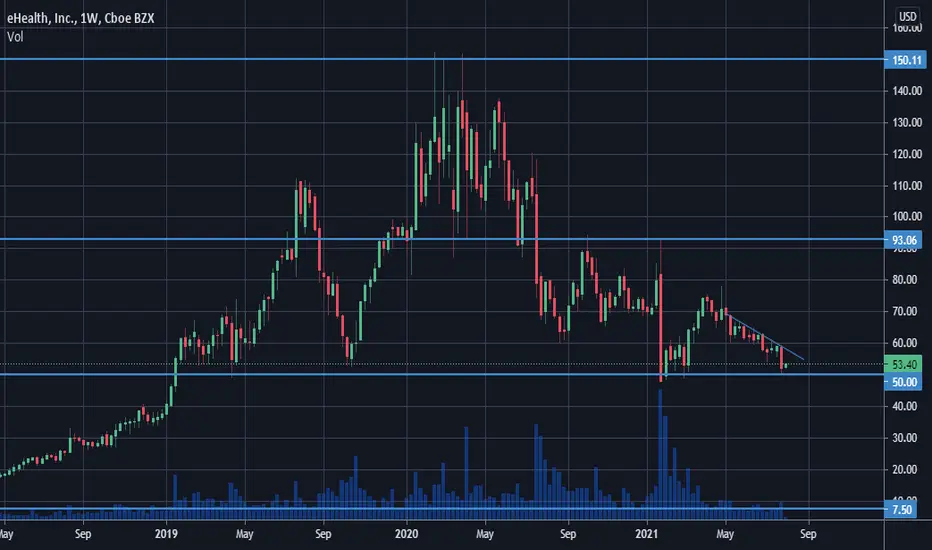
Possible multi-bottom on WeeklyThe stock has been in a local downtrend for the past couple of months, but after hitting $50, the price started to reverse a bit again. Buy @ $50-55 or wait until we break the downtrend and buy around $60, TP $90-100-150, SL $45.
EHEALTH Stakeholders should be CAREFUL!EHEALTH is reaching to it's descending trend line.
General trend of the stock in currently declining and the market will hit to descending line soon at around 78.
Also as it is clear in the chart, price has been significantly reacted to pitchfork lines during its down going path and there is a nice overlap between descending trend line and pitchfork mid line at 78 USD.
In Addition, Stochastic indicator in daily time frame is in overbought zone and has already made a bearish reversal. Moreover a divergence at the top between stochastic indicator and price can be observed.
All the evidence supports the idea that EHEALTH will fall soon and in the case that upcoming earning report can not support the price and push the stock above the trend line the stock will see prices far below the last low which is 47.84.

EHTH is not looking goodWait to short EHTH until the bearish pattern is confirmed. Once the bearish pattern is confirmed look for the price to go to $47

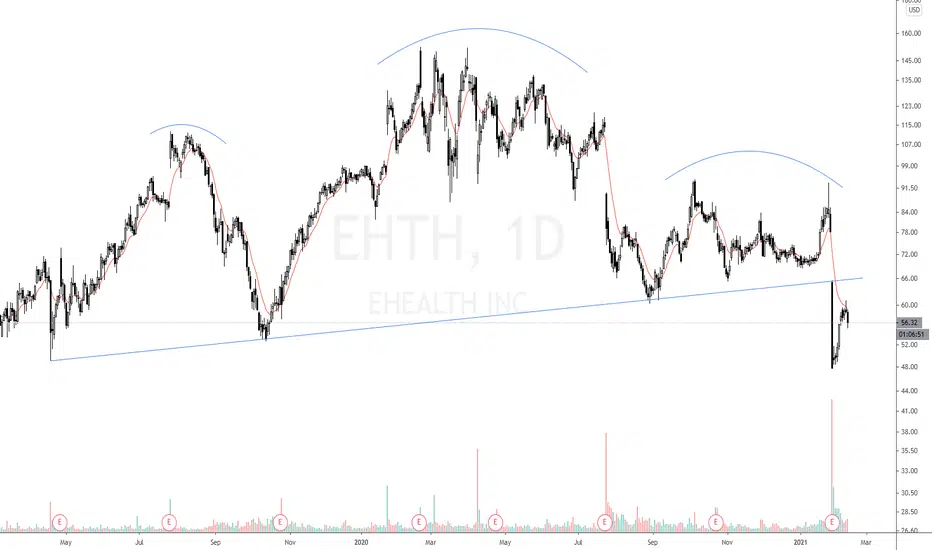
EHTH Head and Shoulders TopThis chart is disgusting. I don't know what the story is with the company, but it looks bad.
$EHTH - 1HR TA - LONGI got in before the break out of the triangle.
HUGE gap to fill and has been treating me very nicely so far.
Feb 19 $50 calls already up 100%
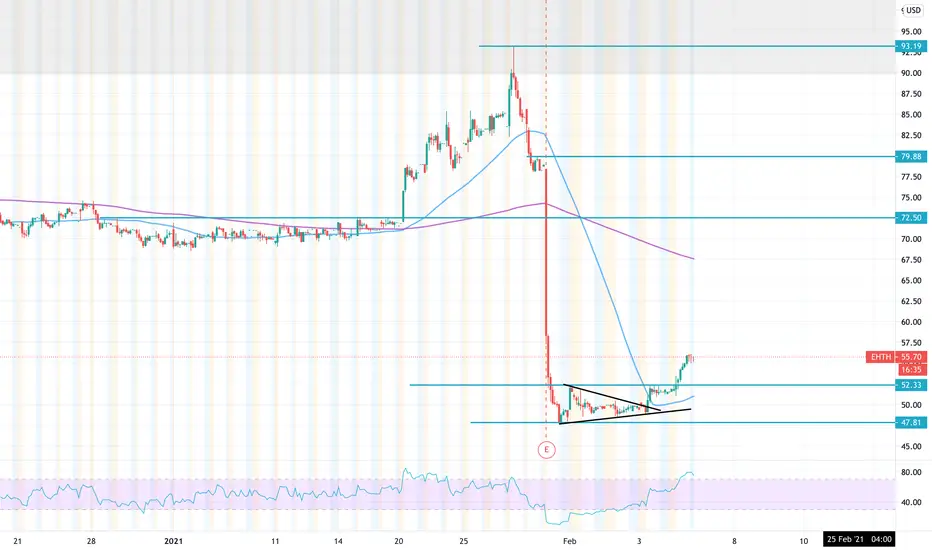
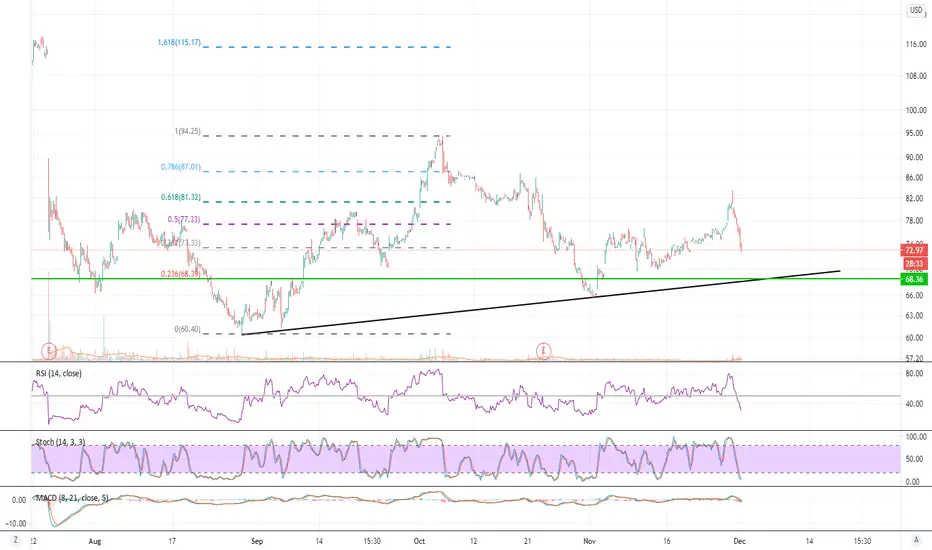
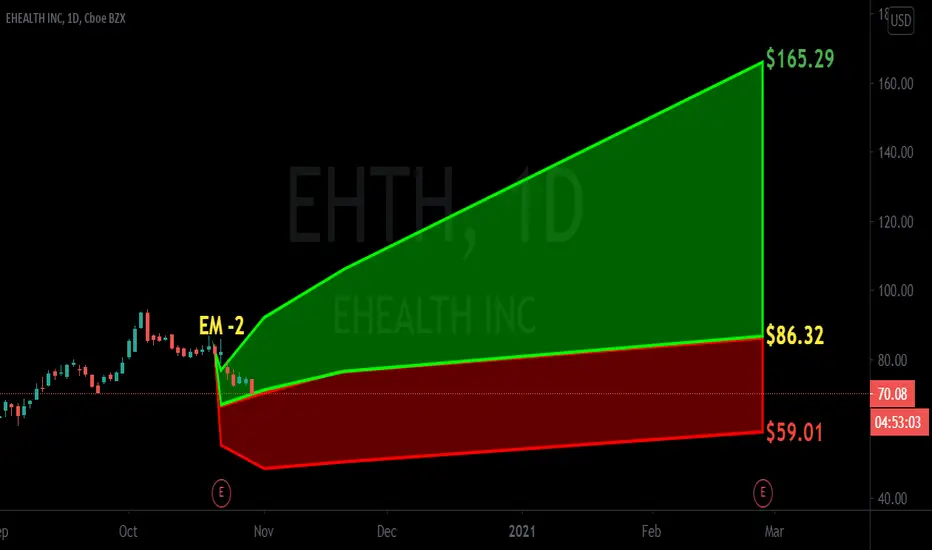
EHTH Intrinsic Value IdeaI had previously published on EHTH while it was in a symmetrical triangle formation. There was a brief false breakout at the end of January with the price going as high as 93. This was short lived however as it fell back below the initial resistance line and then rapidly dropped all the way down to $48 following a downgraded price target from RBC Capital. Despite the negative report and subsequent steep drop in price I still believe EHTH is a fundamentally strong company that will continue its steady/solid growth. I had previously set a $115 price target on EHTH and still believe this target can be justified however lets consider the possibility that I was simply just off in my valuation. I came to this $115 target using an already conservative 30% margin of error in my calculations. If we took those same calculations and used a very conservative 50% margin of error instead of 30%, our min price target would still be $82. I believe at this current price level there is some great value here.

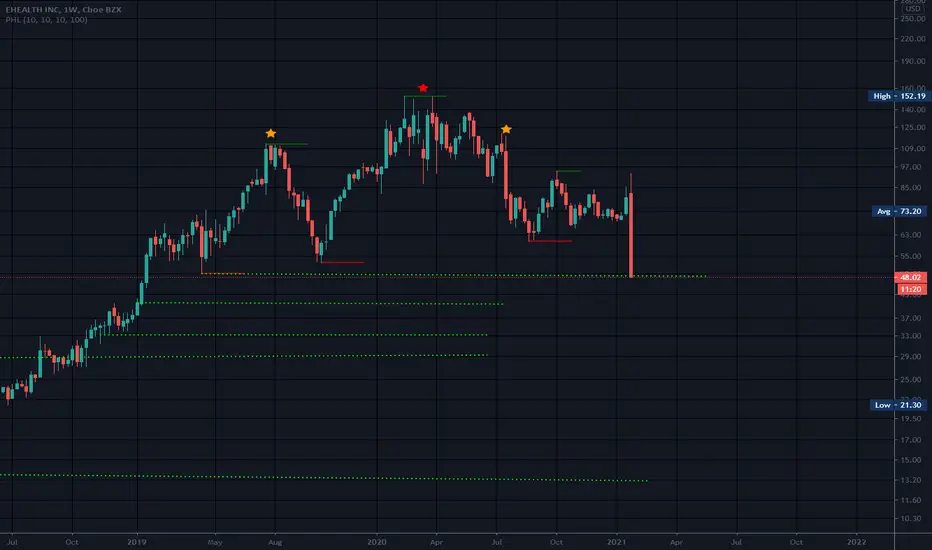
Pull Back FishingWeekly chart
Big drop down..I have been watching this one for a while..and am glad I did not buy it of I would be down big time..
Not sure what happened..if you know, please comment.
The bottom is not always the bottom ): and sometimes I have been a victim of that before
Shows a H&S pattern on the weekly time frame..is at a level of support/neckline..but looks like it will fall some more..Red weekly candle has a long upper wick and no bottom wick..candles always form a bottom wick..eventually
Not a recommendation/just watching and observing
Steering clear of all the rising wedges and parabolic stocks on the market, and there are a lot out there. Maybe time to do bottom fishing or buy very close to rock solid support..but S and R levels were made to be broken ot stuff just be ranging all the time..Eyeballing utilities etc..and dividend stocks that are close to bottom..a safe haven..Gold is surprising me as it is not really breaking out. Looks like silver is..Maybe BTC is the new gold..dunno..
Do not let Mr Market give you the rope to hang yourself with..he is sly (o:
EHTH- BUY ON BOTTOM LIKE A PROHere, we can see bottom touch/ perfect place for long position . Also I see elliot's waves approval.

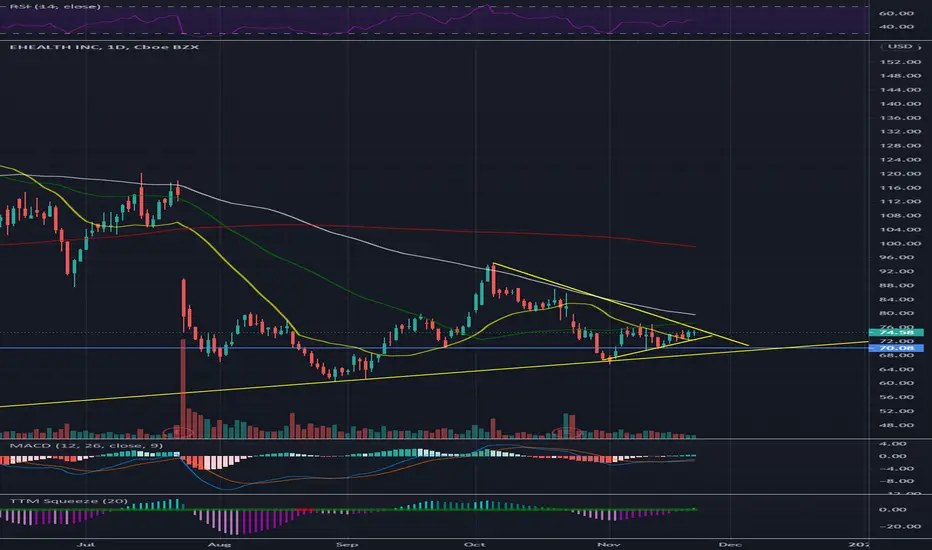
Love this setup for EHTH: Major RunupEHTH looks primed for a major runup... All fast EMA's converging and crossing over from orange to grey with the slow EMA's turning from red to grey with a very bullish signal from GMMA oscillator all suggest to me this is entering a new bullish trend and will hit levels it hasn't seen since June-July

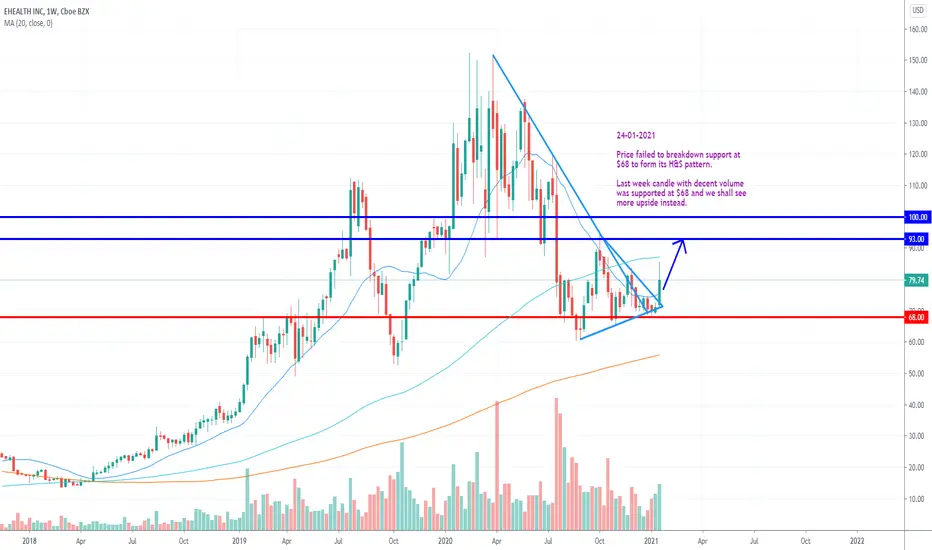
Supported by H&S neckline. See upsideH&S neckline support price at $68.
However price was supported and did not break below.
See more upside with decent volume
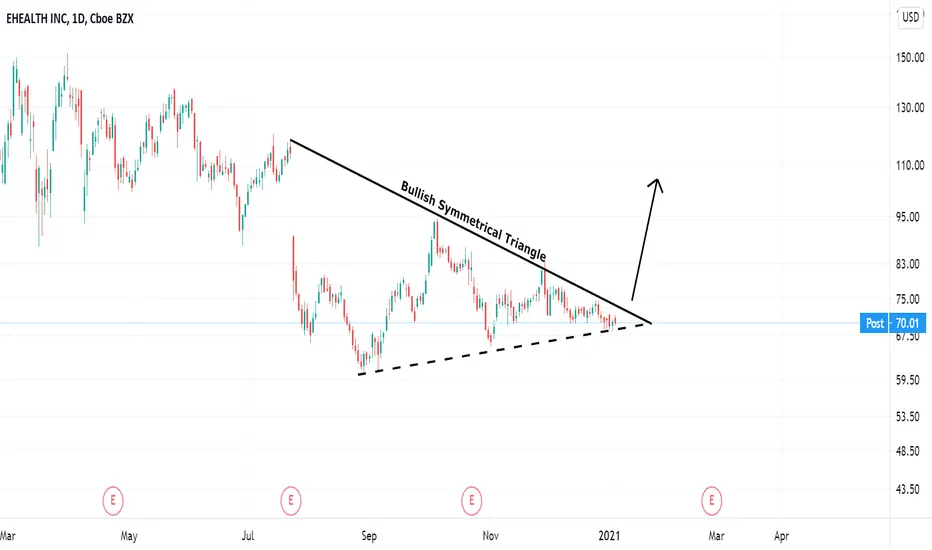
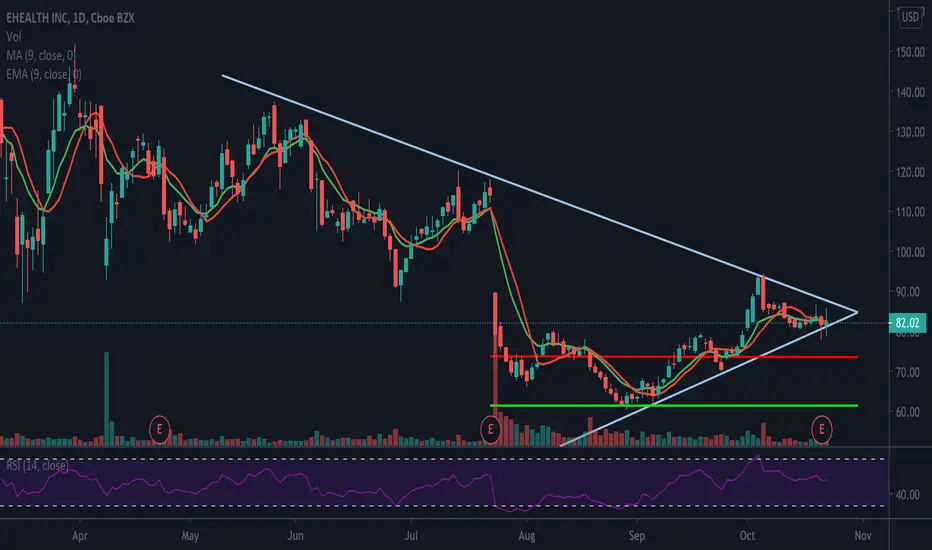
EHTH has Broken Out of Bullish Symmetrical TriangleI published the following on January 6th: Bullish symmetrical triangle has formed on EHTH... Looks like it will attempt a breakout soon which would bring some really nice upside. If a breakout occurs I expect price to easily climb back up to $90 and anticipate it could go as high as $120. Based on my fundamental analysis I have a $115 price target for EHTH which is reinforced by the indicated chart pattern....
UPDATE on January 20th..... EHTH has finally broken out of the bull symmetrical triangle and is up over 8% on the day... I expect this run up in price to continue and fully expect to reach price target 1 in the very near future.... It will be important to continue watching price action as we approach target 1 level as we may hit some resistance here, however, if we break through this price target I am confident EHTH price will reach the $110's

EHTH- Bullish Symmetrical TriangleBullish symmetrical triangle has formed on EHTH... Looks like it will attempt a breakout soon which would bring some really nice upside. If a breakout occurs I expect price to easily climb back up to $90 and it could go as high as $120. Based on my fundamental analysis I have a $115 price target for EHTH which is reinforced by the indicated chart pattern.
EHTH FreefallEHTH falling today so far. If it bounces off the black trendline or shows a major reversal before then, I will consider getting in.
$EHTH posted slightly better earnings then expectedThe PEAD is projecting a neutral outlook we a bit of bullish sentiment for $EHTH . the price is trading above the Median line.
$EHTH Break Down$EHTH dropped $9 after hours from 82.02 to 73.01. It broke out of this wedge downwards and could possibly gap back down to the $61 range. Let me know what you guys think.
EHTH follow the $downtrend breakout rejected, and trading at the downtrend level since then.
ER as a catalyst may send EHTH to break out or gap down again, wait for ER price action and the new trend may continue for several days.

$EHTH EHEALTH inc needs to relax.
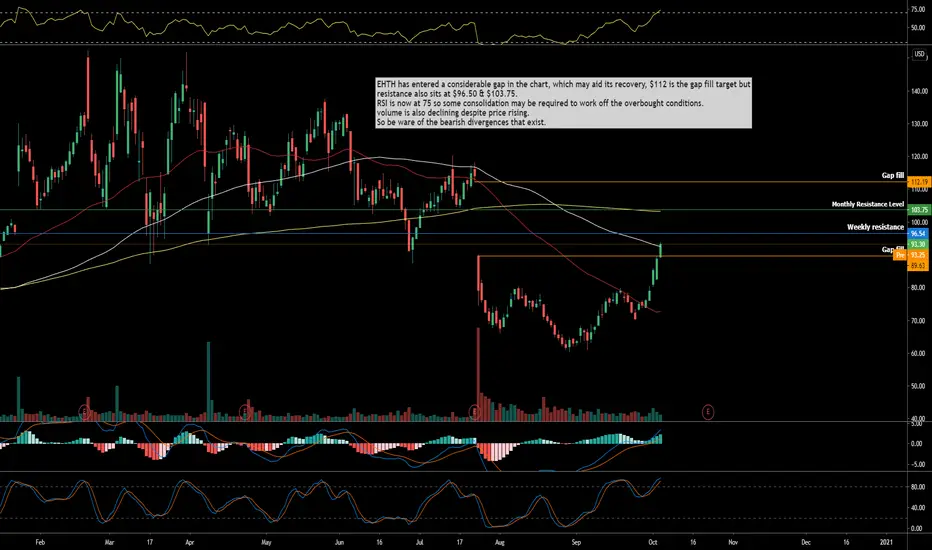
EHTH has entered a considerable gap in the chart, which may aid its recovery, $112 is the gap fill target but
resistance also sits at $96.50 & $103.75.
RSI is now at 75 so some consolidation may be required to work off the overbought conditions.
volume is also declining despite price rising.
So be ware of the bearish divergences that exist.