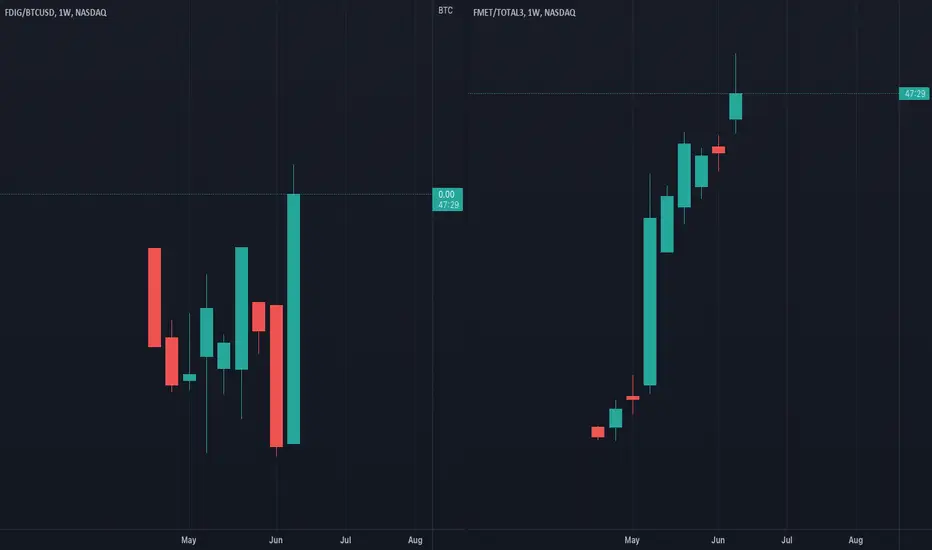
Fidelity ETFs outperforming cryptoThe ratio of both crypto fidelity ETFs to their spot products is rising dramatically, with their met averse etc rising 80% relative to Total3.
Key stats
About Fidelity Metaverse ETF
Home page
Inception date
Apr 19, 2022
Structure
Open-Ended Fund
Replication method
Physical
Dividend treatment
Distributes
Distribution tax treatment
Qualified dividends
Income tax type
Capital Gains
Max ST capital gains rate
39.60%
Max LT capital gains rate
20.00%
Primary advisor
Fidelity Management & Research Co. LLC
Distributor
Fidelity Distributors Corp.
FMET holds stocks and depositary receipts of globally listed companies that develop, manufacture, distribute, or sell products related to the metaverse. Eligible companies must derive at least 50% of their revenue from (i) computing hardware, (ii) digital infrastructure, (iii) design & engineering software, (iv) gaming technology & software, (v) web development & content services, and (vi) smart phone & wearable technology. The index uses quality screens based on trailing or next 12-month revenues, operating cash flow, sales growth, and analyst coverage to filter out companies that pose significant risks. Then securities are ranked for thematic relevance, which is a composite of total significant revenue, percent of significant revenue, and a natural language processing (NLP) score. Approximately 50 stocks are selected and the portfolio is weighted according to market capitalization, subject to liquidity constraints and a 4.5% single weight capping. The index is rebalanced quarterly.
Related funds
Classification
What's in the fund
Exposure type
Technology Services
Electronic Technology
Stock breakdown by region
Top 10 holdings
Summarizing what the indicators are suggesting.
Oscillators
Neutral
SellBuy
Strong sellStrong buy
Strong sellSellNeutralBuyStrong buy
Oscillators
Neutral
SellBuy
Strong sellStrong buy
Strong sellSellNeutralBuyStrong buy
Summary
Neutral
SellBuy
Strong sellStrong buy
Strong sellSellNeutralBuyStrong buy
Summary
Neutral
SellBuy
Strong sellStrong buy
Strong sellSellNeutralBuyStrong buy
Summary
Neutral
SellBuy
Strong sellStrong buy
Strong sellSellNeutralBuyStrong buy
Moving Averages
Neutral
SellBuy
Strong sellStrong buy
Strong sellSellNeutralBuyStrong buy
Moving Averages
Neutral
SellBuy
Strong sellStrong buy
Strong sellSellNeutralBuyStrong buy
Displays a symbol's price movements over previous years to identify recurring trends.
Frequently Asked Questions
An exchange-traded fund (ETF) is a collection of assets (stocks, bonds, commodities, etc.) that track an underlying index and can be bought on an exchange like individual stocks.
FMET trades at 33.80 USD today, its price has fallen −0.32% in the past 24 hours. Track more dynamics on FMET price chart.
FMET net asset value is 34.12 today — it's risen 8.10% over the past month. NAV represents the total value of the fund's assets less liabilities and serves as a gauge of the fund's performance.
FMET assets under management is 42.27 M USD. AUM is an important metric as it reflects the fund's size and can serve as a gauge of how successful the fund is in attracting investors, which, in its turn, can influence decision-making.
FMET price has risen by 6.31% over the last month, and its yearly performance shows a 9.35% increase. See more dynamics on FMET price chart.
NAV returns, another gauge of an ETF dynamics, have risen by 8.10% over the last month, showed a 28.43% increase in three-month performance and has increased by 12.85% in a year.
NAV returns, another gauge of an ETF dynamics, have risen by 8.10% over the last month, showed a 28.43% increase in three-month performance and has increased by 12.85% in a year.
FMET fund flows account for 5.21 M USD (1 year). Many traders use this metric to get insight into investors' sentiment and evaluate whether it's time to buy or sell the fund.
Since ETFs work like an individual stock, they can be bought and sold on exchanges (e.g. NASDAQ, NYSE, EURONEXT). As it happens with stocks, you need to select a brokerage to access trading. Explore our list of available brokers to find the one to help execute your strategies. Don't forget to do your research before getting to trading. Explore ETFs metrics in our ETF screener to find a reliable opportunity.
FMET invests in stocks. See more details in our Analysis section.
FMET expense ratio is 0.40%. It's an important metric for helping traders understand the fund's operating costs relative to assets and how expensive it would be to hold the fund.
No, FMET isn't leveraged, meaning it doesn't use borrowings or financial derivatives to magnify the performance of the underlying assets or index it follows.
In some ways, ETFs are safe investments, but in a broader sense, they're not safer than any other asset, so it's crucial to analyze a fund before investing. But if your research gives a vague answer, you can always refer to technical analysis.
Today, FMET technical analysis shows the buy rating and its 1-week rating is buy. Since market conditions are prone to changes, it's worth looking a bit further into the future — according to the 1-month rating FMET shows the buy signal. See more of FMET technicals for a more comprehensive analysis.
Today, FMET technical analysis shows the buy rating and its 1-week rating is buy. Since market conditions are prone to changes, it's worth looking a bit further into the future — according to the 1-month rating FMET shows the buy signal. See more of FMET technicals for a more comprehensive analysis.
Yes, FMET pays dividends to its holders with the dividend yield of 0.86%.
FMET trades at a premium (0.03%).
Premium/discount to NAV expresses the difference between the ETF’s price and its NAV value. A positive percentage indicates a premium, meaning the ETF trades at a higher price than the calculated NAV. Conversely, a negative percentage indicates a discount, suggesting the ETF trades at a lower price than NAV.
Premium/discount to NAV expresses the difference between the ETF’s price and its NAV value. A positive percentage indicates a premium, meaning the ETF trades at a higher price than the calculated NAV. Conversely, a negative percentage indicates a discount, suggesting the ETF trades at a lower price than NAV.
FMET shares are issued by FMR LLC
FMET follows the Fidelity Metaverse Index - Benchmark TR Net. ETFs usually track some benchmark seeking to replicate its performance and guide asset selection and objectives.
The fund started trading on Apr 19, 2022.
The fund's management style is passive, meaning it's aiming to replicate the performance of the underlying index by holding assets in the same proportions as the index. The goal is to match the index's returns.