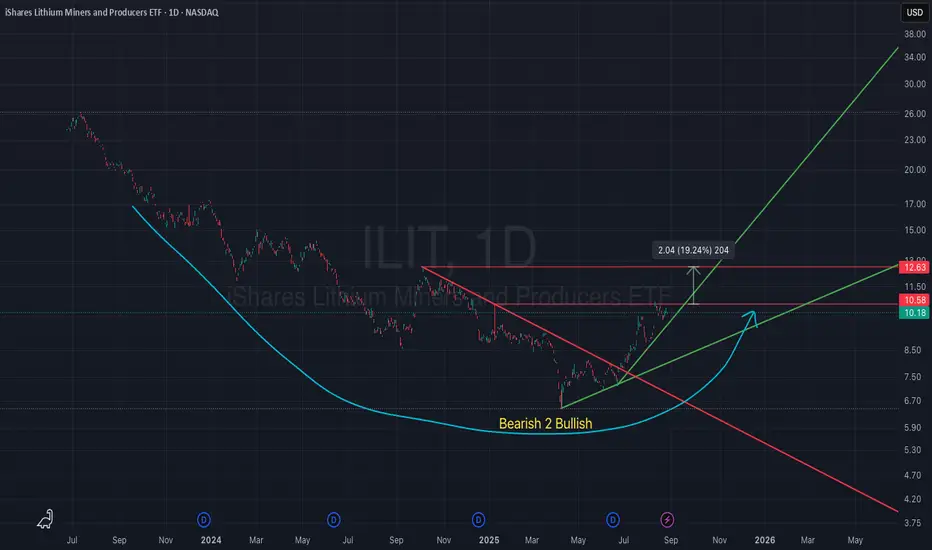
iShares Lithium Miners & Producers ETF (ILIT) – Bearish to BulliILIT is showing signs of a major trend reversal after a long bearish cycle. The ETF has broken out of its descending trendline (red) and is now establishing a new bullish trendline (green). The rounded bottom structure highlights a transition from bearish to bullish momentum.
Currently, price is co
Key stats
About iShares Lithium Miners and Producers ETF
Home page
Inception date
Jun 23, 2023
Structure
Open-Ended Fund
Replication method
Physical
Dividend treatment
Distributes
Distribution tax treatment
Qualified dividends
Income tax type
Capital Gains
Max ST capital gains rate
39.60%
Max LT capital gains rate
20.00%
Primary advisor
BlackRock Fund Advisors
Distributor
BlackRock Investments LLC
ISIN
US46436E1718
ILIT tracks an index comprised of lithium miners and compound manufacturers globally. The fund selects its stocks based on a two-tiered process. Tier 1 is divided into three, with Tier 1a being companies categorized as lithium ore miners. Tier 1b is for organizations classified as lithium compound manufacturers. Tier 1c are companies with more than 50% of their revenues tied with both lithium mining and lithium compound manufacturing, with the goal of having 50 stocks composing the index. In the occasion that less than 50 are eligible, Tier 2 constituents are considered. Tier 2 will be organizations with more than 25% but less than 50% of their revenues tied with both lithium industries. Companies are ranked and selected based on revenue exposure. The index is market-cap weighted with a tilt towards high-exposure (Tier 1 with top 20% of market share) companies. The index is rebalanced quarterly.
Related funds
Classification
What's in the fund
Exposure type
Process Industries
Non-Energy Minerals
Electronic Technology
Stock breakdown by region
Top 10 holdings
Summarizing what the indicators are suggesting.
Oscillators
Neutral
SellBuy
Strong sellStrong buy
Strong sellSellNeutralBuyStrong buy
Oscillators
Neutral
SellBuy
Strong sellStrong buy
Strong sellSellNeutralBuyStrong buy
Summary
Neutral
SellBuy
Strong sellStrong buy
Strong sellSellNeutralBuyStrong buy
Summary
Neutral
SellBuy
Strong sellStrong buy
Strong sellSellNeutralBuyStrong buy
Summary
Neutral
SellBuy
Strong sellStrong buy
Strong sellSellNeutralBuyStrong buy
Moving Averages
Neutral
SellBuy
Strong sellStrong buy
Strong sellSellNeutralBuyStrong buy
Moving Averages
Neutral
SellBuy
Strong sellStrong buy
Strong sellSellNeutralBuyStrong buy
Displays a symbol's price movements over previous years to identify recurring trends.
Frequently Asked Questions
An exchange-traded fund (ETF) is a collection of assets (stocks, bonds, commodities, etc.) that track an underlying index and can be bought on an exchange like individual stocks.
ILIT trades at 10.55 USD today, its price has fallen −2.95% in the past 24 hours. Track more dynamics on ILIT price chart.
ILIT net asset value is 10.80 today — it's risen 14.09% over the past month. NAV represents the total value of the fund's assets less liabilities and serves as a gauge of the fund's performance.
ILIT assets under management is 5.81 M USD. AUM is an important metric as it reflects the fund's size and can serve as a gauge of how successful the fund is in attracting investors, which, in its turn, can influence decision-making.
ILIT price has risen by 11.65% over the last month, and its yearly performance shows a 20.16% increase. See more dynamics on ILIT price chart.
NAV returns, another gauge of an ETF dynamics, have risen by 14.09% over the last month, showed a 42.04% increase in three-month performance and has increased by 31.55% in a year.
NAV returns, another gauge of an ETF dynamics, have risen by 14.09% over the last month, showed a 42.04% increase in three-month performance and has increased by 31.55% in a year.
ILIT fund flows account for 1.46 M USD (1 year). Many traders use this metric to get insight into investors' sentiment and evaluate whether it's time to buy or sell the fund.
Since ETFs work like an individual stock, they can be bought and sold on exchanges (e.g. NASDAQ, NYSE, EURONEXT). As it happens with stocks, you need to select a brokerage to access trading. Explore our list of available brokers to find the one to help execute your strategies. Don't forget to do your research before getting to trading. Explore ETFs metrics in our ETF screener to find a reliable opportunity.
ILIT invests in stocks. See more details in our Analysis section.
ILIT expense ratio is 0.47%. It's an important metric for helping traders understand the fund's operating costs relative to assets and how expensive it would be to hold the fund.
No, ILIT isn't leveraged, meaning it doesn't use borrowings or financial derivatives to magnify the performance of the underlying assets or index it follows.
In some ways, ETFs are safe investments, but in a broader sense, they're not safer than any other asset, so it's crucial to analyze a fund before investing. But if your research gives a vague answer, you can always refer to technical analysis.
Today, ILIT technical analysis shows the buy rating and its 1-week rating is buy. Since market conditions are prone to changes, it's worth looking a bit further into the future — according to the 1-month rating ILIT shows the buy signal. See more of ILIT technicals for a more comprehensive analysis.
Today, ILIT technical analysis shows the buy rating and its 1-week rating is buy. Since market conditions are prone to changes, it's worth looking a bit further into the future — according to the 1-month rating ILIT shows the buy signal. See more of ILIT technicals for a more comprehensive analysis.
Yes, ILIT pays dividends to its holders with the dividend yield of 5.08%.
ILIT trades at a premium (0.54%).
Premium/discount to NAV expresses the difference between the ETF’s price and its NAV value. A positive percentage indicates a premium, meaning the ETF trades at a higher price than the calculated NAV. Conversely, a negative percentage indicates a discount, suggesting the ETF trades at a lower price than NAV.
Premium/discount to NAV expresses the difference between the ETF’s price and its NAV value. A positive percentage indicates a premium, meaning the ETF trades at a higher price than the calculated NAV. Conversely, a negative percentage indicates a discount, suggesting the ETF trades at a lower price than NAV.
ILIT shares are issued by BlackRock, Inc.
ILIT follows the STOXX Global Lithium Miners and Producers Index - USD - Benchmark TR Net. ETFs usually track some benchmark seeking to replicate its performance and guide asset selection and objectives.
The fund started trading on Jun 23, 2023.
The fund's management style is passive, meaning it's aiming to replicate the performance of the underlying index by holding assets in the same proportions as the index. The goal is to match the index's returns.