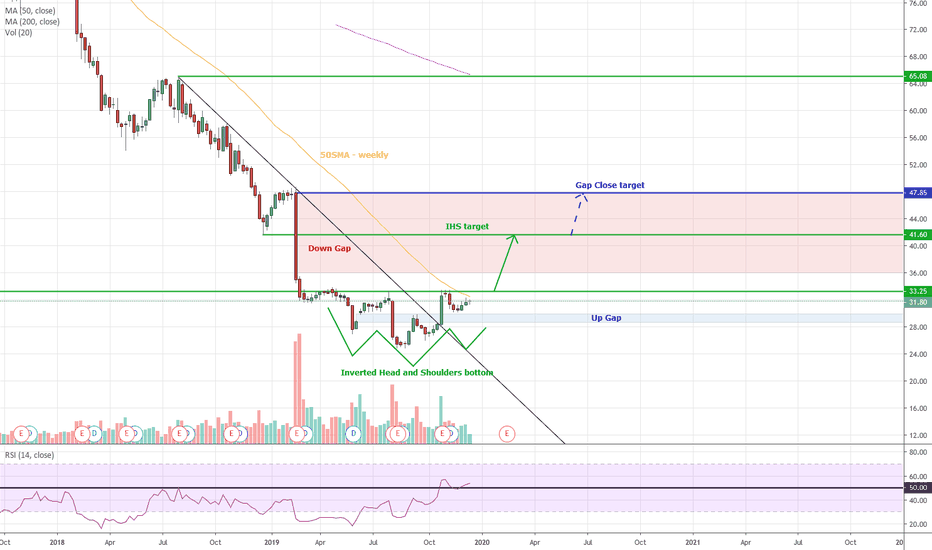
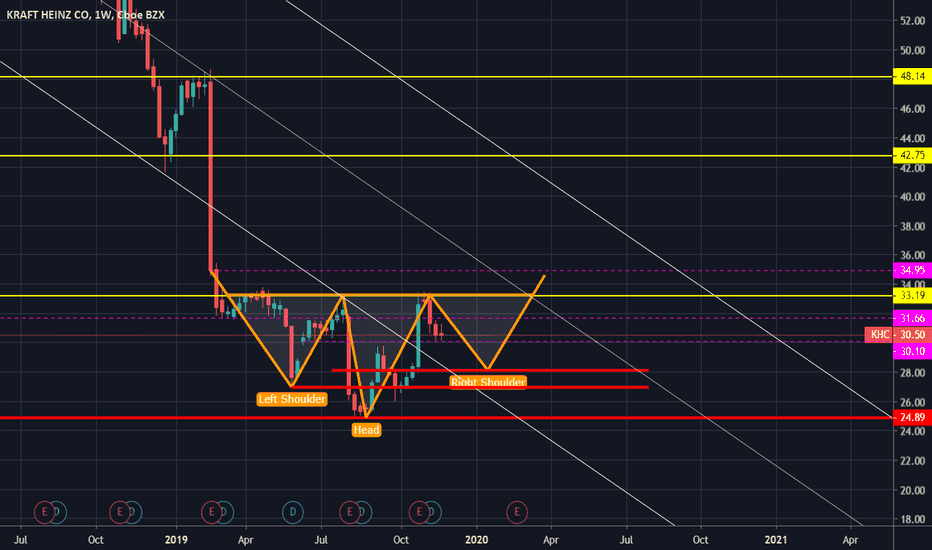
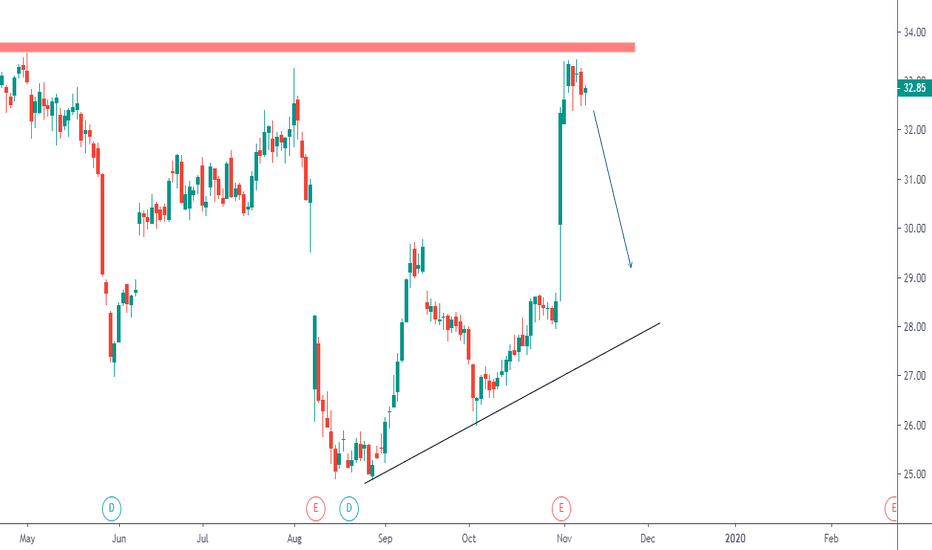
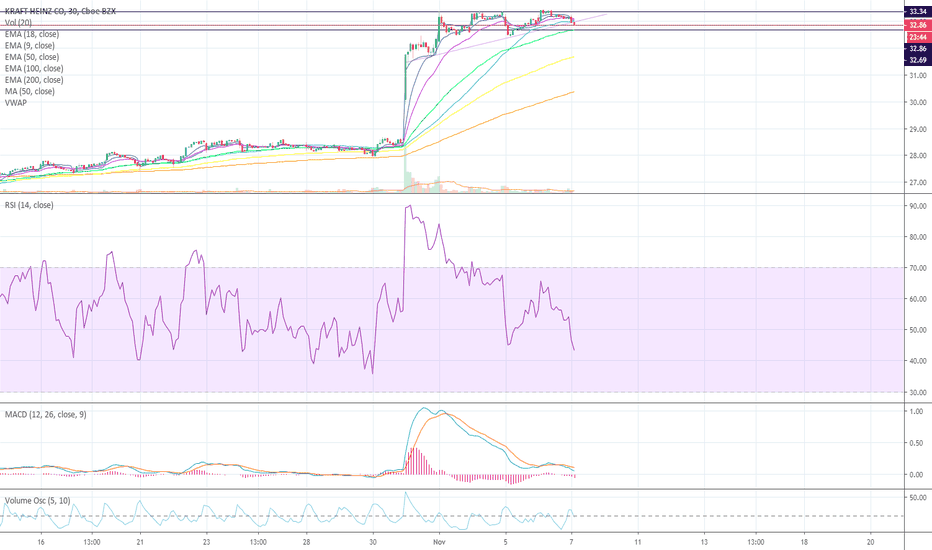
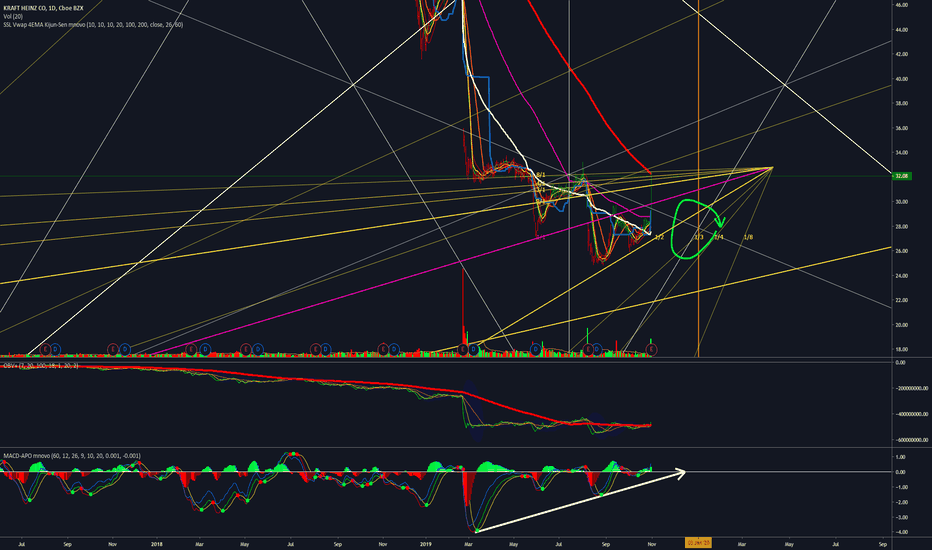
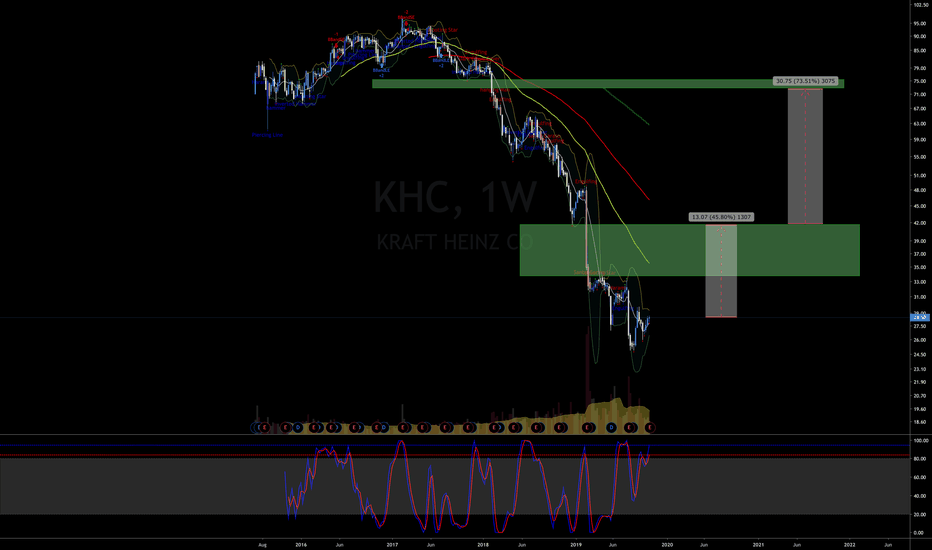
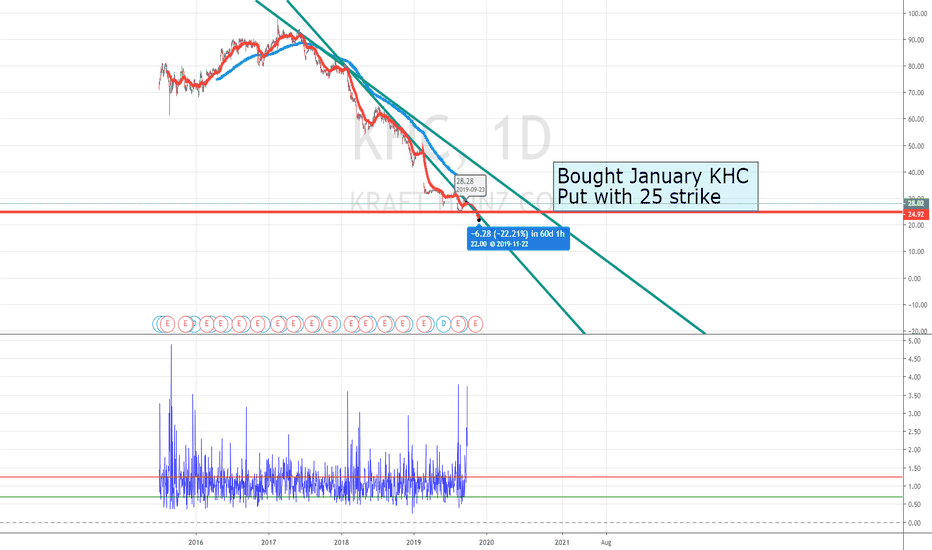
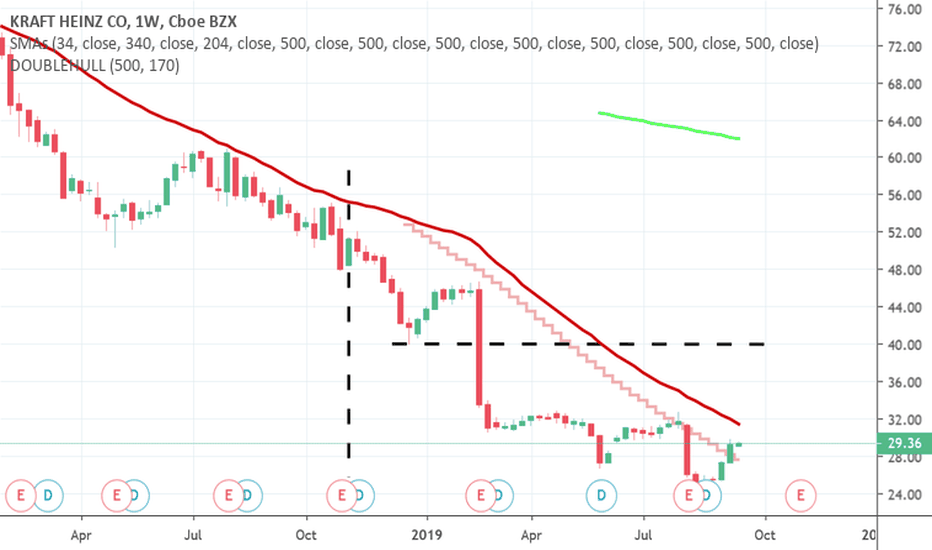
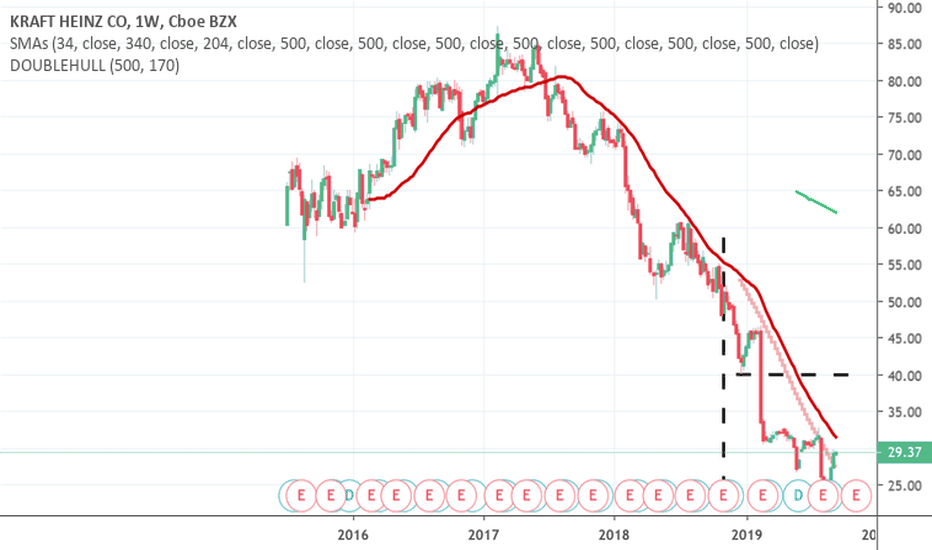
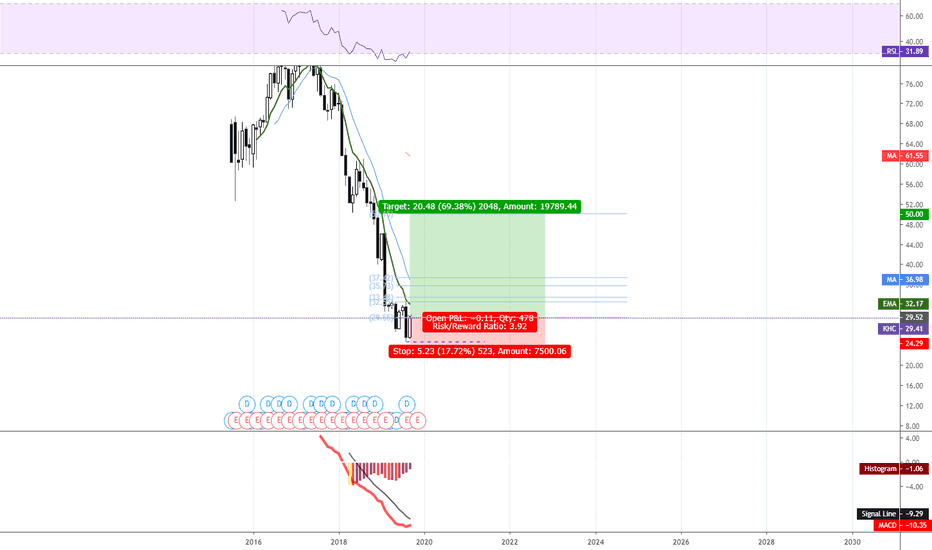
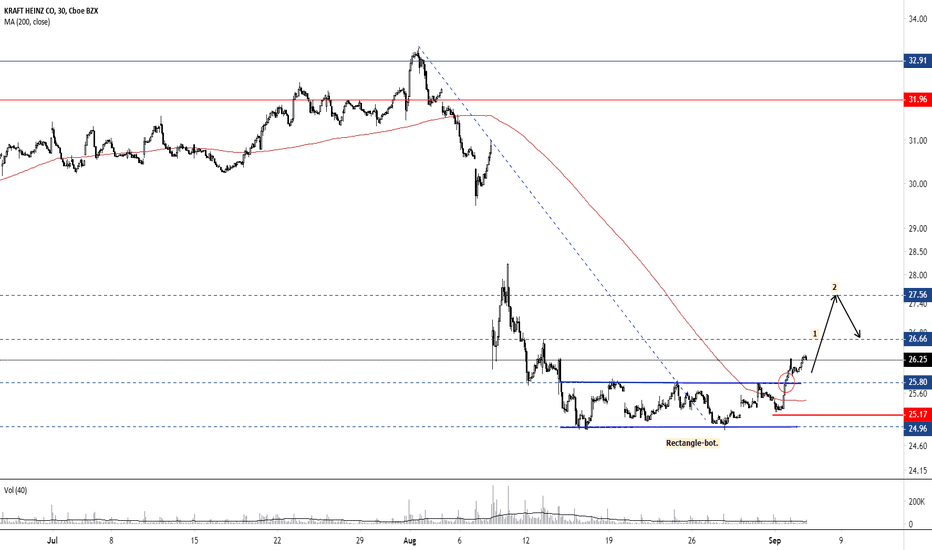
KHC - Inverted Head and ShouldersQuick update on KHC idea. The stock still goes through accumulation phase. Accumulation takes lots of time and it is better to switch to weekly TF from daily to see the progress. On weekly TF I see the inverted head and shoulder pattern showing up, allowing us to project targets if it plays out and breaks neckline. Weekly 50 Simple Moving Average is also at a neckline level right now providing resistance. It needs to be broken to confirm bigger rally.
KHC trade ideas
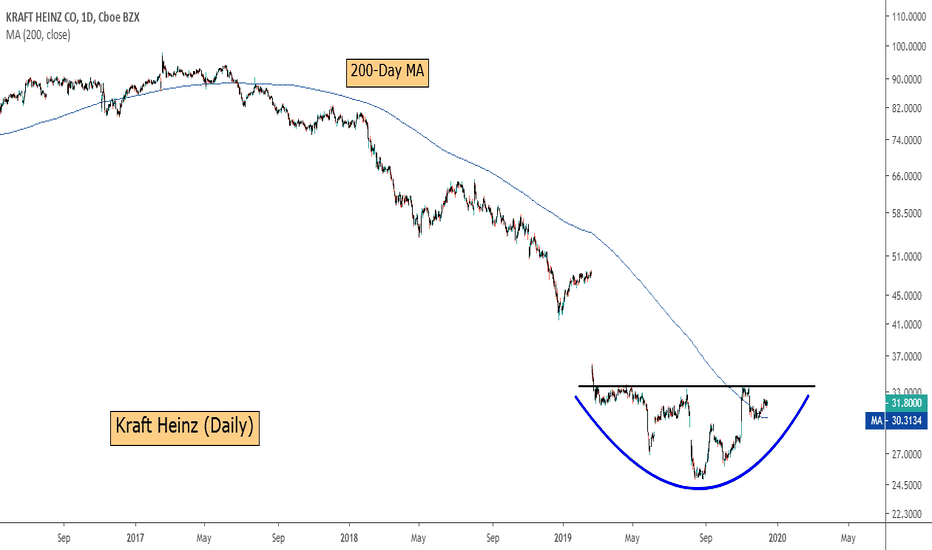
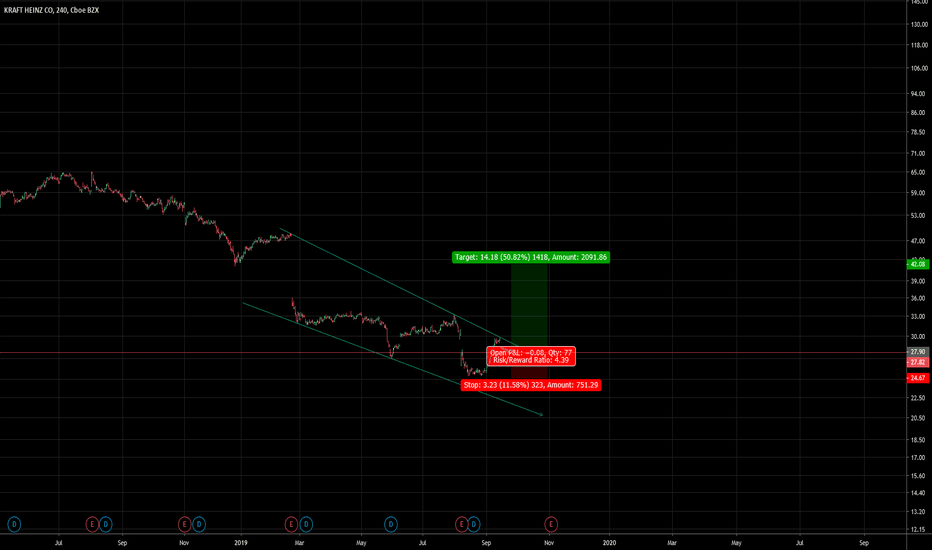
Kraft HeinzKraft Heinz | KHC has spent the last two and a half years in a downward trend, having shed 66% from it’s peak of 93.21. Now, the technical setup is signaling the potential for a reversal of the downward trend with the price having regained the 200-day moving average and having formed a 10-month base by way of an inverse head and shoulder formation. Two daily closes above the resistance level of $34.25 triggers the technical setup for move back to $42.
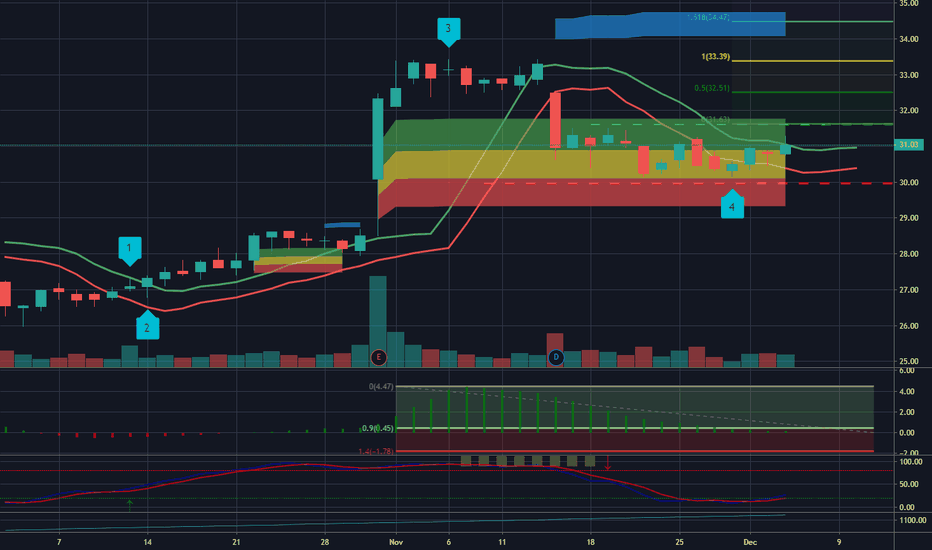
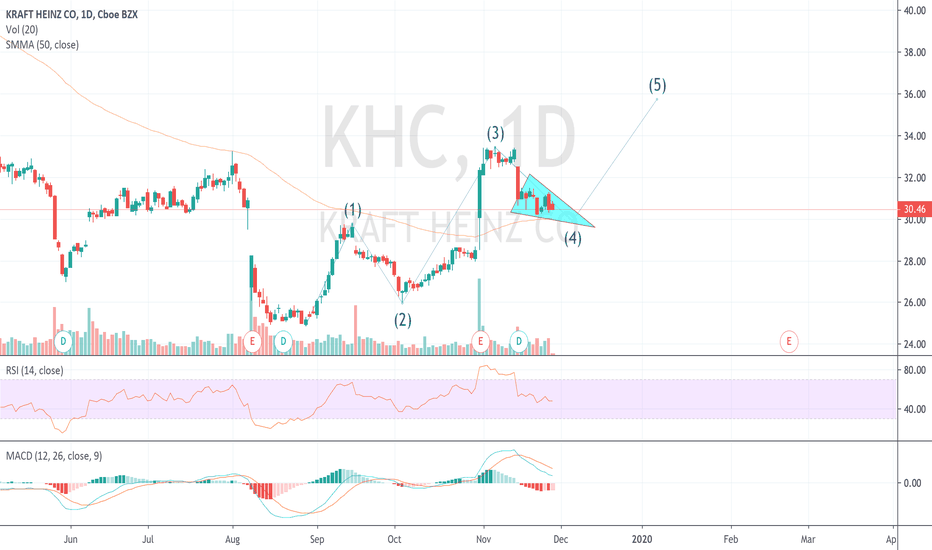
KHC - Potential 5th Wave Long Swing Trading OpportunityUsing our Elliott Wave Indicator Suite for the TradingView Platform we have identified a potential Long 5th Wave Swing Trading Opportunity for KHC on the Daily time frame . The 5th wave move in an elliottwave sequence is the highest probability move.
The wave 4 pull back has found support in the Amber zone of our probability pullback zones, which represents an 80% probability that our automated 5th wave target zone, in blue on the chart, will be hit.
We see yellow dots formed in the overbought zone on our special False Breakout Stochastic indicator, which signals strong Bullish momentum. When, during a wave 4 pullback, the stochastic pulls back against these false break out dots and crosses in the oversold zone, there is a high probability the stocks price action will resume the overall bullish trend .
We also measure the wave 4 behaviour with our Elliottwave oscillator, which has pulled back within our pre-determined zone.
So overall we have identified, using our Elliott Wave Indicator suite for TradingView, a high probability long swing trading opportunity for KHC , Daily Time Frame , with the following entry strategy:
Long entry through $31.63
Stop Loss $29.98
Target $34.50
Giving a Risk to Reward of 1:1.6
Learn more about our Tradingview indicator suites by watching the video tours >>HERE<<
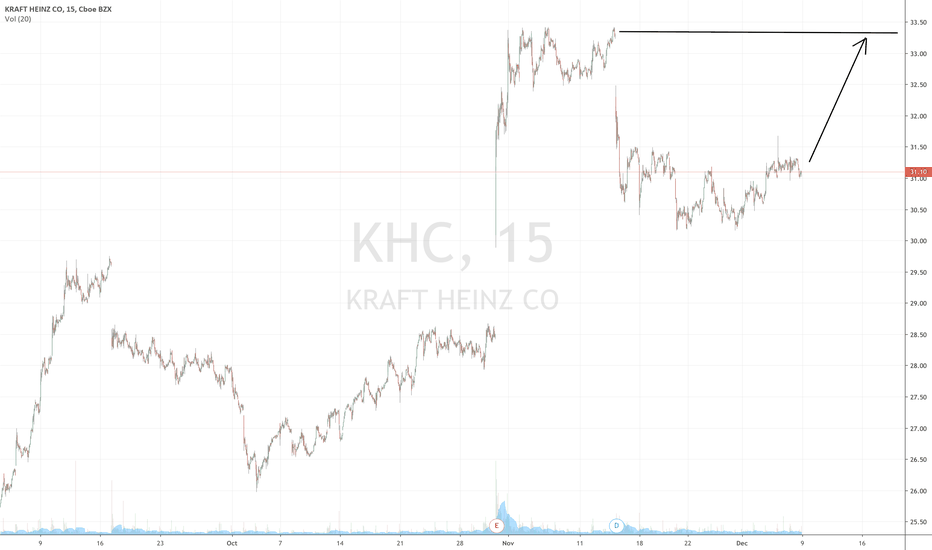
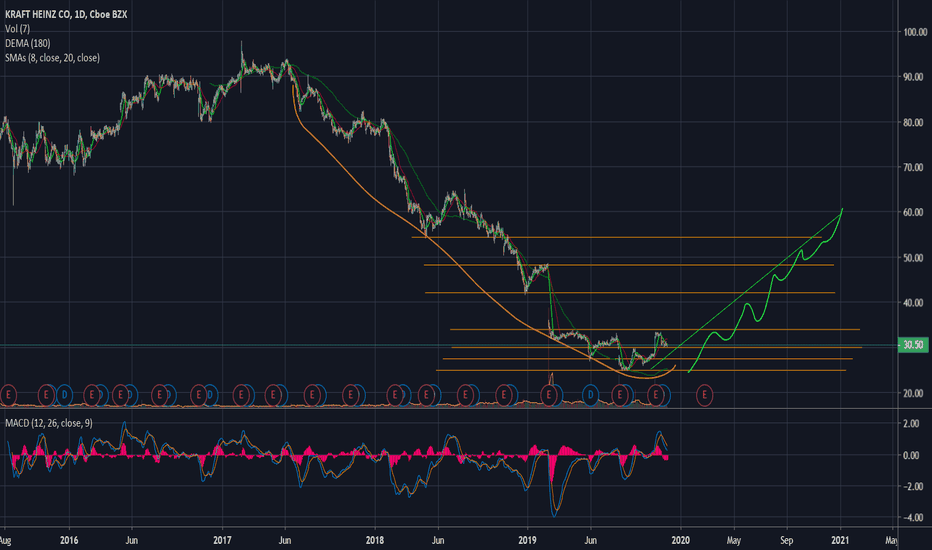
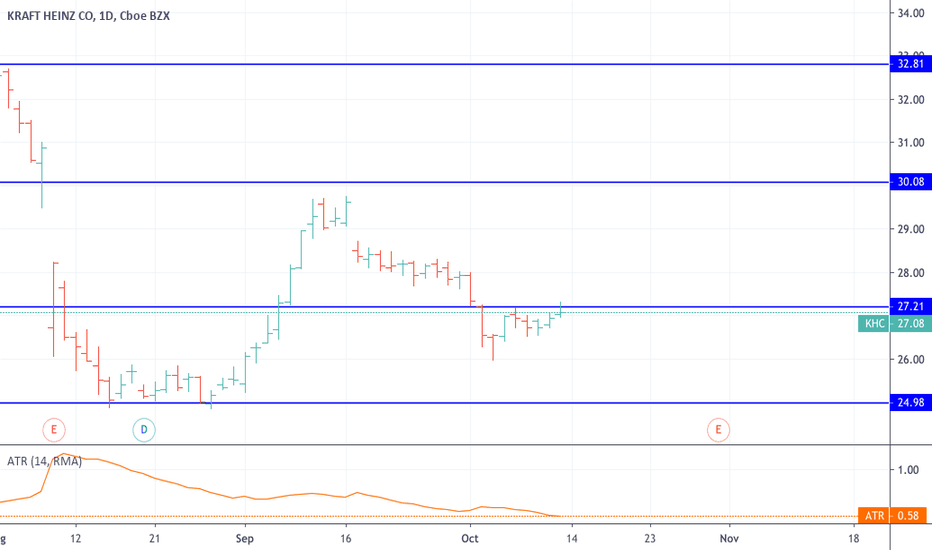
KHC Reversal?Christmas shopping might just be around the corner, waiting to see conformation will probably be a longer waiting game for this one. 180 EMA is looking better but we'll have to stay and see where this goes, dividend is good. Keeping on eye on this for now, bullish so far based on what it's show the past 3 months
The short term market consensus for Kraft Heinz Co(KHC)
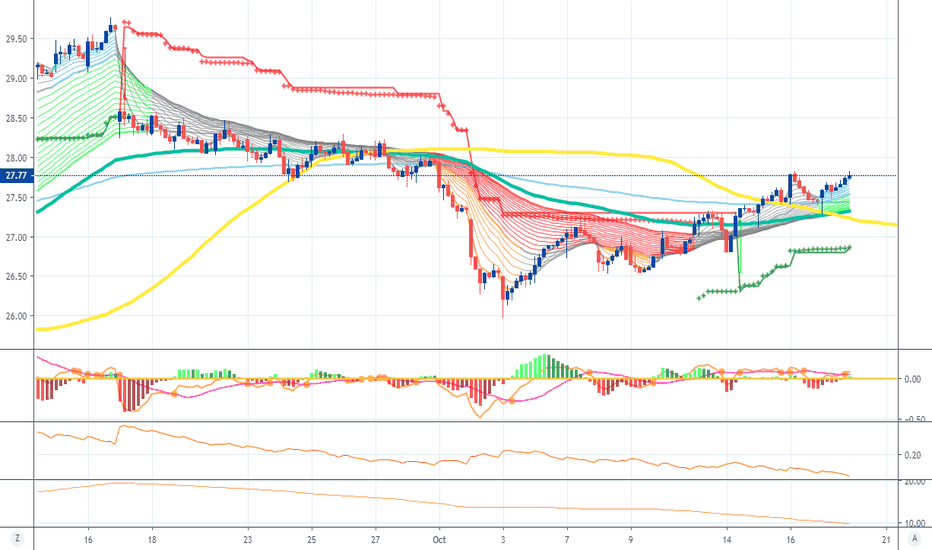
The short term market consensus for Kraft Heinz Co(KHC) have change to Bullish as at October 17,2019
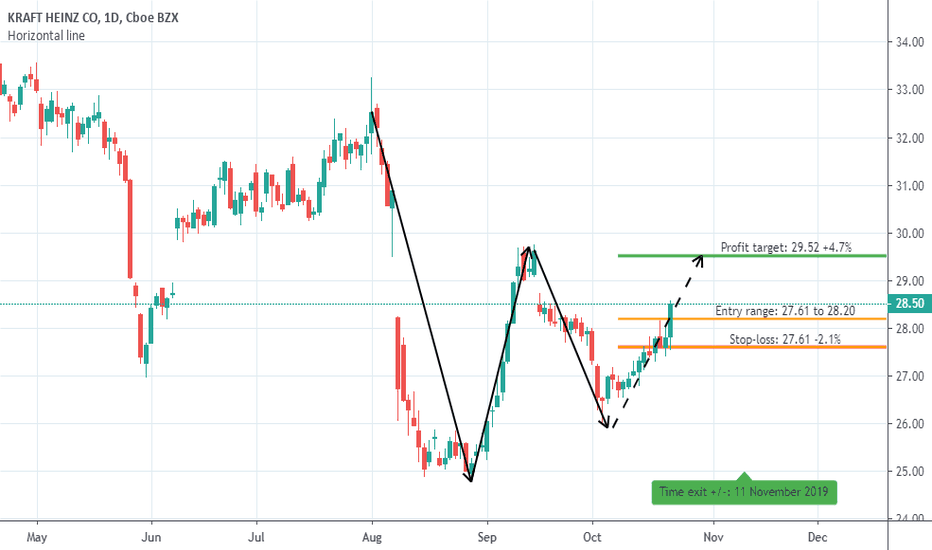
We will execute the following trade:
Global Entry Signal: Buy @ $27.77
Global Stop Loss:@ $25.58
Global Target Profit:@ $33.84
Global Trade Management Strategy: We will applied the Global Trailing Stop System for Global Trading Strategy #4
Trading is risky
There is a substantial risk of loss in futures and forex trading. Online trading of stocks and options is extremely risky. Assume you will lose money. Don't trade with money you cannot afford to lose.
KHCKHC’s innovation outlook is neutral based on a current score of 34 out of 99, underperforming sector average. Jobs growth over the past year has decreased and insiders sentiment is neutral. KHC is an Average Performer in terms of sustainability. It is most exposed to Mondelez International, Inc. as its supplier. Over the past 4 quarters KHC beat earnings estimates 2 times and it pays dividend higher than its peers.
For more analysis and articles visit our website .
