7/28/25 - $lulu - and goodbye7/28/25 :: VROCKSTAR :: NASDAQ:LULU
I like it
Apparently i can't post my thoughts anymore w/o it being flagged. so what's the point?
And i don't play stupid games and win stupid prizes... so goodbye public notes. ez decision.
Also... purely technical analysis will go the way of AI. So beware. Learn to think independently without just drawing lines on charts like 99.999% of content here. there r other places where people post more thoughtful fundamental analysis.
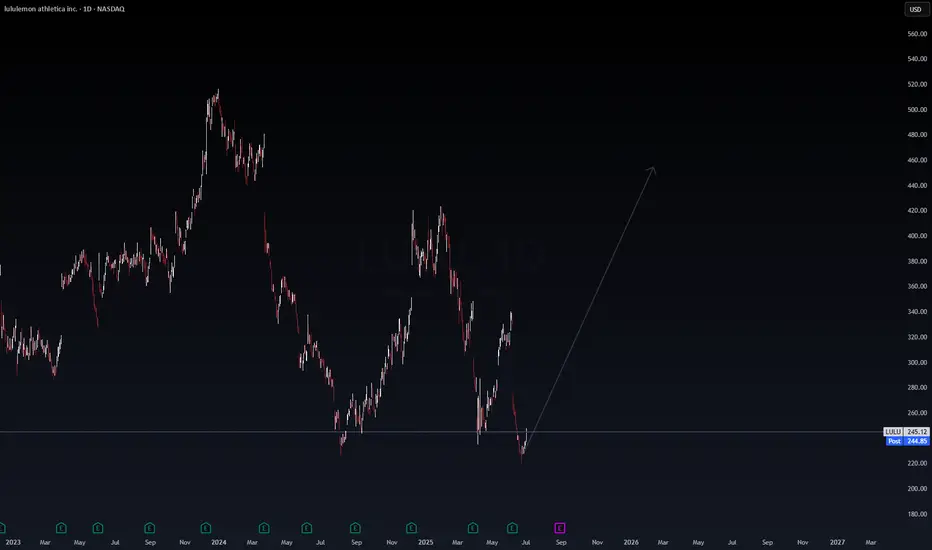
in the meanwhile this is the chart i thought might be helpful for anyone looking at $lulu. i literally post this for the last time... because, well, i think it's a helpful data pt.
the chart i'm trying to post now the 3rd time...
V
LULU trade ideas
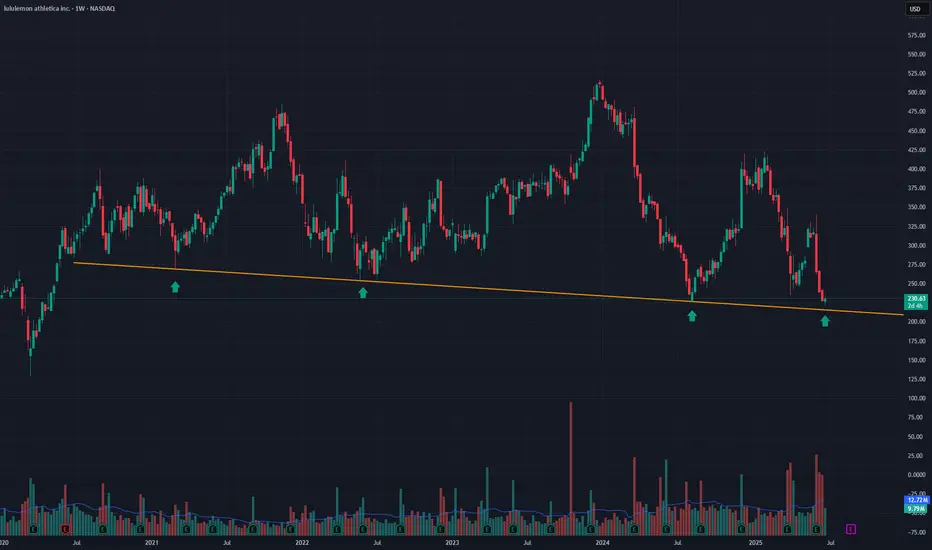
LULU into supportLulu is on sale as its just come into an area it has only sold at, 3 other times out of the past 5 years. As you can see by the Orange line, LULU has been holding this area of support for the past 5 years. This is a great buying opportunity. A close below the line on a weekly basis would stop out of the trade
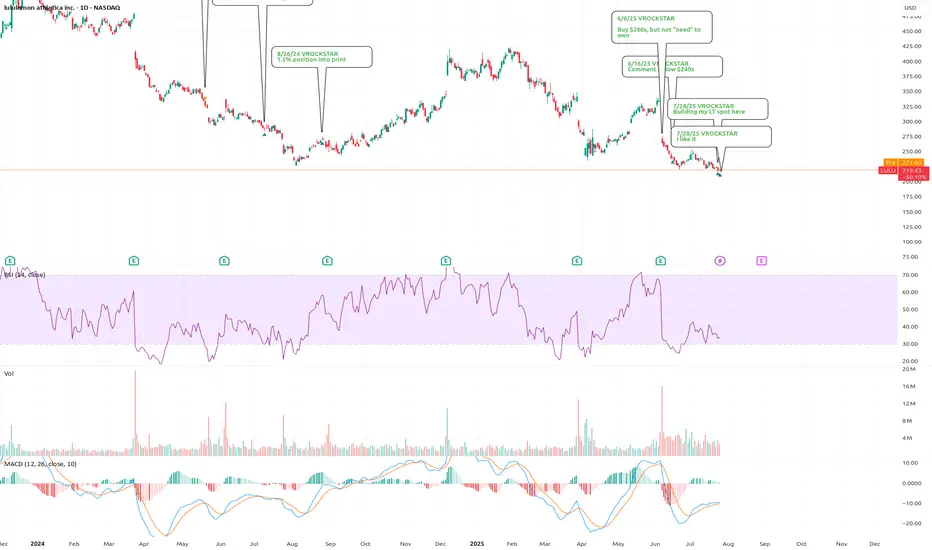
Trading stocks using Dr. Elder's "Three Screen Method"The first thing I do is check the weekly chart. Here I see excellent price divergence relative to the MACD indicator
Then I switched to the daily chart and saw the same excellent divergence as on the weekly chart.
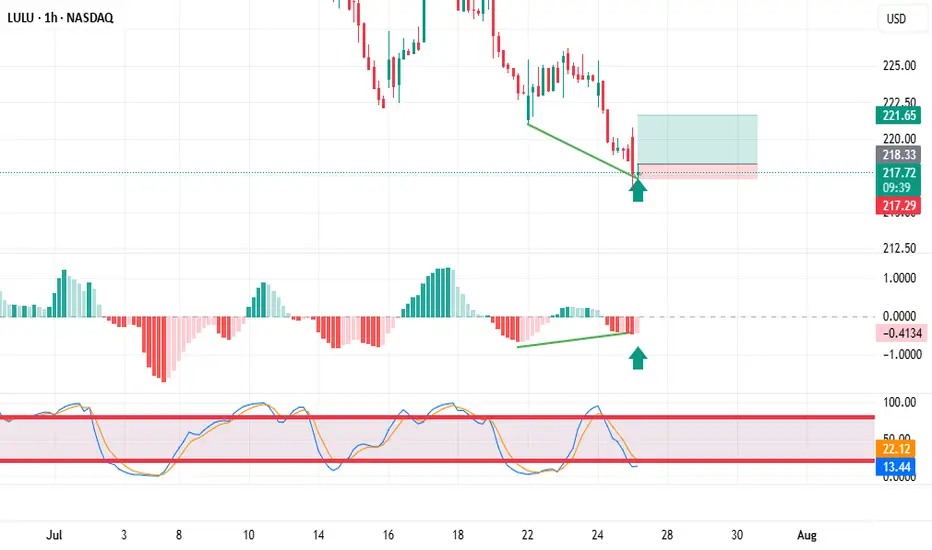
The hourly chart also showed excellent divergence. placed a pending buy order above the candle marked with an arrow.
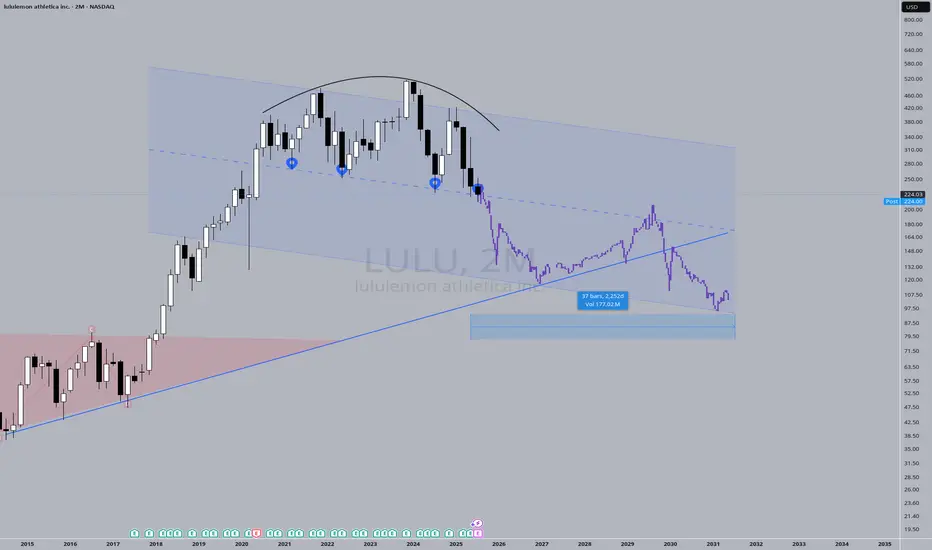
Mega-ultra macro LULU takePrice action has "knocked" on the support door FOUR times. It's got to give sometime soon. Fashion brands come and go, I think LULU has had it's time to shine, now it's time for another brand to emerge and take its place.
I say "Mega-ultra macro" to recognize the absurdity of a 6-year guess. The probability of accurately predicting price action for a 6-year window is low. But here's a prediction anyway.
LULU Weekly Bearish Setup – 7/21/2025
📉 LULU Weekly Bearish Setup – 7/21/2025
💥 RSI Breakdown | 📉 Institutional Bearish Flow | 💰 Premium Risk-Reward
⸻
🧠 Multi-Model Consensus Summary
🟥 RSI: Daily 36.1 / Weekly 29.9 – Bearish Momentum Confirmed
📉 Volume: Consistent sell pressure across models
📊 Options Flow: Mixed signals, but bearish price action dominates
⚠️ Conflicting flow ≠ bullish reversal… yet.
⸻
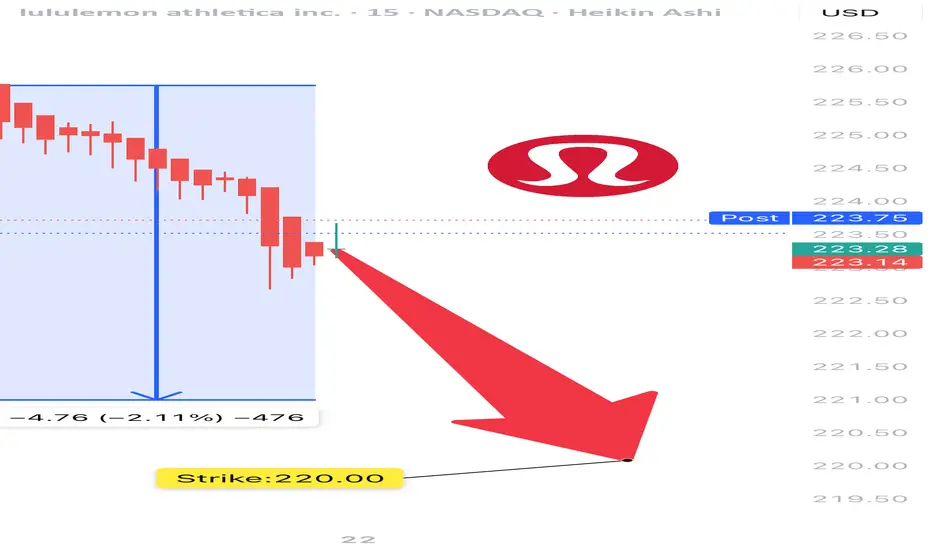
🎯 TRADE IDEA – LULU $220 PUT
💥 Direction: Bearish
🧾 Strike: $220 Put
📆 Expiry: July 25, 2025
💵 Entry: $1.33
🛑 Stop: $0.80 (≈40% loss cap)
🎯 Target: $1.95 (≈50% gain)
📈 Confidence: 65%
⏰ Entry Time: Market Open (Monday)
⸻
📎 Why it Works:
✅ RSI Collapse across timeframes
✅ Bearish price action confirmed by volume
✅ Favorable IV and gamma setup
🚫 No trade suggested by some models = opportunity in the noise
⸻
📊 TRADE_DETAILS
{
"instrument": "LULU",
"direction": "put",
"strike": 220.00,
"expiry": "2025-07-25",
"confidence": 0.65,
"profit_target": 1.95,
"stop_loss": 0.80,
"size": 1,
"entry_price": 1.33,
"entry_timing": "open",
"signal_publish_time": "2025-07-21 12:45:12 EDT"
}
⸻
🔥 #OptionsTrading #LULU #BearishSetup #WeeklyTrade #PutOptions #TradingStrategy #MarketMomentum #RSI
📍 Save this setup, share with your trading group, and set alerts!
Are Bulls Quietly Loading Up on LULU?Trade Summary 📝
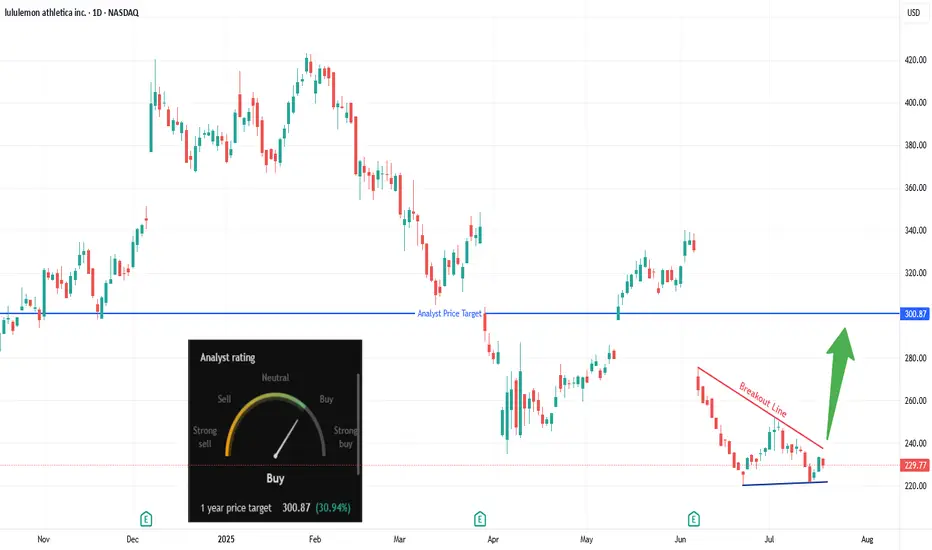
Setup: Descending wedge forming after sharp drop; price testing breakout line.
Entry: Above $240.
Stop‑loss: Below $220 swing low/support.
Targets: $260 , $293–$301 (analyst target).
Risk/Reward: ~3:1 (tight stop, multi-level upside).
Technical Rationale 🔍
Key Signal #1: Descending wedge/bullish reversal pattern; oversold bounce.
Key Signal #2: Bullish divergence forming on recent lows; higher low established.
Context: Daily chart; aggressive sellers losing momentum as wedge tightens.
Catalysts & Context 🚦
Recent gap down created potential “magnet” for gap fill upside.
Surge in unusual OTM call buying last week hints at speculative bullish positioning.
Analyst 1-year target: $300.87 (+30% upside); rating upgraded to Buy.
Watching for sector rotation into consumer discretionary/retail names.
Trade Management Plan 📈
Entry: Only on daily close above $240 breakout line.
Stop‑loss: Initial below $220; trail to breakeven if $260 target hits.
Scaling: Trim at $260, hold partial for $293–$301 extension.
What’s your view? Are you watching LULU? Comment below or vote:
🔼 Bullish
🔽 Bearish
🔄 Waiting for confirmation
*** Follow us now to ensure you don't miss the next big setup ***
Disclaimer ⚠️: Not financial advice. Trade at your own risk.
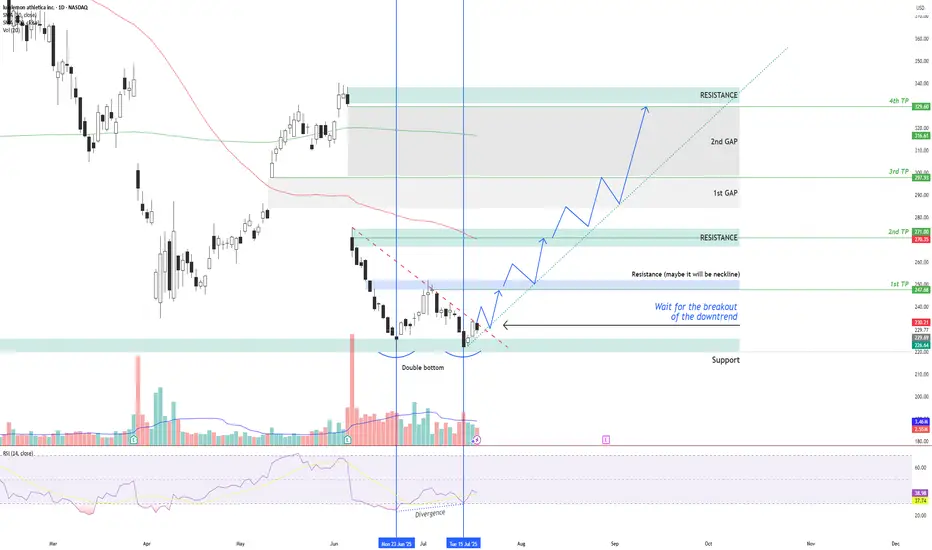
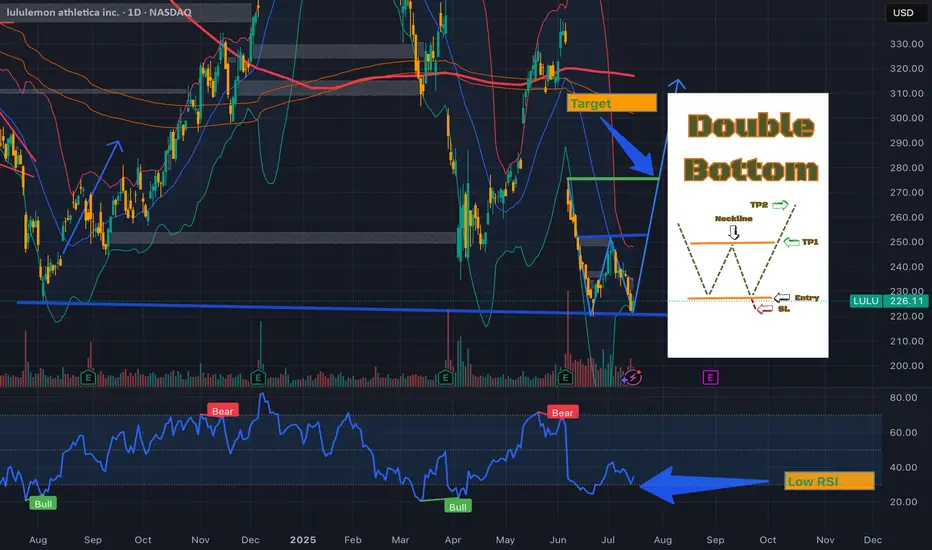
LULU – Double Bottom + RSI Divergence: Multi-Target Setup After LULU NASDAQ:LULU is showing signs of a potential bullish reversal after forming a double bottom structure around the $220 support zone , along with a bullish divergence on the RSI indicator.
Two vertical lines highlight the divergence: while price made a lower low, RSI formed a higher low – indicating a possible momentum shift in favor of buyers.
Currently, price is moving just below a descending trendline, which has been acting as dynamic resistance. The first condition for a long setup is a confirmed breakout above this trendline followed by a successful retest. If that happens, an entry can be considered .
📌 Entry Plan:
Entry: After a breakout and retest of the descending trendline.
1st TP: ~$247 — This level coincides with a local resistance zone, which may act as a neckline of the double bottom.
If price breaks above $247 and retests, it confirms bullish continuation.
📈 Target Structure:
2nd TP: ~$271 — next major resistance zone.
3rd TP: ~$297 — aligns with the first major gap zone.
4th TP: ~$329 — final gap resistance from previous sell-off levels.
This structure allows for scaling into the trade in stages — each breakout and retest offers a new confirmation and extension to the next target zone.
Volume analysis, price action, and RSI momentum all support the probability of a trend reversal — but confirmation is key.
Not financial advice. Always conduct your own research and risk management.
Yoga Pants, Tariffs, and Upside: The $LULU BetLululemon NASDAQ:LULU - My Investment Thesis 👖
Hey team,
I've been keeping an eye on NASDAQ:LULU for a while, and I'm finally going to pull the trigger.
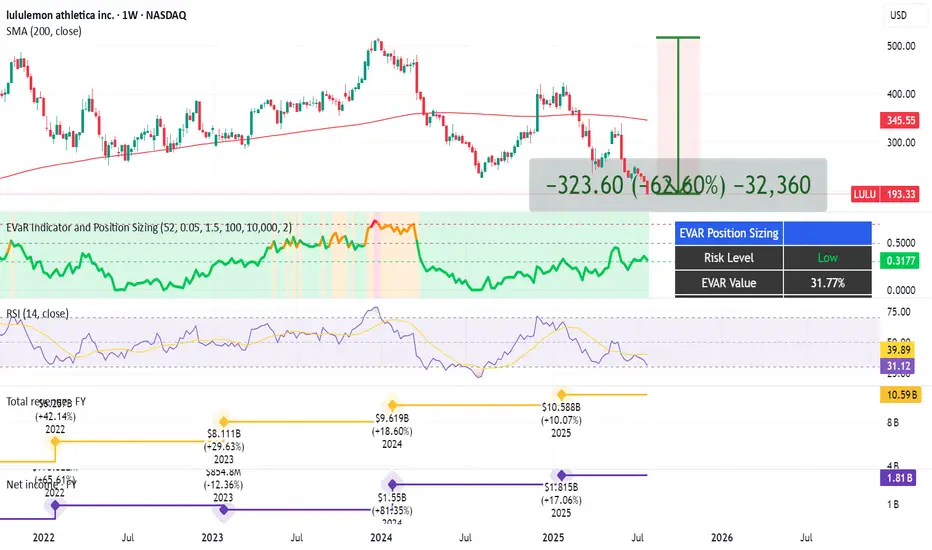
In this market of overhyped MAG 7 stocks, Lululemon dropped 62% since its high in Dec. 2023 until now.
Here's why I'm into LULU:
Revenue has been growing every year for 5 years. Still, the stock is at its lowest in 5 years.
Growth has been slower in the US but good in Asia.
Net income has also been growing over the last 3 years.
P/E ratio is at 13, the lowest in many years.
Stock is also beat up because of the tariffs.
Analysts at Morningstar put its fair value at $305 (now $193, giving it an upside of 58%).
Product Innovation: New franchises like Daydrift, Shake It Out, and Align No Line have been well-received and will continue to drive sales.
Lululemon recently announced an expansion into India for 2026, with plans to open a physical store and a partnership with Tata CLiQ, the e-commerce arm of India’s largest business conglomerate, Tata Group. India can be a huge market for Lulu.
There's also intense competition and margin erosion.
Saying this, I kinda see people around me less excited about Lululemon products.
Technical Analysis:
My EVaR - Entropic Value at Risk - is in a low risk area.
RSI is oversold.
Price has been under the 200 MA for too long.
I'm going to proceed with caution on this one, and allocate approximately. 0.5% of my portfolio into it.
Quick note: I'm just sharing my journey - not financial advice! 😊
Going to HonoLULULululemon shares fell almost 20% after the company warned tariffs and consumer caution would hurt profits.
Here are some of my bold statements about this:
Tariffs are sector-wide, not Lululemon-specific
Nearly all premium athletic and apparel brands—Nike, Adidas, Under Armour, VF Corp (The North Face), Alo Yoga, Vuori—rely on Asia-based manufacturing, especially China and Vietnam.
This means everyone faces the same cost inflation, and no brand gains a unique cost advantage from the tariff hit.
Lululemon has superior margin cushion
LULU has ~58–59% gross margins, which is well above peers like Nike (~44%) or Under Armour (~46%).
This gives Lululemon more flexibility to absorb or pass on costs than competitors.
Loyal customer base allows for price elasticity
Lululemon’s brand power, community focus, and premium positioning give it pricing power. Consumers are often less price-sensitive.
Modest price increases (e.g. $5–10 on leggings) may not meaningfully affect demand—especially compared to fast fashion retailers.
And some points about performance of the business:
Forward P/E now ~18×, down from its historical 30–35× range—this marks a meaningful valuation discount relative to its growth profile
International comparable sales surged: +39% in China, +25–36% in rest-of-world markets recently
Executed ~$1 billion in stock repurchases recently, with ample remaining capacity—supports EPS and investor confidence
Multiple firms (Bernstein, Raymond James, TD Cowen, Needham, Baird) maintain Buy/Outperform ratings with targets in the $420–475 range
For LULU´s 1Q official report visit: corporate.lululemon.com
LULU bullyou see it, we all see it. triple bottom with class A divergence and clear TP and SL, good luck!
Double Bottom Pattern on LULU“LULU is forming a potential Double Bottom on the daily chart, with two lows around $222 (support) and a neckline at $252. The pattern suggests a bullish reversal if the price breaks above $252 with strong volume. RSI is showing bullish divergence, and the 50-day MA is converging near the neckline, adding confluence. Target: $275.50 (pattern height added to neckline). Stop loss below $215 for a 1:2 risk-reward. Watching for a breakout with increased volume to confirm.”
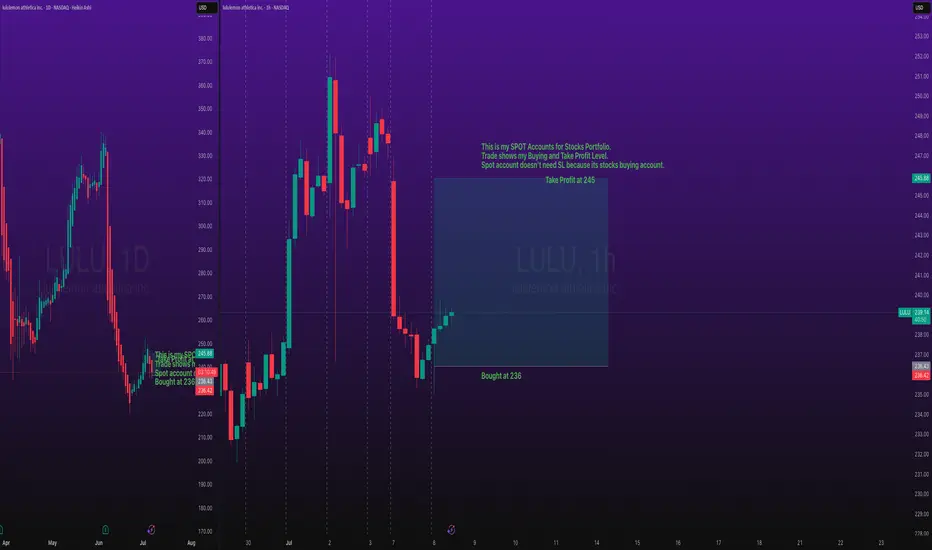
Stocks SPOT ACCOUNT: LULU stocks my buy trade with take profitStocks SPOT ACCOUNT: NASDAQ:LULU stocks my buy trade with take profit.
Bought at 236 and take profit at 245.
This is my SPOT Accounts for Stocks Portfolio.
Trade shows my Buying and Take Profit Level.
Spot account doesn't need SL because its stocks buying account.
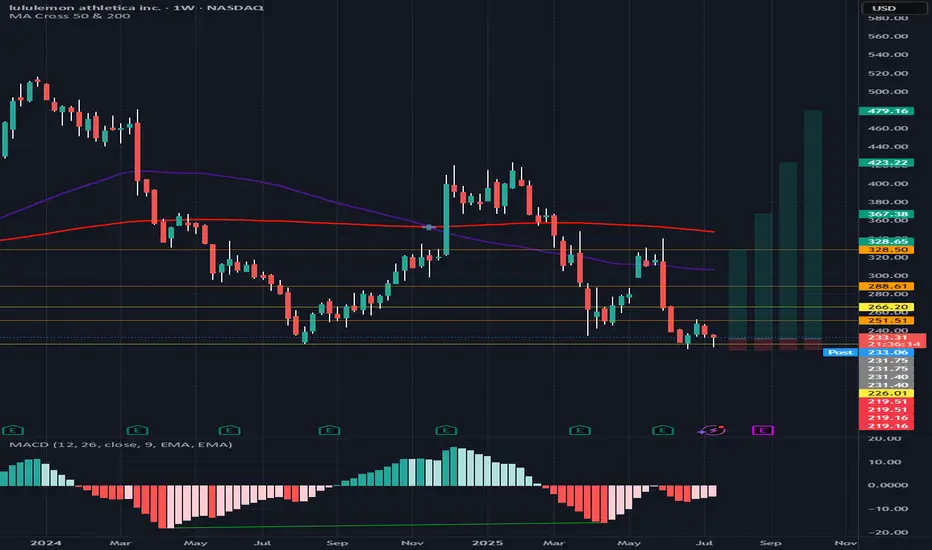
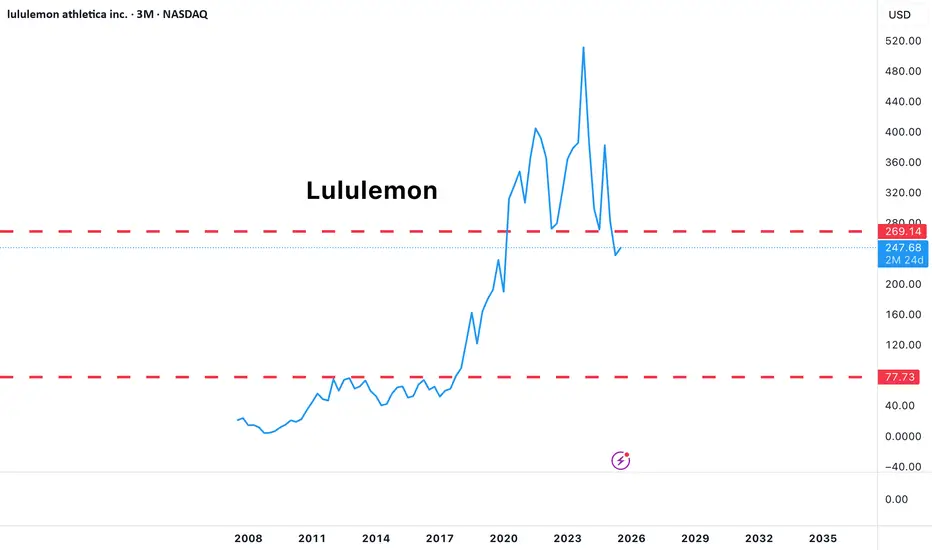
Higher end consumption has officially broken downThe charts of Lululemon, Louis Vuitton, Restoration Hardware & Target are showing significant signs of weakness as all of them have broken important 3M closing support lows. Regardless of what you hear, these charts show that the high end consumer has been slowing consumption for quite some time and with the June 30, 2025 quarter close all of them have broken below key 3M support zones.
Could we see a break down failure this quarter in which these charts reverse directions and go UP? Only time will tell but if they don't watch out below as the next areas of major support for some of these charts are much lower.
Although all of these are very strong companies with strong balance sheets, I will not go long these charts until I see confirmation of a breakdown failure and a 3M closing above the key support areas.
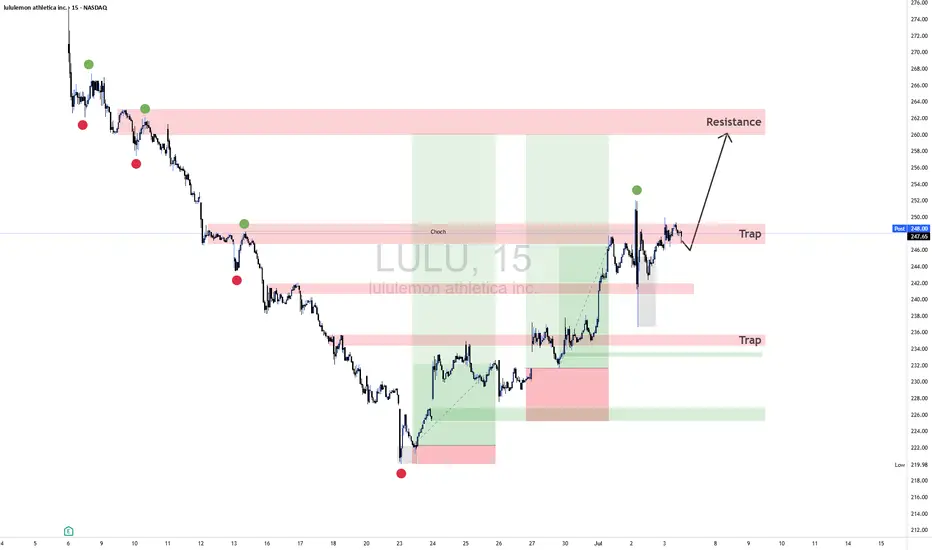
LULU LongMarket Structure Analysis
Break of Structure (BOS): A clean BOS was confirmed following a strong bullish impulse off the low at $219. This suggests a transition from a bearish trend into potential accumulation.
Higher Lows and Re-accumulation: After the BOS, price is forming a clear series of higher lows, indicating sustained demand and institutional interest. Each retracement is being absorbed, suggesting buyers are active.
Short-Term Bullish Target: The current structure points toward a bullish continuation toward the $260–262 zone, where previous structural inefficiencies and distribution events occurred.
Internal Pullbacks: Shallow pullbacks are developing within clean structural ranges, showing signs of controlled re-entries rather than panic-driven profit-taking.
🔹 Liquidity Landscape
Sell-side Liquidity Cleared: The deep wick near $219 represents a liquidity sweep, likely engineered to remove weak longs and activate institutional buy programs.
Buy-side Liquidity Above: There’s a dense cluster of untapped liquidity between $258–262, likely to be targeted before any major shift occurs. These levels also align with where many participants were previously trapped.
Trap Zones Below: The green areas highlight zones where retail might look for reversals. Smart money often uses these zones for re-accumulation or inducement.
🔹 Risk Management Considerations
Entry: Long positions are best taken on confirmation within higher low pullbacks. Avoid chasing price into premium zones.
Stop Placement: Beneath the most recent higher low or liquidity sweep to avoid being taken out by engineered wicks.
Targeting: Conservative traders may target $258; aggressive bias can push toward $262 zone.
Position Sizing: Maintain strict risk control as price approaches higher timeframe zones where momentum may shift.
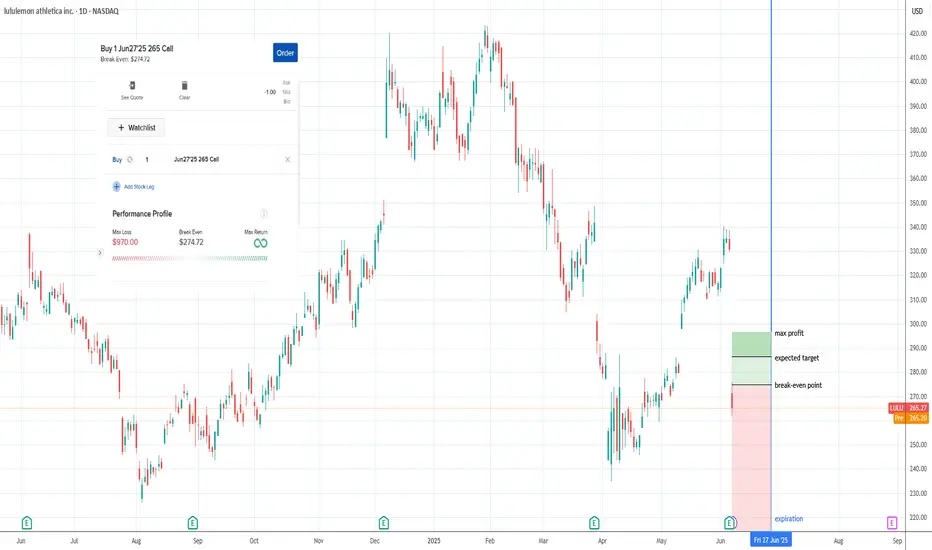
Looking for a leap on LULU. OptionsMastery:
🔉Sound on!🔉
📣Make sure to watch fullscreen!📣
Thank you as always for watching my videos. I hope that you learned something very educational! Please feel free to like, share, and comment on this post. Remember only risk what you are willing to lose. Trading is very risky but it can change your life!

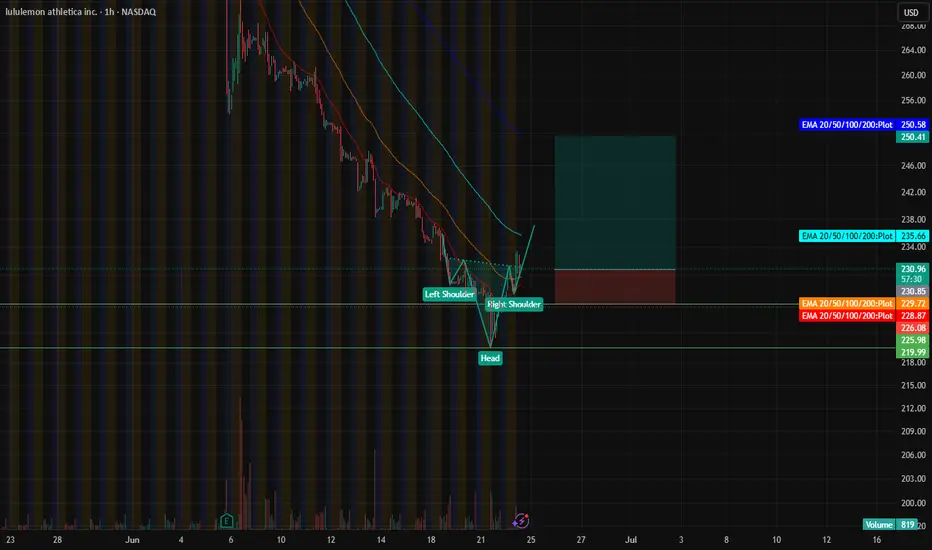
Lulu Long15-Minute Chart: Head and Shoulders Pattern
A head and shoulders pattern has formed on the 15-minute chart, signaling a potential reversal from a short-term downtrend, suggesting bullish momentum may be building.
Daily Chart: Hammer Candlestick & RSI Oversold
The daily chart shows a hammer candlestick pattern, indicating strong buying pressure at lower levels. Additionally, the RSI is in oversold territory, reinforcing the likelihood of a near-term rebound. These factors suggest a favorable setup for a long position in LULU.
Trade Recommendation
Consider initiating a long position in LULU based on the bullish signals across multiple timeframes.
Entry:231
Stop Loss (SL): Set at $226 (aligned with August 2024 resistance) or $219 (low of the hammer candlestick) for tighter risk management.
Take Profit 1 (TP1): Target $250–$252, corresponding to the 200-period EMA on the 1-hour and 4-hour charts, a likely resistance zone.(a 1:4 risk and reward ratio)
Take Profit 2 (TP2): Target $334, aiming to fill the gap from the last earnings report, with potential upside if tariff concerns ease.
Rationale
The combination of a reversal pattern on the 15-minute chart, a bullish hammer on the daily chart, and an oversold RSI supports a bullish outlook. Risk-reward ratios are attractive with defined stop-loss levels and realistic profit targets, contingent on market conditions and macroeconomic factors like tariff developments.
LULU – Compression Complete? Reversal in Progress | WaverVanir PTicker: NASDAQ:LULU
Timeframe: 1D (Daily)
Posted by: WaverVanir International LLC | VolanX DSS Framework
🧠 Technical Thesis:
LULU is showing signs of a potential macro reversal after a sharp capitulation and retest of key demand (~$235–240). The double-bottom formation and absorption at prior support suggest smart money accumulation.
📌 Trade Plan:
Entry Zone: $237–245
Target 1: $310 (Risk:Reward ~2.5R)
Target 2: $385
Target 3: $460+ (ATH retest zone)
Invalidation: Daily close below $228 (breakdown continuation)
🧭 DSS Confluence (VolanX Modules):
✅ Smart Money Concepts (SMC): Displacement followed by BOS (Break of Structure)
✅ Volume Profile: Major acceptance above $240
✅ Fibonacci Cluster: 0.618 retrace aligns with breakout targets
⚠️ Earnings Watch: Next ER marked – high volatility expected
📊 Probability Estimate:
Reversal/Breakout (Long Bias): 72%
Chop/Retest: 18%
Breakdown Continuation: 10%
📎 Macro Context:
With consumer discretionary stabilizing and earnings revisions improving, LULU may benefit from a re-rating cycle, particularly if macro tailwinds (Fed cuts, soft landing) persist through Q3–Q4 2025.
🚨 Disclaimer:
This post is for informational and educational purposes only and does not constitute financial advice. WaverVanir International LLC is not liable for any trading decisions based on this content. Always do your own research.
✅ Follow us for more DSS-backed setups.
#WaverVanir #LULU #SmartMoneyConcepts #VolanX #TradingView #OptionsFlow #VolumeProfile #DSS #InstitutionalEdge
LULU Daily | Smart Money + Fibonacci Reversal Setup📢
📆 July 1, 2025 | ⏱ 1D Chart
🔹 SMC + Volume + FVG Confluence
🔹 Powered by WaverVanir DSS Protocol
📍 Context:
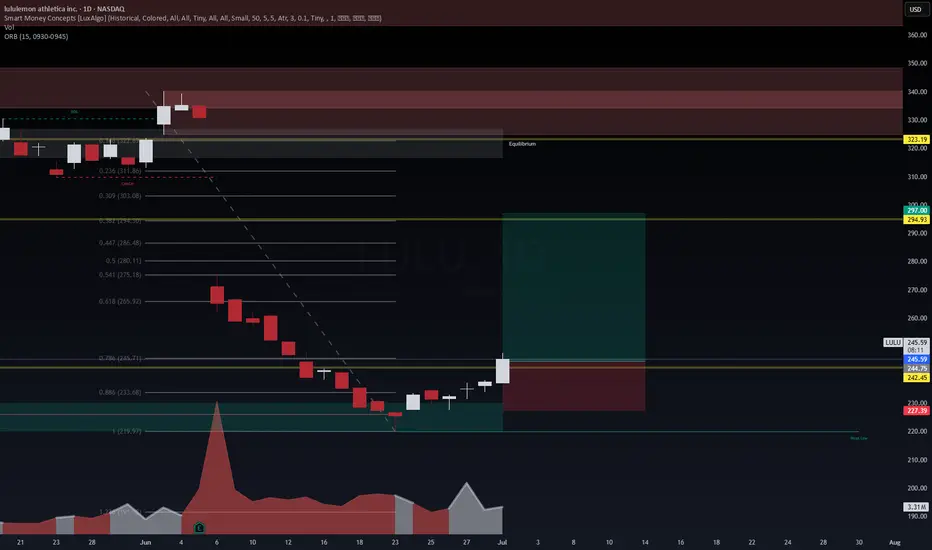
LULU printed a strong bullish engulfing off the 0.786–0.886 Fibonacci retracement zone, following a BOS and liquidity sweep at $233.
Volume surged near the bottom — potential institutional absorption.
📊 Trade Plan:
🟩 Entry Zone: $244.75–$245.50
🟥 Stop Loss: $227.39
🎯 Targets (Probability-Weighted):
T1: $265.92 – Minor OB + 0.618 Fib (🎯 84%)
T2: $294.93 – Imbalance Fill + ORB Target (🎯 68%)
T3: $323.19 – Macro EQ Zone (🎯 42%)
📈 Reward-to-Risk: ~3.0+
🛡 Risk invalidated on daily close below $227.
📌 Notes:
Expecting rotation back toward equilibrium if momentum persists. Scaling partials at each TP level. Watching VWAP slope and intraday ORB behavior for momentum confirmation.
💬 Let me know if you're in this setup —
#LULU #SmartMoney #FVG #SMC #WaverVanir #TradingStrategy #OrderBlocks #VWAP #Fibonacci #BullishEngulfing #LiquiditySweep
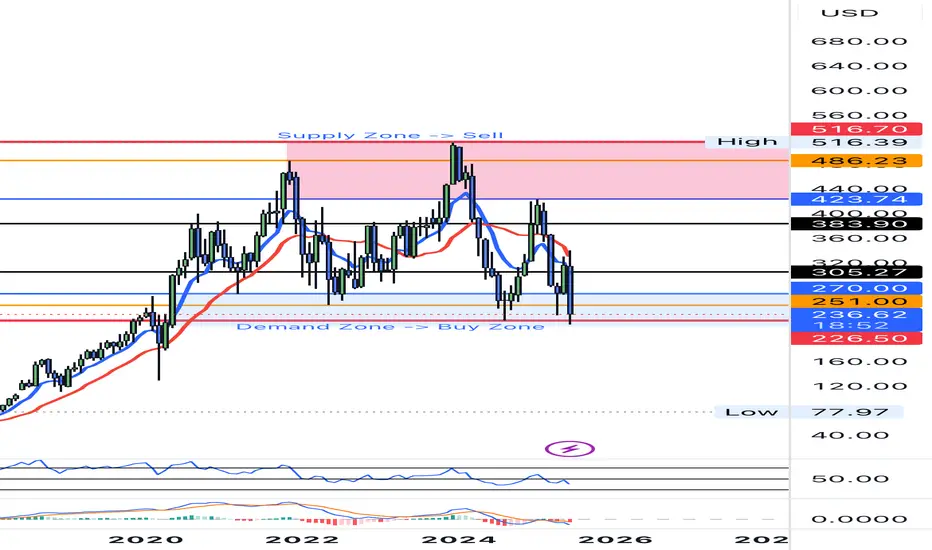
Lululemon Chart Breakdown Lululemon (LULU) Chart Breakdown
Buy around $200-$250 Dollar Levels
Sell/TP: Above $275-$300
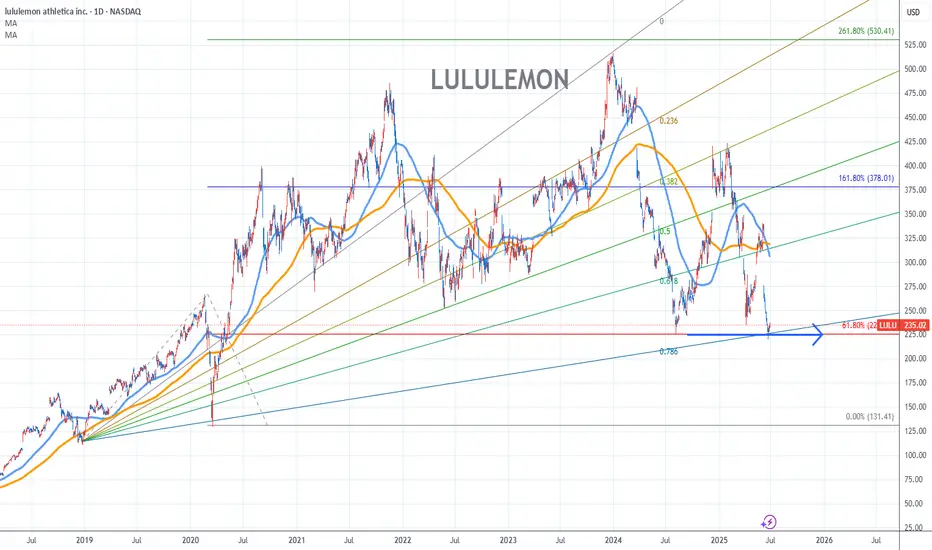
Lululemon Stock Chart Fibonacci Analysis 062725Trading Idea
1) Find a FIBO slingshot
2) Check FIBO 61.80% level
3) Entry Point > 225/61.80%
Chart time frame:D
A) 15 min(1W-3M)
B) 1 hr(3M-6M)
C) 4 hr(6M-1year)
D) 1 day(1-3years)
Stock progress:C
A) Keep rising over 61.80% resistance
B) 61.80% resistance
C) 61.80% support
D) Hit the bottom
E) Hit the top
Stocks rise as they rise from support and fall from resistance. Our goal is to find a low support point and enter. It can be referred to as buying at the pullback point. The pullback point can be found with a Fibonacci extension of 61.80%. This is a step to find entry level. 1) Find a triangle (Fibonacci Speed Fan Line) that connects the high (resistance) and low (support) points of the stock in progress, where it is continuously expressed as a Slingshot, 2) and create a Fibonacci extension level for the first rising wave from the start point of slingshot pattern.
When the current price goes over 61.80% level , that can be a good entry point, especially if the SMA 100 and 200 curves are gathered together at 61.80%, it is a very good entry point.
As a great help, tradingview provides these Fibonacci speed fan lines and extension levels with ease. So if you use the Fibonacci fan line, the extension level, and the SMA 100/200 curve well, you can find an entry point for the stock market. At least you have to enter at this low point to avoid trading failure, and if you are skilled at entering this low point, with fibonacci6180 technique, your reading skill to chart will be greatly improved.
If you want to do day trading, please set the time frame to 5 minutes or 15 minutes, and you will see many of the low point of rising stocks.
If want to prefer long term range trading, you can set the time frame to 1 hr or 1 day.
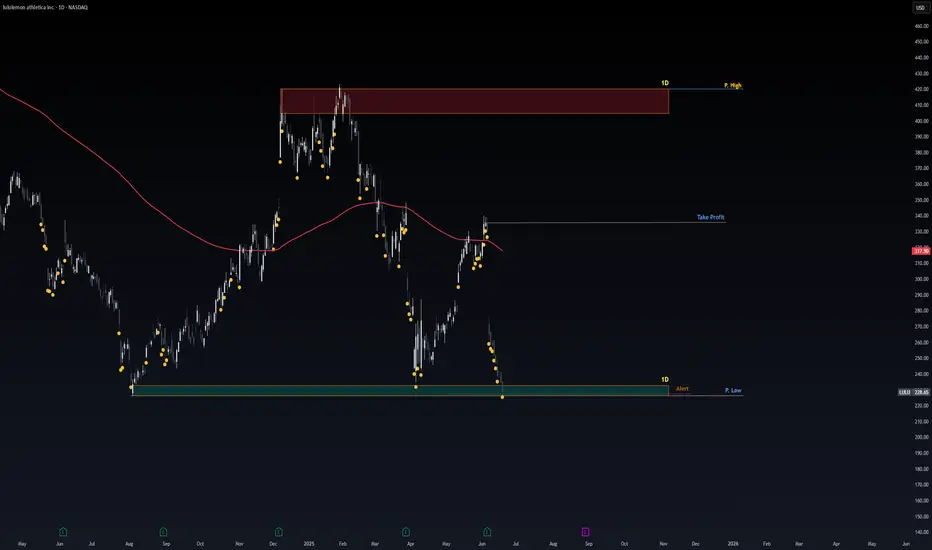
Safe Entry Zone LuLuStock current at SIGNIFICANT Support Level.
P.High's & P.Lows(Previous Highs & Previous Lows) acts as good Support and resistances levels.
1D Green Zone Is Buying Zone.
1D Red Zone is Selling Zone.
Take Profit Line is where you may secure Profit in case any selling Pressure showed-up near the Line it acts as Resistance level an dangerous Zone
In case Break Through red Zone stock will change to UP-Movement and Vice Versa.
Note: 1- Potentional of Strong Buying Zone:
We have two scenarios must happen at The Mentioned Zone:
Scenarios One: strong buying volume with reversal Candle.
Scenarios Two: Fake Break-Out of The Buying Zone.
Both indicate buyers stepping in strongly. NEVER Join in unless one showed up.
2- How to Buy Stock:
On 15M TF when Marubozu Candle show up which indicate strong buyers stepping-in.
Buy on 0.5 Fibo Level of the Marubozu Candle, because price will always and always re-test the imbalance.
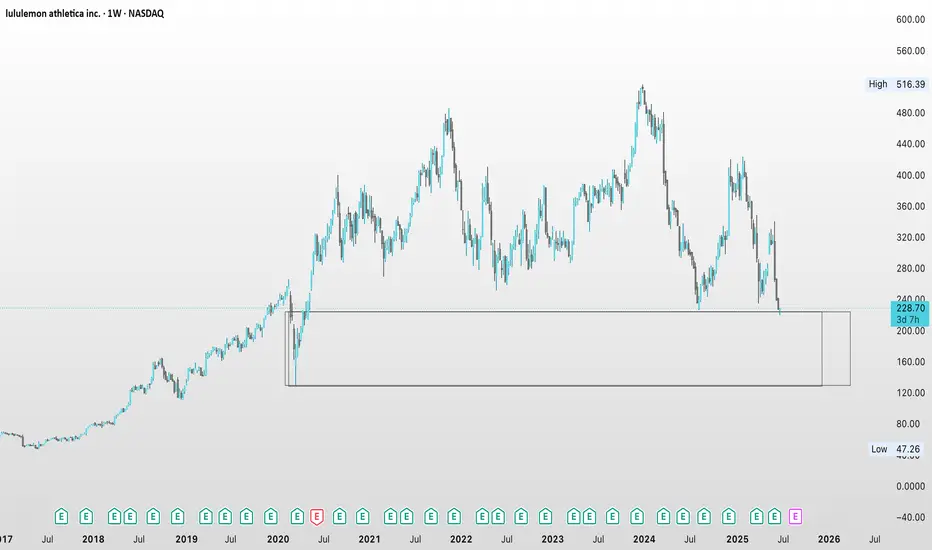
LULU investment ideaprice coming bck to 2020 prices,
mitigation POI at a deeep retracement
even a conservative reaction could go for imbalance
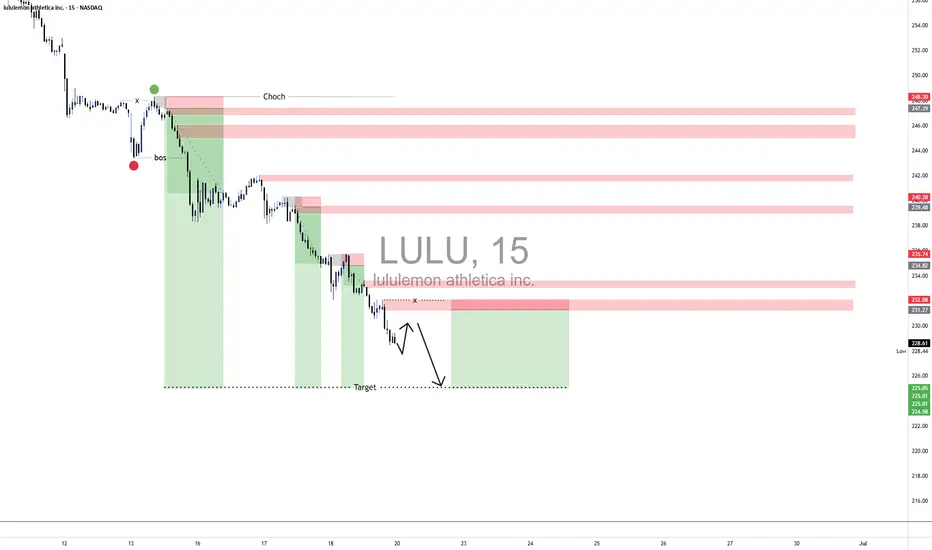
LULU 📉TechnicalAnalysis: LULU – 15-Min Chart (Short Bias)
On the 15-minute timeframe, LULU is currently forming a series of lower highs and lower lows, confirming a short-term bearish market structure. Price recently broke below a key intraday support zone near $243, which had previously held as a short-term demand area. This breakdown was followed by a weak bullish retracement, suggesting supply is in control.
The retracement failed to reclaim the previous structural break, forming what looks like a bearish continuation flag or supply retest, providing an ideal short entry opportunity.
Price is currently trading below the 50-period EMA, and momentum indicators are showing bearish divergence, with price attempting minor higher wicks while momentum (measured via RSI or MACD) continues to trend downward.
From a Smart Money Concepts (SMC) perspective, the internal structure shifted bearishly after a clear break of structure (BOS). Price is reacting to a prior liquidity sweep above $248 before dropping, showing signs of institutional distribution. That high can now be considered a short-term supply origin, and price continues to respect that imbalance.
🔻 Price Target: $225
The next key HTF (higher-timeframe) inefficiency zone lies near $225, aligning with:
Daily bullish OB that hasn’t been mitigated
Previous strong bounce zone
A potential magnet for resting liquidity
📊 Fundamentals Supporting the Bearish Move
Earnings Outlook & Valuation Concerns: LULU's most recent earnings beat expectations, but guidance was tepid, and margin compression was noted, especially on international expansion and inventory buildup.
Consumer Sentiment Shift: Discretionary spending has weakened post-COVID boom in premium apparel; market is rotating into staples and discount retail.
Technical Selloff in Growth Sector: Broader weakness in growth stocks and high-beta names following hawkish Fed commentary reinforces LULU’s downside risk.