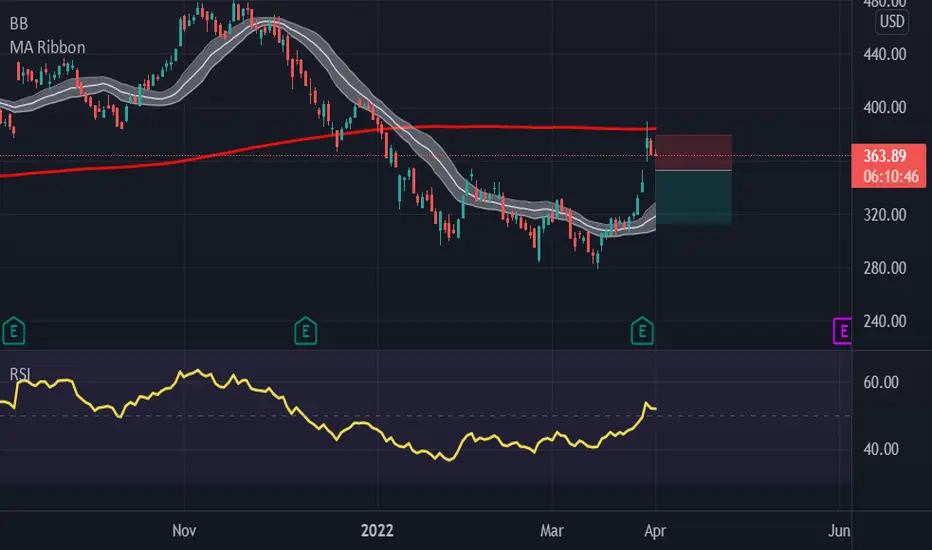
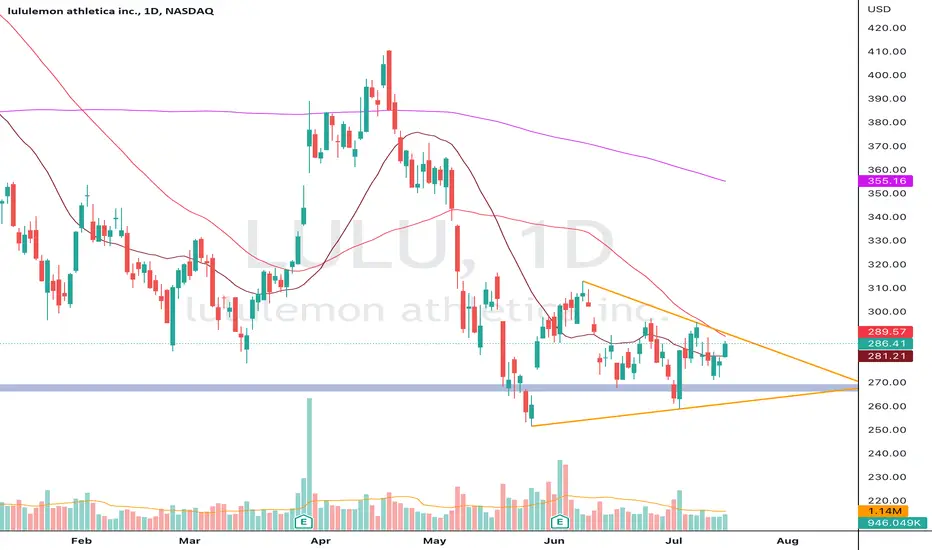
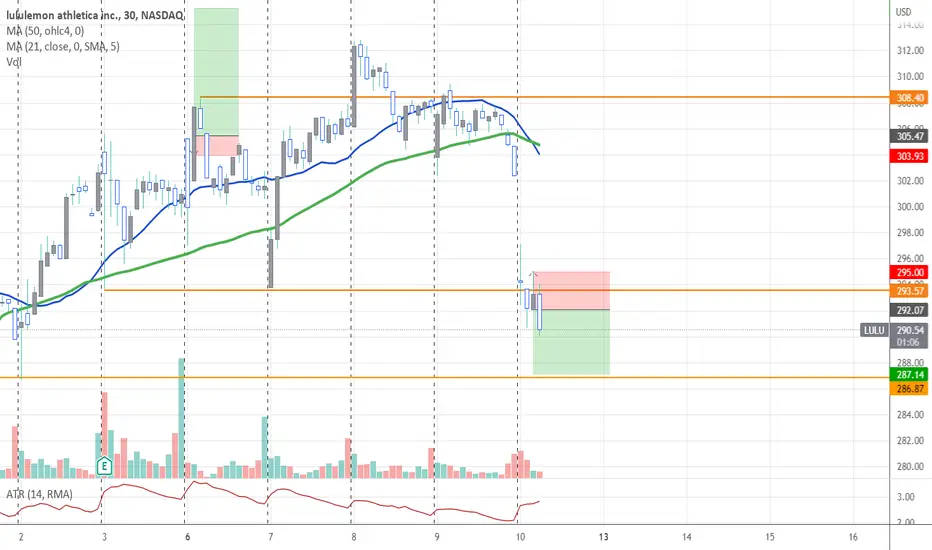
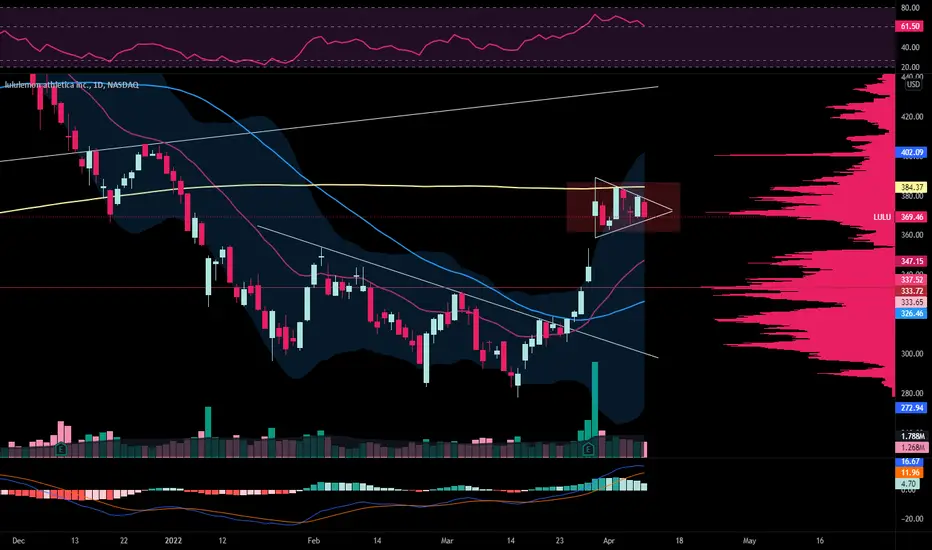
LULU inside weekInside week on LULU and also forming a triangle pattern. Top of the trendline and 50DMA are pretty close to each other. Most of the names had inside weeks last week and we have FED on Jul 27th. The only thing i am thinking about is if market moves past its range this coming week or the week after when FED makes an announcement but nonetheless these setups can be played either way.
If LULU breaks out, JUL 22 295C can work. There is a gap to fill 293.39 and then another gap 297.50 - 302.13 which can be targets
If it gets rejected from 50DMA or top trend line can try 280P for a trade down to the opposite side of triangle.
LULU trade ideas
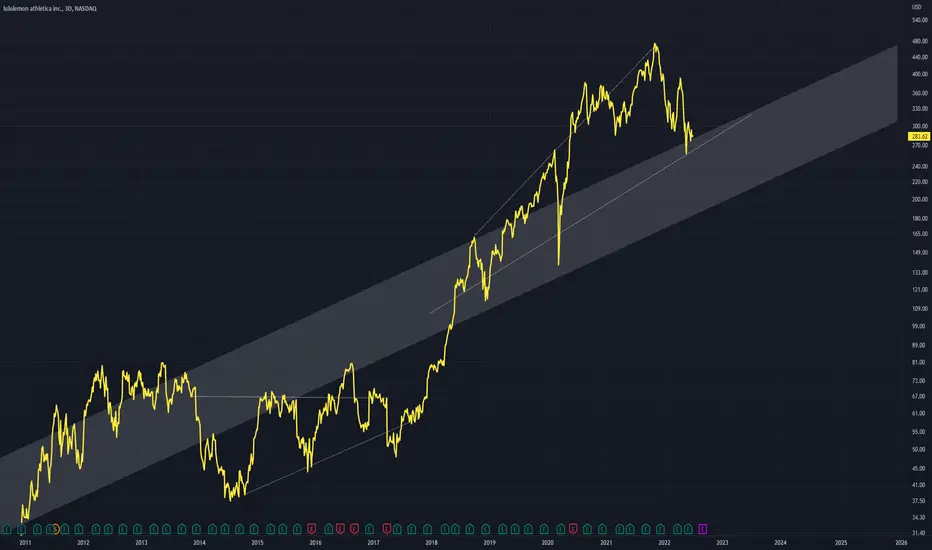
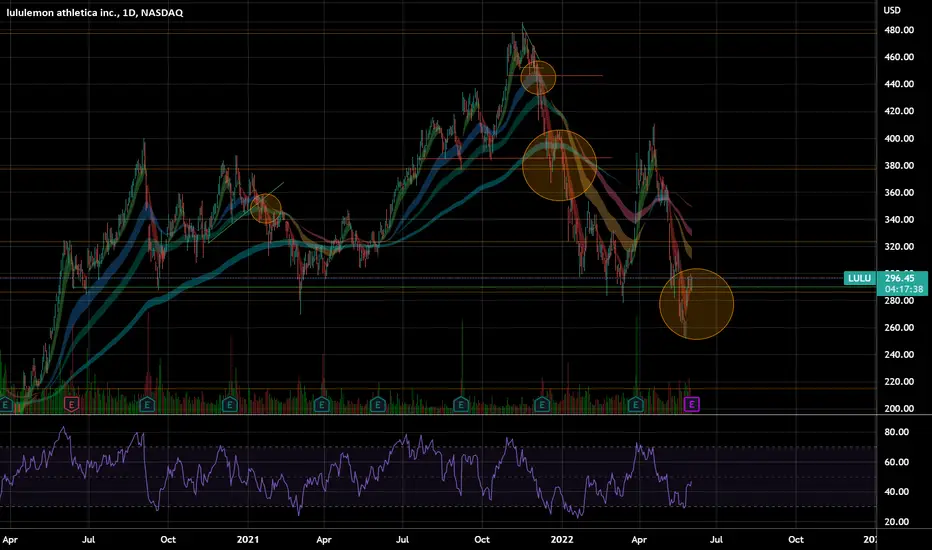
LULU - Above Up Channel LULU has formed a megaphone pattern above the top of a dominant up channel
This up channel may act now as support on this 3D chart
Earlier price formation shows a symmetrical triangle
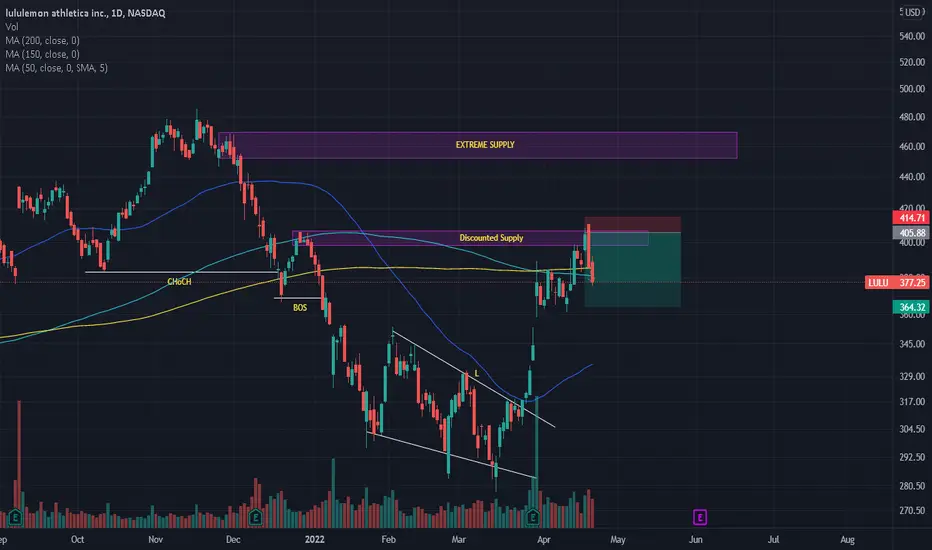
BOS CHOCHBreak of structure /Change of Character
Break below lower high. When price goes from new Higher high + break of structure low = Changer of Character
Waited for pullback on 30min chart.
Brought puts on continuation lower than 30min pullback candle.
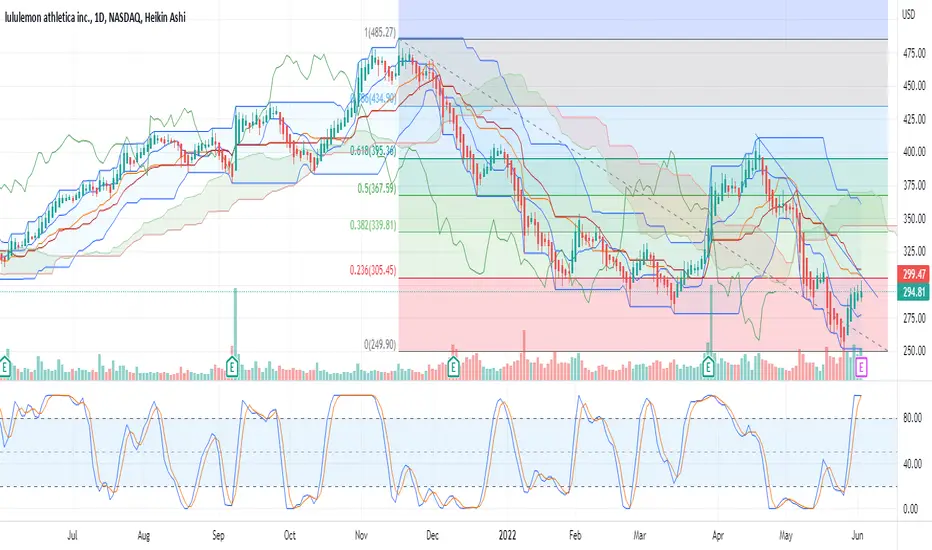
LULU Bearish DivergenceLULU finding some resistance within the Volume profile POC and showing a ROC Divergence here. The ROC showing lower high readings as LULU continues in the short term uptrend, a negative for any continuation here. Expecting a test of the VAL (286). I think this 286 wont be a strong support either and might see a stronger support at 250.

LULU | GuidanceJournal Entry
Bias: Positive.
Sentiment: Optimistic.
Emoji (emotion): Patient🧘♂️.
Null Hypothesis: Buy.
Alternative Hypothesis: Sell.
Signals: Several MA Crosses, %B +Band walking, Bandwidth approaching a pivot point.
Position: Swing trade.
Notes: I'm anticipating the market to buy/sell the earnings surprise 6/02/22 AMC: www.estimize.com
Barron's Company Overview: www.barrons.com .
Other: I do not advise an option trade for LULU the volume & open interest are too low and the BidxAsk spread is too wide.
Tutorial: (Q/A) What exactly is the box labeled tolerance? The box labeled tolerance is a defined range of value & time that qualifies the right to exit the trade after a profit is made; as long as the security is inside the box and above the trade's entry one could say the profit is within tolerance, likewise if the security is outside the box either because of value or time one could say the profit is not within tolerance. It's a way to add parameters to the future outcome (as a means to grade the journal entry) while simultaneously providing leniency in the ability to achieve success with said journal entry.
About the Security: "lululemon athletica, Inc. engages in the designing, distributing and retail of athletic apparel and accessories. It operates through the following business segments: Company-Operated Stores, Direct to Consumer. The Company-Operated Stores segment comprises lululemon and ivivva brands; and specialize in athletic wear for female youth. The Direct to Consumer segment is involved in the e-commerce business, building brand awareness, particularly in new markets. The company was founded by Dennis J. Wilson in 1998 and is headquartered in Vancouver, Canada."
About the Author: I'm happy to hear from my readers/audience and I encourage constructive feedback; although I'm busy I will give my best effort to reply. I do strive to build an esteemed reputation with a prolific following and earn the titles of a Tradingview Wizard & Top Author; along those lines I'm a financial scientist and my contributions offered to the community are apart of my scientific journal or goodwill to mankind.
Disclaimer: My journal entry is not a complete prospectus, please consider it accordingly.

LULU is going downLULU has weakening momentum, a long term H&S and volume cueing in a downside move. You can see that historically, LULU likes to make H&S patterns with the neccessary retest at the end of the H&S slightly overextending the trendline before capitulating. Taking a long-term short for a few months out is my play of choice. A calandar spread is a good way to hedge but with the potential for capitulation, I think an ATM or Slightly OTM naked put is the best strategy to go with.
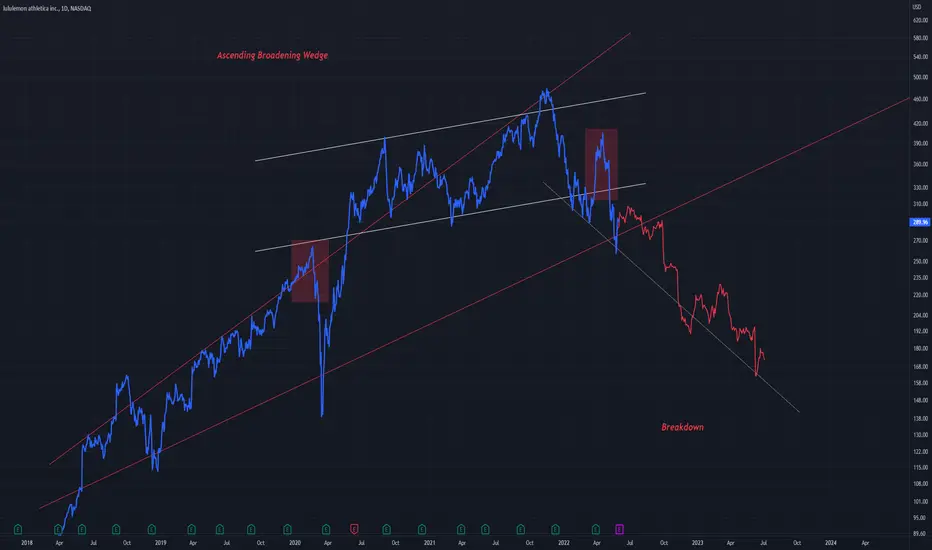
LULU - Ascending Wedge BreakdownA symmetrical triangle can be seen acting bullishly, pushing the price into a rising broadening wedge
I believe this wedge to be a bearish pattern, as I have indicated with the bars pattern (which is just a rough estimate of how a down move will persist)
Daily chart
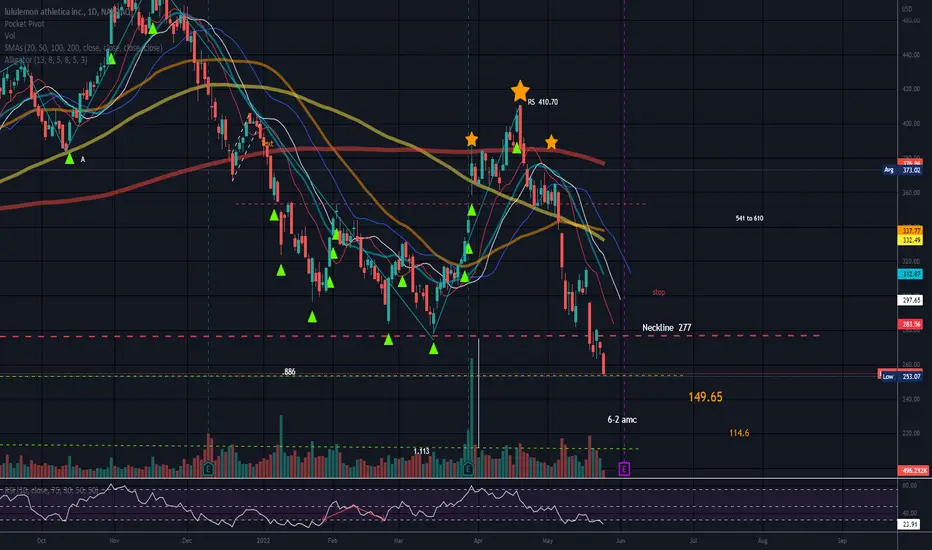
Head and ShouldersPossible short entry 277 or below.
Earnings 6-2 AMC.
Short percent 2.52.
I love this stock but looks like LULU is going down with the ship for now. I will catch her at the bottom )o:
Possible stop above neckline or a level of resistance
No recommendation.
If there were no luck involved I would win every time )o:
Be safe//Laura
LULU - potential $50 dropAnother overinflated garbage stock.
Needs to come back to earth this year.
Target - 260.
I am planning to build a short position in all bounces in the next week.
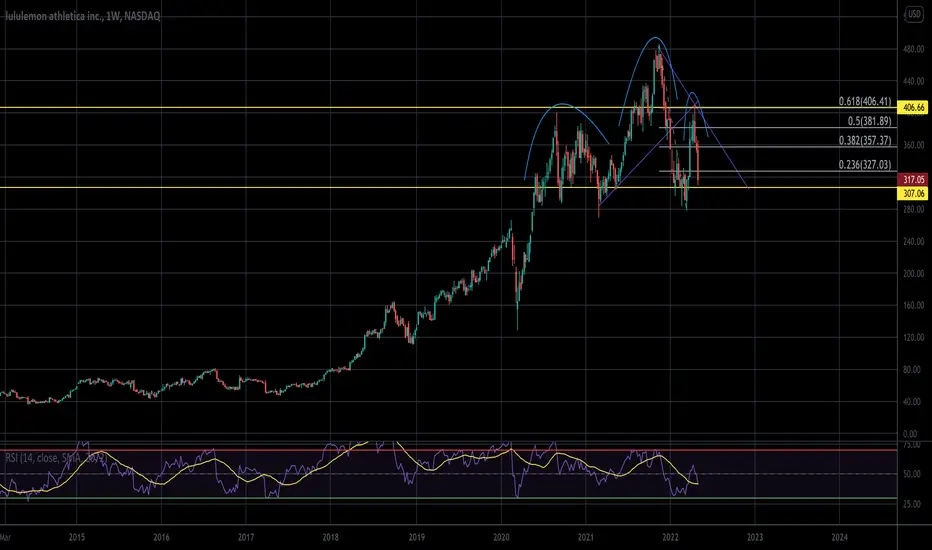
POSSIBLE HUGE CRASH!Lulu is highly successful retailer.
It is a well know brand world-wide.
But it is obvious that stock price valuations is just too high.
A correction is imminent.
On the monthly chart, there is a text-book head and shoulder pattern.
Price action broke the neck to the downside.
If price close this month below neck area which is around 302 USD, things will accelerate in favor of bears.
There is an uptrend that started a decade ago and probably in couple of weeks price is going to test the trend line.
If price cant hold that line, 192 USD is possible in the short term.
Lulu can test 78 USD area depending on FEDs actions.
Important support areas for the long term
302
245
224
192
166
139
120
78
Follow for more ideas and charts!

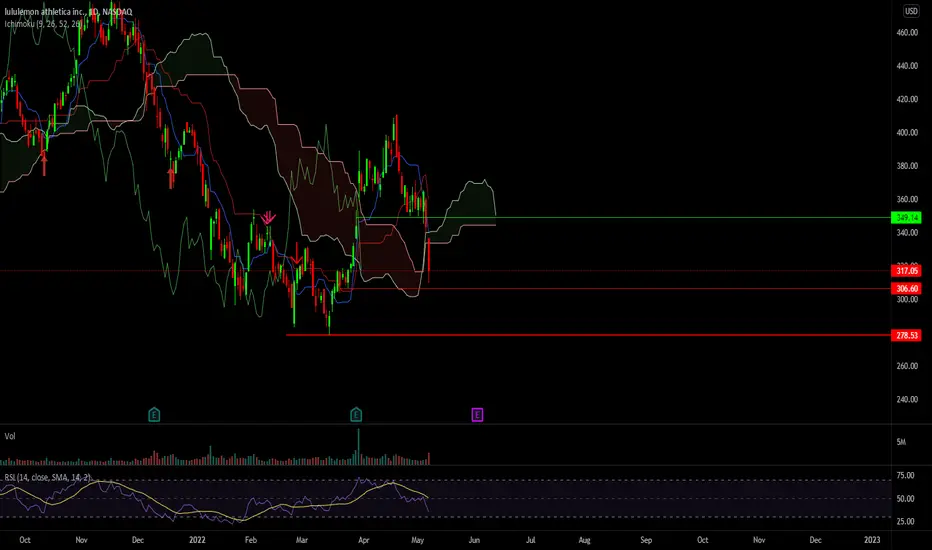
LULU PUTS BELOW 306 -As we observed last week the beautiful breakout of that 349 level we immediately went right down AMAZING breakout trade
-Now we are heading down towards the next major support at 278.53... We shall look for the breakout of the minor support line at 306.60
-This is a daily set up so we can play this w monthly options or we can get in and out to manage risk
next week will be interesting for LULU >.<currently back to its extreme trend resistance, if it cannot hold the blood continues, but if we use trend resistance as support a big rally can follow.
long trigger at 335.04/short trigger 286.94
I will attach a chart with my vibranium algo targets :)

LULU FALLING BEHIND -I like to trade Lulu typically bc she’s usually a day behind so we can expect a break below 350.26 Monday and play puts from there
-There is a lot of range once we break these levels we have range down till 317 to where we might meet smack in the middle with the cloud
-looking for an entry once we break 350 support
Buy LULU puts with time, or Sell call credit spread.Remember this is a weekly chart. Price retreated from 400 and I am not sure if stock price will remain so high after earnings, or going into mid-year.
Stock price can move substantially lower which will make a great swing trade. Options volume is low on this stock, and so is general stock volume. If you are not willing to hold for a few weeks for price to change meaningfully, then you may want to skip this trade idea.
LULU Daily Time Frame Short Position via Supply Zone Confluence - Price enters a change of character, then proceeds to break structure, forming a fresh level of supply.
- Price retraces down to form liquidity zones, breaks liquidity sweeps and retraces back into fresh discounted supply.
- This is exactly when I enter in on atm weekly puts.
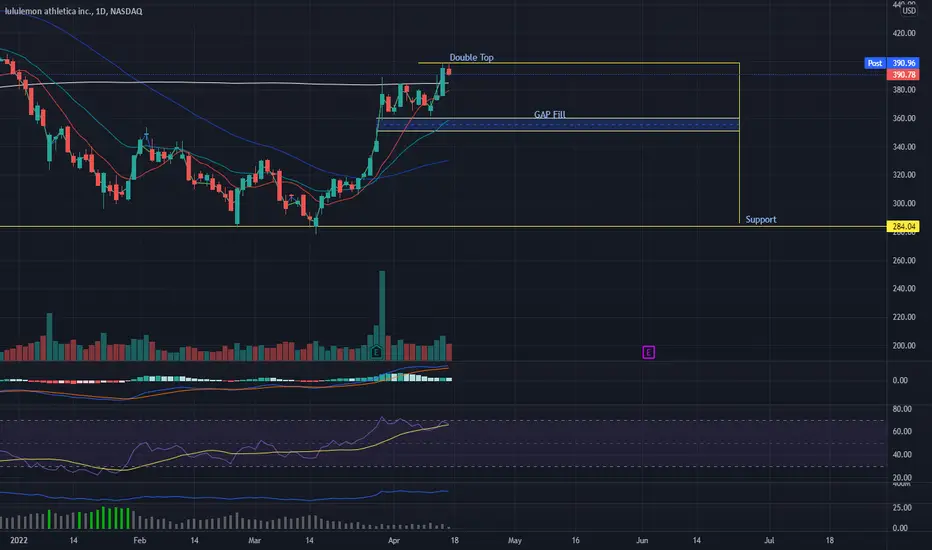
$LULU Double TopLululemon ($LULU) has a double top, gap fill, and support as indicated. RSI is pointing down, MACD is starting to switch over.
Disclaimer: Stratford Research newsletters reflect the research and opinions of only the authors who are associated persons of Stratford Consulting Ltd. The newsletters are for informational purposes only and are not a recommendation of an investment strategy or recommendation to buy or sell any security or digital asset (cryptocurrency, etc.) in any account. The information provided within the newsletters is not intended to serve as the basis for any investment decision. Any third-party information provided therein does not reflect the views of Stratford Consulting Ltd. or any of its subsidiaries or affiliates. All investments involve risk including the loss of principal and past performance does not guarantee future results.
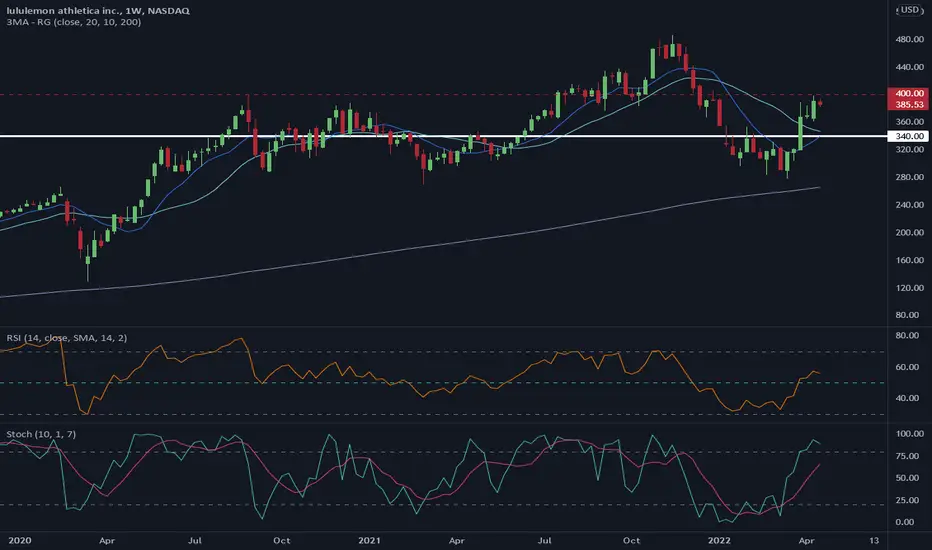
LULU breakout of consolidationLULU consolidated to 9 ma and breakout of the consolidation by there. There is some resistance at $400 but it could go to $460-$470. Risk off $370.
LULU - expecting more upside in medium termLULU was forming an inverted Head & Shoulders (a potential sign of trend reversal), which eventually broke up strongly upon Earnings Release.
I would classify the gap that accompanied this breakup as a "breakaway" gap (gap that occurs at the beginning of a trend change, usually signifying the new trend has some room to move).
However it soon hit into a "horizontal support that now turned resistance" around 390 and has since been correcting from there. As I believe the uptrend as room (considering the breakaway gap), the recent pullback is likely a bull flag. I would long the breakup of this bull flag @ 369.5 with initial stop just below 358.
Scale out 1/3 position near 390 and hold the rest to see if it would break out of this resistence eventually.
Disclaimer: TA is about improving our odds of a successful trade (not a guarantee). This is just my own analysis and opinion for discussion and is NOT a trade advice. Please your own due diligence and trade according to your own risk tolerance and don't forget that money management is important! Cheers.

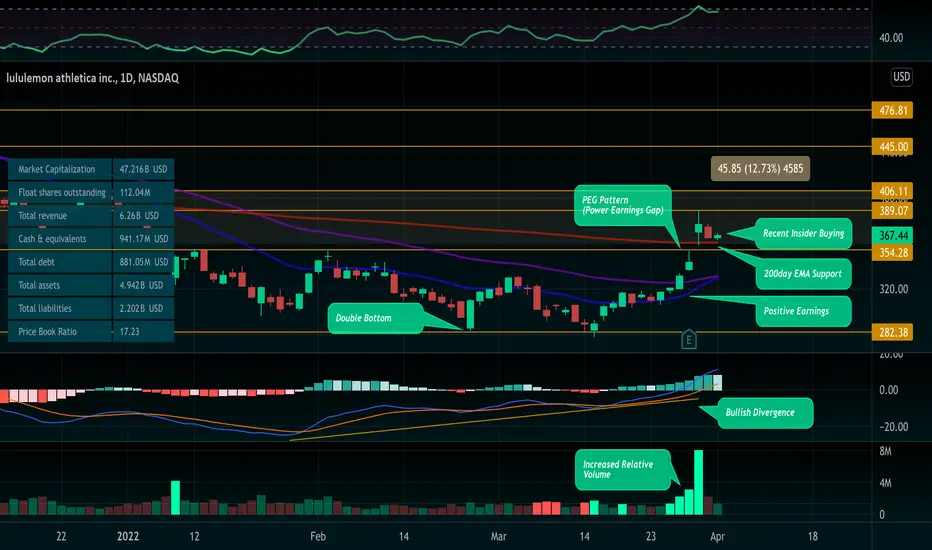
Lululemon Swing IdeaLululemon is ready to continue running after recent positive earnings imo.
- Double bottom at $282 support level
- Positive earnings call on 3/29
- Strong Balance Sheet
- Increased Relative Volume with bullish selloff after initial pop.
- PEG Pattern (maybe not enough accumulation leading up to earnings)
- 200day ema support
- Recent insider buying
- Bull Flag formed
- Next pop to $406 level for ~12% swing. Could go higher if volume increases.
- Using 200day ema and $354 as risk level
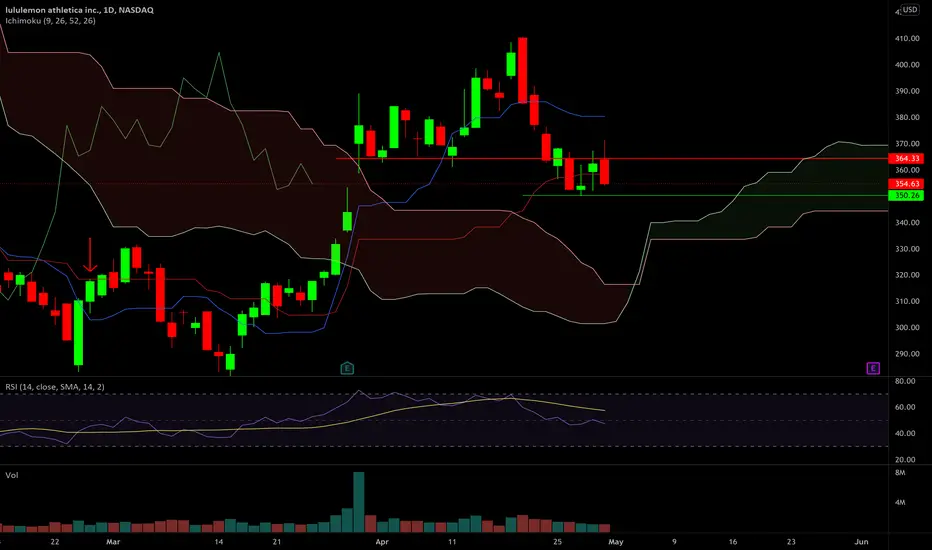
LULU massive earnings run losing strengthWedge forming on daily right below 200 day MA. In my view, LULU's inability to take out the 200 day quickly shows weakness and could fall
apart next week. Weekly chart showing a gravestone doji, indicates a top of a trend; a sign of trapping longs. Either way, if it breaks higher 400; breaks lower 333.
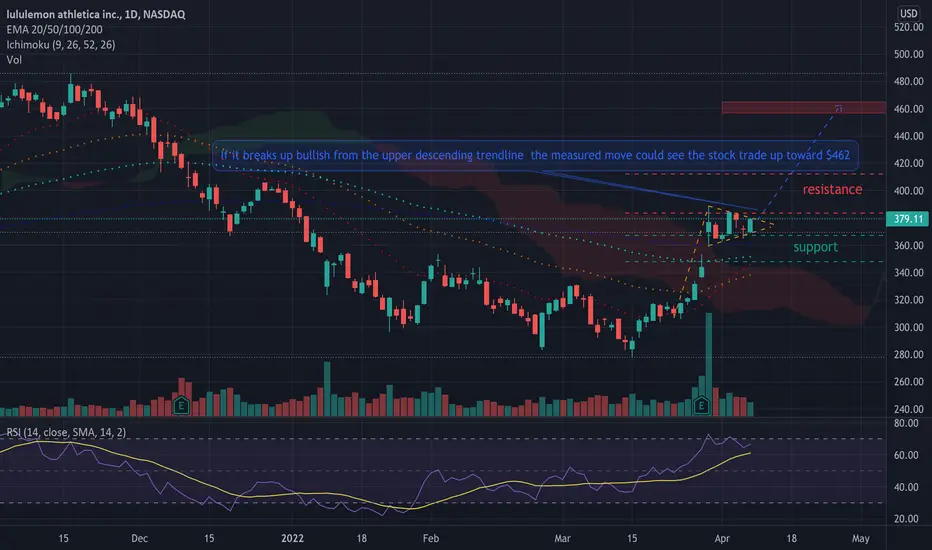
Stock may headed back toward All-Time Highs.Between March 24 and March 30, Lululemon soared 27%, which created the pole of the bull flag pattern. Since then, the stock’s daily trading range has tightened into a triangle, which has formed the flag of the pattern.
If Lululemon breaks up bullish from the upper descending trendline of the flag on higher-than-average volume, the measured move could see the stock trade up toward the $462 level, which is in range of the Nov. 16, 2021 all-time high of $485.83.
The stock is set to hit the apex of the triangle on April 12 and traders and investors can watch for a break from the triangle pattern over the next three trading days to gauge future direction.
If Lululemon breaks up from the flag formation, the stock will regain support at the 200-day simple moving average, which will indicate long-term sentiment has turned bullish.
On Thursday, Lululemon was trading on lower than average volume, which indicates consolidation is taking place, which aligns with the theory that the bull flag pattern is in play. By late afternoon, only about 872,000 shares had exchanged hands compared to the 10-day average of 2.43 million.
The consolidation within the bull flag pattern has helped to drop Lululemon’s relative strength index to about 65% from the 73% level the stock’s RSI was measuring on March 30. The drop in RSI allows for Lululemon to trade higher if the stock breaks up from the bull flag.
Lululemon has resistance above at $383 and $412 and support below at $367 and $347.
Bullish traders will want to watch for a break up from the upper descending trendline of the flag formation, on high volume, for an entry. When a stock breaks up from a bull flag pattern, the measured move higher is equal to the length of the pole and should be added to the lowest price within the flag.
A bull flag is negated when a stock closes a trading day below the lower trendline of the flag pattern or if the flag falls more than 50% down the length of the pole.
LULU SELLSell LULU and for it to reach.
Risk 1 to make 1.5 since the overall market is favor on the bull side.