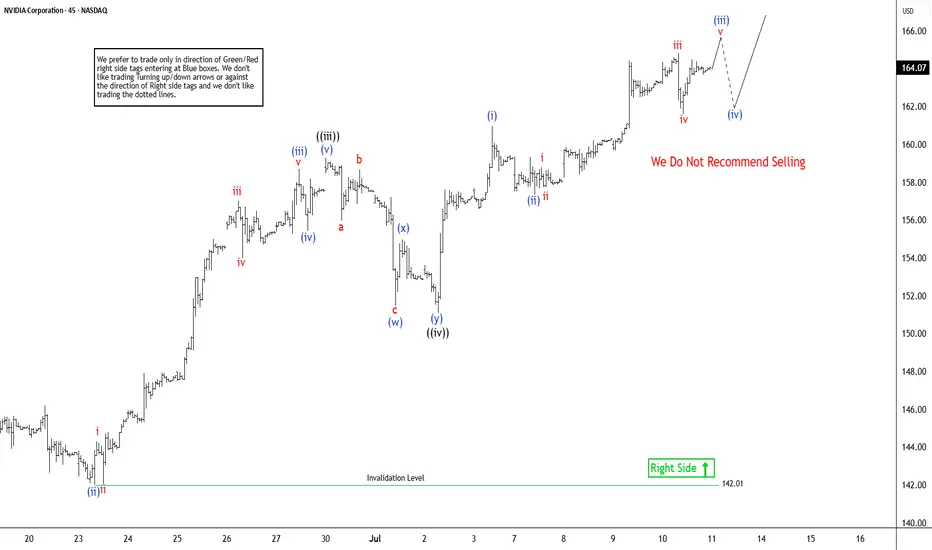
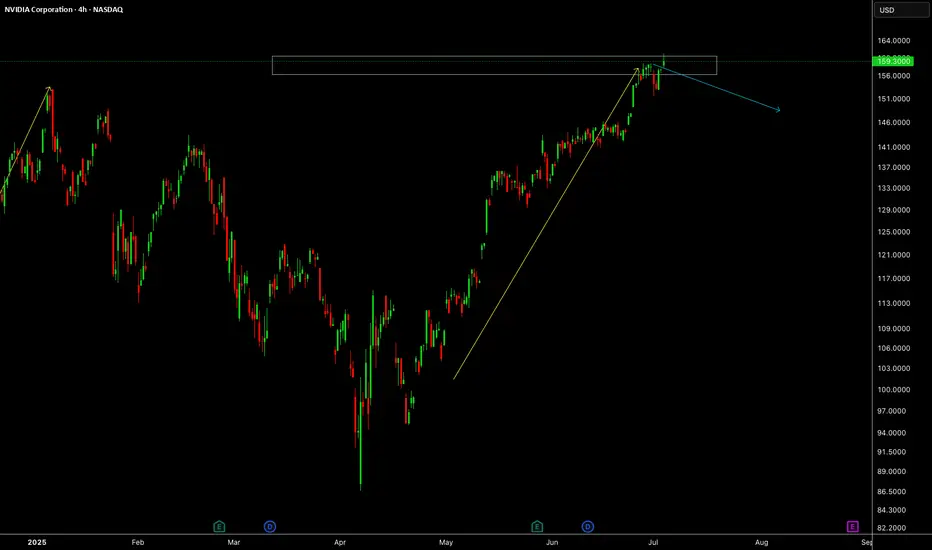
NVIDIA ($NVDA) Elliott Wave Outlook: Larger Pullback on the HoriNvidia (NVDA) continues its remarkable ascent, consistently reaching new all-time highs and reinforcing a robust bullish outlook. The ongoing rally, which began from a significant low on April 7, 2025, remains structured as an impulsive wave pattern, indicative of strong upward momentum. However, despite the potential for further short-term gains, the cycle appears mature. This suggests a larger-degree pullback could be imminent. Investors should exercise caution when considering chasing this rally in shorter time frames, as the risk of a corrective move grows.
In the short term, the cycle initiated from the June 2 low is progressing as a lower-degree impulse. From this low, wave ((i)) peaked at $144, followed by a corrective pullback in wave ((ii)) that concluded at $137.88. The stock then surged in wave ((iii)) to $159.42. The subsequent wave ((iv)) correction unfolded as a double-three structure, with wave (w) ending at $151.49, wave (x) at $154.98, and wave (y) completing at $151.10, finalizing wave ((iv)). Currently, Nvidia is advancing in wave ((v)), exhibiting a five-wave subdivision. Within this, wave (i) of ((v)) reached $160.98, with a minor pullback in wave (ii) concluding at $157.34. As long as the pivotal low at $142.01 holds, any near-term pullbacks are likely to attract buyers in a 3, 7, or 11-swing pattern, supporting further upside potential. This technical setup underscores Nvidia’s strength but highlights the need for prudent risk management.
NVDA trade ideas
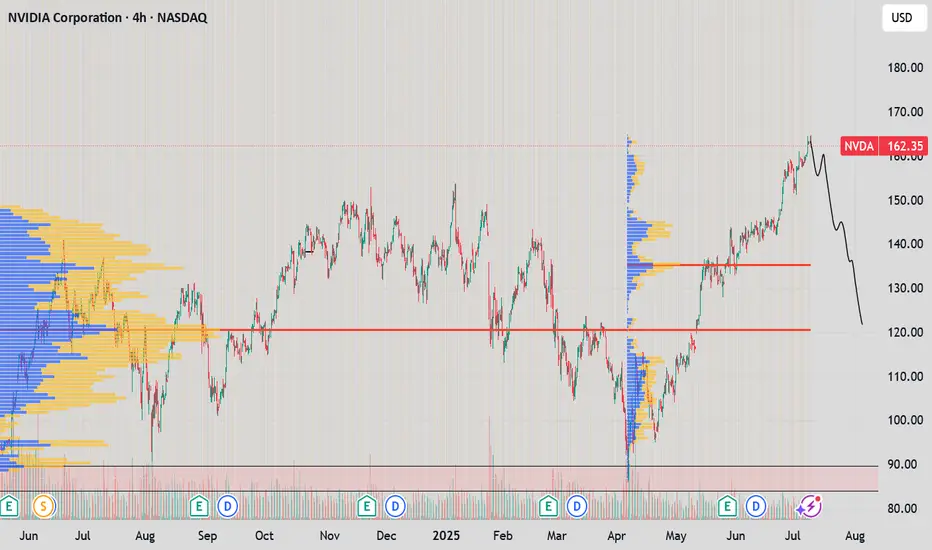
Nvda bearish ideaGiven the recent euphoric blast of NVDA on the AI wave, I'm calling for a deep technical correction. While fundamentals are still there, it shows overvaluation and is in dire need of a cool off period
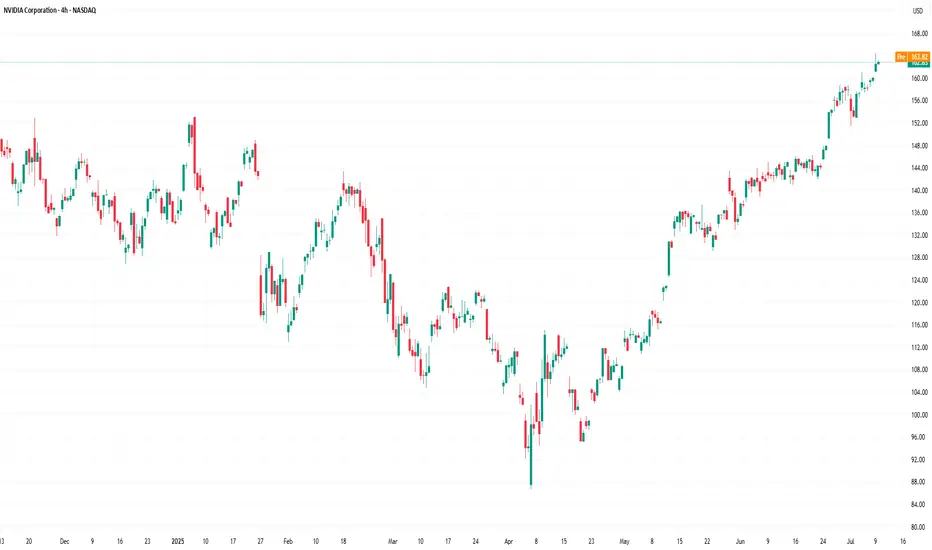
A bit of profit taking on NVDA and then up again?NASDAQ:NVDA is the most talked about and everyone is capitalizing on that. Let's take a look.
NASDAQ:NVDA
Let us know what you think in the comments below.
Thank you.
75.2% of retail investor accounts lose money when trading CFDs with this provider. You should consider whether you understand how CFDs work and whether you can afford to take the high risk of losing your money. Past performance is not necessarily indicative of future results. The value of investments may fall as well as rise and the investor may not get back the amount initially invested. This content is not intended for nor applicable to residents of the UK. Cryptocurrency CFDs and spread bets are restricted in the UK for all retail clients.

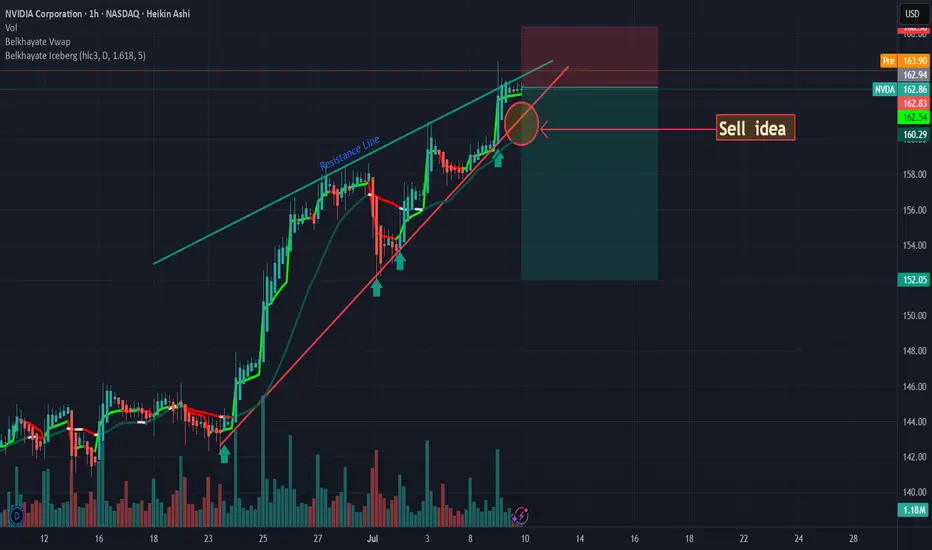
NVIDIA: Sell ideaSell idea on NVIDIA as you can see on the chart if only and only if we have the breakout with force the support line and the vwap indicator by a big red candle follow by a large red volume.
Nvidia Market Capitalisation Reaches $4 TrillionNvidia Market Capitalisation Reaches $4 Trillion
Yesterday, Nvidia’s (NVDA) share price surpassed $162 for the first time in history. As a result, the company’s market capitalisation briefly exceeded $4 trillion during intraday trading (according to CNBC), making Nvidia the first publicly listed company to reach this milestone.
The rise in NVDA’s share price is being driven by both bullish sentiment across the broader equity market—which appears optimistic ahead of the upcoming Q2 earnings season—and evidence of sustained demand for Nvidia’s products, as artificial intelligence technologies continue to gain widespread adoption.
Noteworthy developments include:
→ Nvidia may begin producing a specialised AI chip for the Chinese market this autumn, potentially circumventing current export restrictions;
→ Perplexity, a company backed by Nvidia, is launching an AI-powered browser aimed at competing with Google Chrome.
Technical Analysis of NVDA Chart
In our previous analysis of NVDA’s price action, we:
→ Drew an ascending channel;
→ Highlighted bullish conviction in overcoming the $145–150 resistance zone.
The channel remains valid, with the current price trading near its upper boundary. However, the RSI indicator is showing signs of bearish divergence, suggesting that the stock may be vulnerable to a near-term correction—potentially towards the median line of the existing upward channel.
At the same time, a major shift in the prevailing bullish trend appears unlikely. The $145–150 range may serve as a key support zone for NVDA in the foreseeable future.
This article represents the opinion of the Companies operating under the FXOpen brand only. It is not to be construed as an offer, solicitation, or recommendation with respect to products and services provided by the Companies operating under the FXOpen brand, nor is it to be considered financial advice.
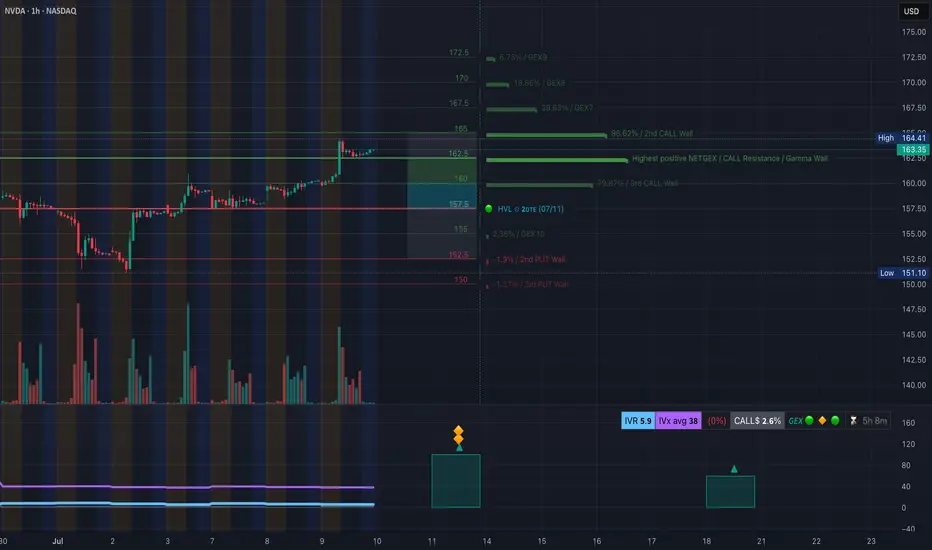
NVDA: Ready for a Gamma Squeeze or Cooling Off? for July 10NVDA: Ready for a Gamma Squeeze or Cooling Off? Here's the Setup You Need 🎯
Options Sentiment (GEX Analysis):
NVDA is trading around $163.35 and sitting just above the Gamma Wall at $162.50, which also marks the highest positive NET GEX zone—a key resistance created by dealer positioning. Above that, the second CALL Wall is stacked near $165, with further resistance layering in toward $170 and $172.50.
Below, there’s a liquidity pocket around $157.50 (HVL zone), and deeper PUT support doesn’t come in until $152.50–$151.00.
* GEX: Bullish leaning (CALLS 2.6% domination, GEX bar fully green)
* IVR: Low at 5.9, and IVx Avg 38 → Options are relatively cheap.
* Sentiment: Leaning bullish with potential for a gamma squeeze if momentum builds above $165.
🟢 Strategy Suggestion:
Consider 160C or 165C weekly calls (with tight spreads) if NVDA holds above $162.50 and breaks through $165 with volume. A gamma squeeze toward $170 is on the table.
Risk-managed PUTs (e.g., 158P) only if price flushes back below $160 support with momentum.
1-Hour Chart Technical Outlook:
NVDA has broken out of the previous range, flipping internal structure bullish. The CHoCH and BOS confirm trend change earlier this week, and the price is now consolidating just under a resistance zone (purple box) near $164.
Support below is layered at:
* $160 (broken resistance, now key support)
* $158.05 (previous structure low)
* $152.00–151.00 (demand zone + GEX support alignment)
Resistance:
* $164.41 (current high)
* $167.50, $170, $172.50 (GEX option walls)
Structure is showing a rising wedge/channel pattern; however, we’re still trending strong with clean higher lows.
🟢 Long Trade Setup (Bullish Continuation):
* Entry: Above $164.50 with breakout confirmation
* Target: $167.50 → $170
* Stop: Below $160 (or tighter below $162.50 based on risk appetite)
🔴 Short Trade Setup (Reversal Scenario):
* Entry: Breakdown below $160 with rejection from $163–$164
* Target: $158 → $152 zone
* Stop: Above $165
My Thoughts:
NVDA is sitting in a key decision zone. As long as it holds above $162.50, bulls have the edge to push this higher into the next GEX walls. Watch for confirmation on $164.50 breakout for continuation. If it fakes out and drops below $160, that would likely trigger a downside flush to $158 or lower.
This analysis is for educational purposes only and does not constitute financial advice. Always do your own research and trade responsibly.
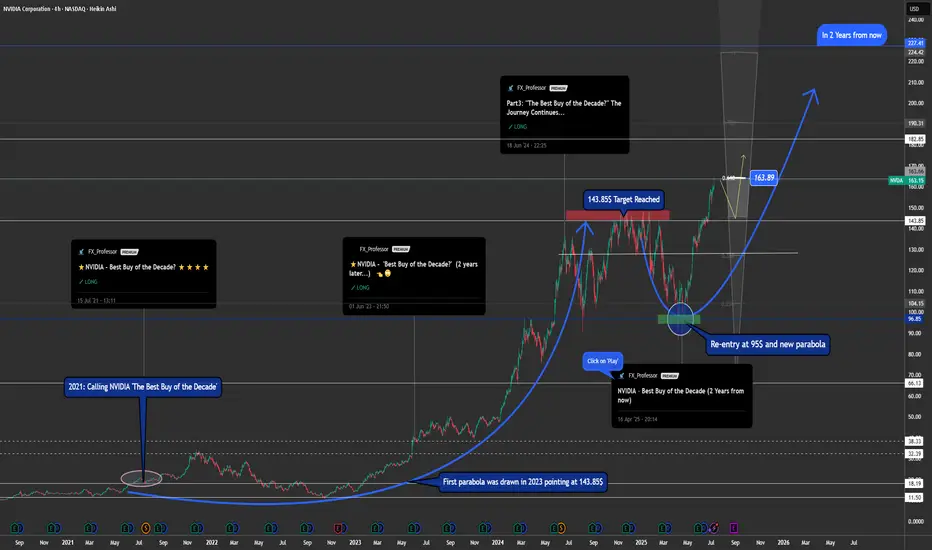
NVIDIA – Best Buy of the Decade (4T Record but now resistance)🚀🔥 NVIDIA – Best Buy of the Decade Post #6
💡📉 Great but why am I taking half profits Today?
Back in July 2021, I named NVIDIA "The Best Buy of the Decade. " Today, it just hit a mind-blowing milestone — becoming the first company to reach a $4 trillion market cap. But here's the thing... that happened right at major resistance.
From our initial call in 2021 , to the target at $143.85 drawn via parabola in 2023, to the April 2025 re-entry at $95, it’s all on the chart — and it's been a textbook ride so far.
At the current level of $163.89, we’re pressing into serious overhead resistance. This doesn’t mean the story is over — not even close. But it could mean we take a breather before the next leg higher.
🧭 Targets ahead remain unchanged:
🔹 First stop: $182.85
🔹 Long-term vision: $227.41
What started as a bold macro call in 2021 has now become a multi-year thesis with precision updates along the way. This is post #6 in the NVIDIA journey — and if you scroll back through the chart, each piece has built on the last with clarity and conviction.
🎯 NVIDIA is not just a tech stock — it’s the AI backbone. But every cycle has pauses, and this one looks ready for a short rest before we see the next breakout.
Stay sharp, follow the structure, and honor the parabola.
One Love,
The FX PROFESSOR 💙
Additional info, for those who like to dive deeper into NVDA:
🔍 Technical Breakdown Version
For the chartists and structure followers, here’s the breakdown:
📌 2021: Original call — "Best Buy of the Decade"
📌 2023: First parabola plotted, projecting toward $143.85 — target hit precisely
📌 April 2025: Market offered $95 re-entry — second parabola begins
📌 Now: Price sits at $163.89, testing resistance from both structure and Fibonacci
📌 Next levels:
- $182.85 → Key extension level
- $227.41 → Long-term target based on full parabolic arc
Current structure suggests a possible pause before continuation. No need for panic — parabola remains valid unless structure is broken. Volume still supportive, and price action is following projection beautifully.
🧠 AI Macro Narrative Version
The big picture? NVIDIA isn't just another semi stock — it’s the nervous system of the AI revolution.
From gaming → crypto → AI, NVIDIA has consistently been first to adapt, and now it’s the leader in AI hardware infrastructure. The $4 trillion milestone is more than symbolic — it represents capital reallocation toward AI as the next dominant sector.
🧠 Key macro takeaways:
AI demand is insatiable
Data centers need NVIDIA
Generative AI isn't slowing down
Institutions are still buying — not selling
The resistance we see now isn’t weakness — it’s the market pausing to digest before another acceleration. Just like every past cycle... we ride, retrace, reload, and resume.
Disclosure: I am happy to be part of the Trade Nation's Influencer program and receive a monthly fee for using their TradingView charts in my analysis. Awesome broker, where the trader really comes first! 🌟🤝📈
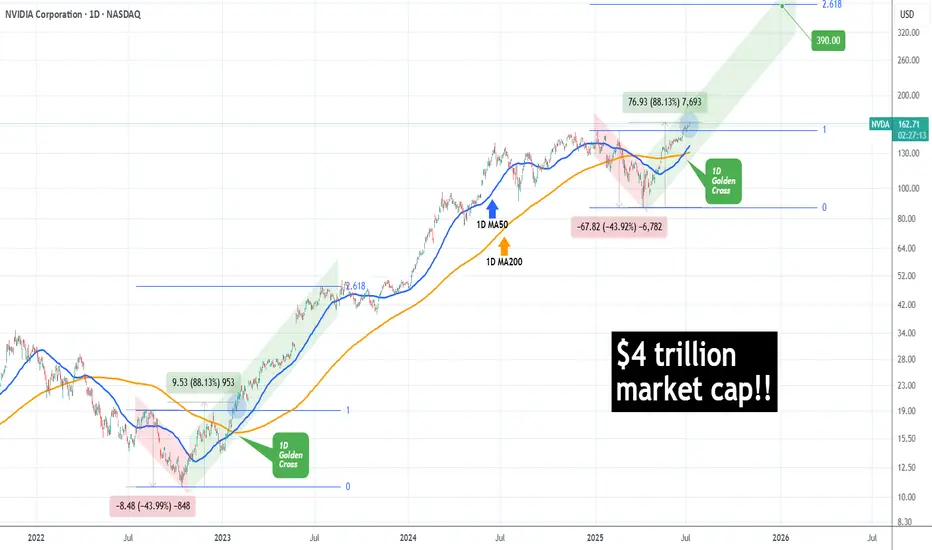
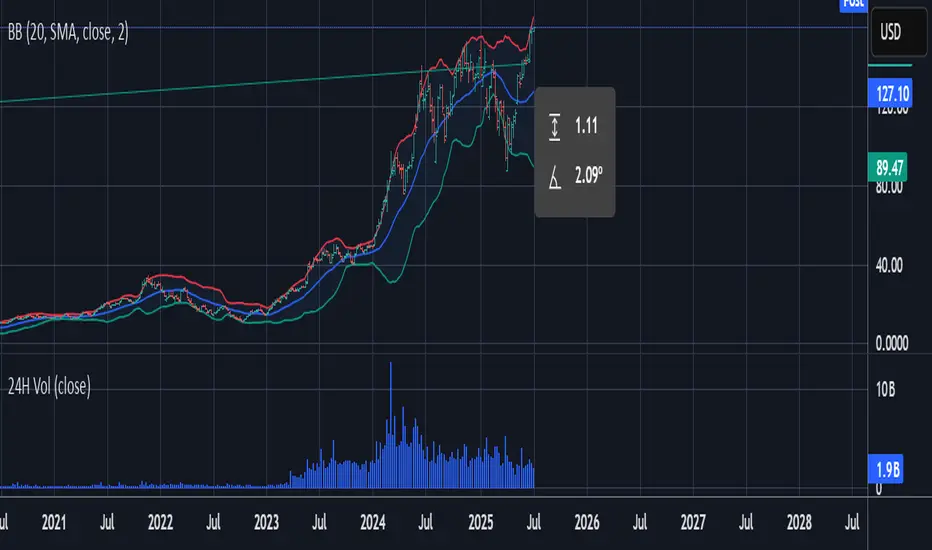
NVIDIA made history! First company with $4 trillion market cap!NVIDIA Corporation (NVDA) became today the first company in history to surpass a $4 trillion market value, as A.I. bulls extended the recent rally and pushed the price past the approximate $163.93 level needed to reach this market capitalization threshold.
The long-term trend on the 1D time-frame couldn't look more bullish. Coming off a 1D Golden Cross less than 2 weeks ago, the price has turned the 1D MA50 (blue trend-line) into Support and sits at +88.13% from the April 07 2025 Low.
This is the exact set-up that the market had when it was coming off the 2022 Inflation Crisis bottom (October 13 2022). As you can see, both fractals started with a -44% decline, bottomed and when they recovered by +88.13%, there were just past a 1D Golden Cross. In fact that Golden Cross (January 24 2023) was the last one before the current.
NVIDIA entered a Channel Up (green) on its recovery and for as long as the 1D MA50 was supporting, it peaked on the 2.618 Fibonacci extension before it pulled back below it.
If history repeats this pattern, we are looking at a potential peak around $390, which may indeed seem incredibly high at the moment, but as we pointed out on previous analyses, the market is in the early stages of the A.I. Bubble, similar to the Internet Bubble of the 1990s.
-------------------------------------------------------------------------------
** Please LIKE 👍, FOLLOW ✅, SHARE 🙌 and COMMENT ✍ if you enjoy this idea! Also share your ideas and charts in the comments section below! This is best way to keep it relevant, support us, keep the content here free and allow the idea to reach as many people as possible. **
-------------------------------------------------------------------------------
💸💸💸💸💸💸
👇 👇 👇 👇 👇 👇
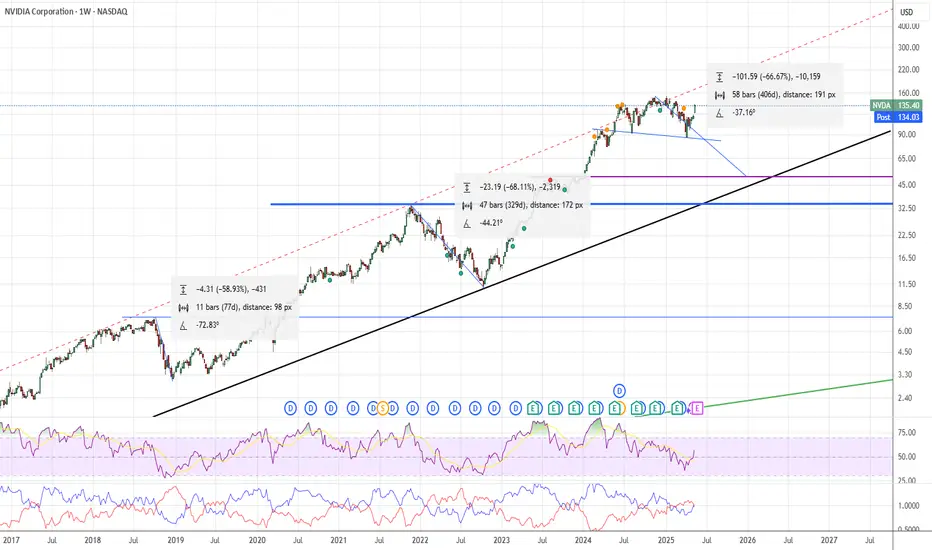
NVDA$ - possible pullback to $50 (-67% from pick) in the making.NASDAQ:NVDA have done this before (67% pullbacks after long rally).
NVDA is following very predictable patterns for many years now, despite excitement around this stock - stock made "new recent low" and current rally maybe just a part of a "head and shoulders" in the making. If "new all time high" is not reached with in the next few weeks - we will see stock pullback to $50 or less in the next 6-9 month.
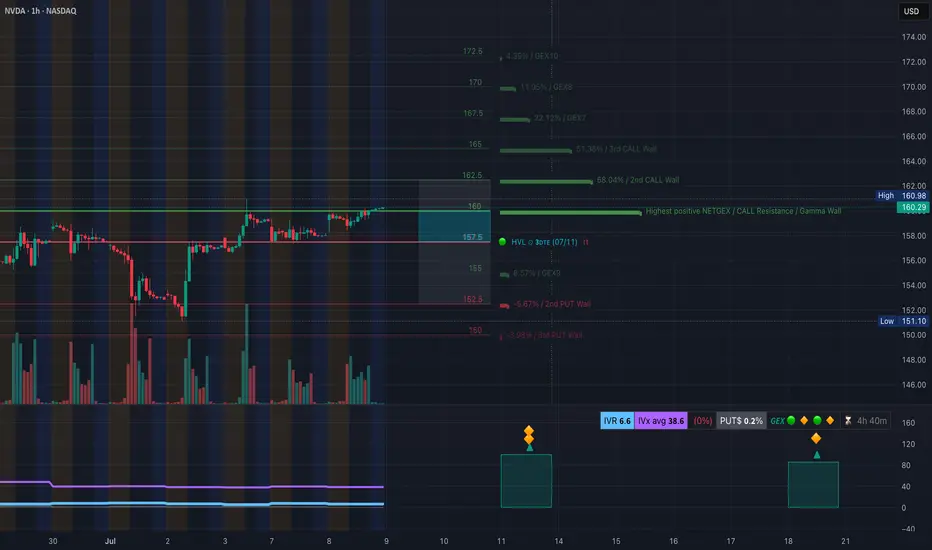
NVDA Testing Gamma Ceiling — Eyes on 162.5 🔩 Options Sentiment & GEX Analysis
NVDA is pressing into a critical Gamma Wall at 162.5, which aligns with the highest positive NET GEX and second-tier Call Wall concentration. Dealers are likely short calls here, meaning a breakout could trigger gamma-induced hedging, fueling a squeeze.
* Call Walls: 162.5 → 165 → 167.5 → 170
* Put Walls: 157.5 → 155 → 152
* GEX Skew: Strong bullish exposure into 162.5, suggesting a resistance zone but also potential fuel if breached.
* IVR: 6.6 — Implied Volatility remains cheap, ideal for directional plays.
* IVx Avg: 38.6 — still elevated, giving edge to debit spreads.
* Put/Call Ratio: 0.2% Puts – overly call-heavy positioning adds risk of dealer chasing if breakout occurs.
🧠 GEX-Based Option Trade Ideas
📈 Bullish Gamma Squeeze Play
* Setup: Buy 160/165 Call debit spread (Jul 19 or Jul 26 expiry).
* Trigger: Break & close above 161 with volume.
* Target: 165 → 167.5
* Why: Breaching Gamma Wall at 162.5 opens room to next Call Walls. Dealer hedging could force rapid upside.
📉 Bearish Fade Setup
* Setup: Buy 160/155 Put debit spread
* Trigger: Failure to reclaim 161–162.5 zone with clear rejection pattern.
* Target: 157.5 → 155
* Why: Rejection at GEX ceiling could unwind recent rally, especially if broader market rolls over.
🧭 1-Hour Technical Chart Overview
NVDA is consolidating tightly under its Gamma resistance within a clear ascending channel.
🔍 Structure & SMC Highlights
* Series of Breaks of Structure (BOS) confirms bullish trend.
* CHoCH zones have been retested and flipped bullish around 157.5.
* Current price is compressing under a key supply zone at 160.98–162.5, with rising trendline providing support.
* A clean bullish reaction from the 157.5 order block shows buyer interest is intact.
🔨 Levels to Watch
* Key Resistance: 161 → 162.5 (GEX ceiling, prior swing highs)
* Support Zone: 157.5 → 155 (prior CHoCH and OB zone)
* Trendline: Acting as dynamic support from June lows
📌 Trading Plan (1H Price Action Focus)
Long Setup
* Trigger: Break above 161 with bullish candle close and volume
* Entry: 161.20–161.50
* Stop: Below 159.80 (last demand zone wick)
* Target: 165 first, then 167.5
* Bias: Trend continuation + gamma squeeze
Short Setup
* Trigger: Rejection at 162.5 with bearish engulfing or shooting star
* Entry: 161.80–162.50
* Stop: Above 163
* Target: 157.5 → 155
* Bias: Fade extended rally into gamma wall
🧠 Summary
NVDA is perched just under a powerful options-driven ceiling. Whether this turns into a breakout squeeze or a sharp rejection depends on how price reacts to the 161–162.5 zone. Traders should prepare for both scenarios with defined-risk debit spreads and lean into price confirmation before committing.
This analysis is for educational purposes only and does not constitute financial advice. Always do your own research and manage risk carefully.
Nvidia - New all time highs!Nvidia - NASDAQ:NVDA - breaks out now:
(click chart above to see the in depth analysis👆🏻)
Within two and a half months, Nvidia rallied more than +70%. Following this recent bullish strength, a retest of the previous highs was totally expected. But this does not seem to be the end at all. There is a much higher chance that we will see new all time highs soon.
Levels to watch: $150
Keep your long term vision🙏🙏
Philip (BasicTrading)

NVDA Analysis To 164?Quick breakdown of NVDA
Appears we hit our corrected level, we could go deeper possibly or hold at this level and drive up to 164
This is looking like a nice little setup long indeed
Trade Smarter Live Better
Kris/Mindbloome Exchange
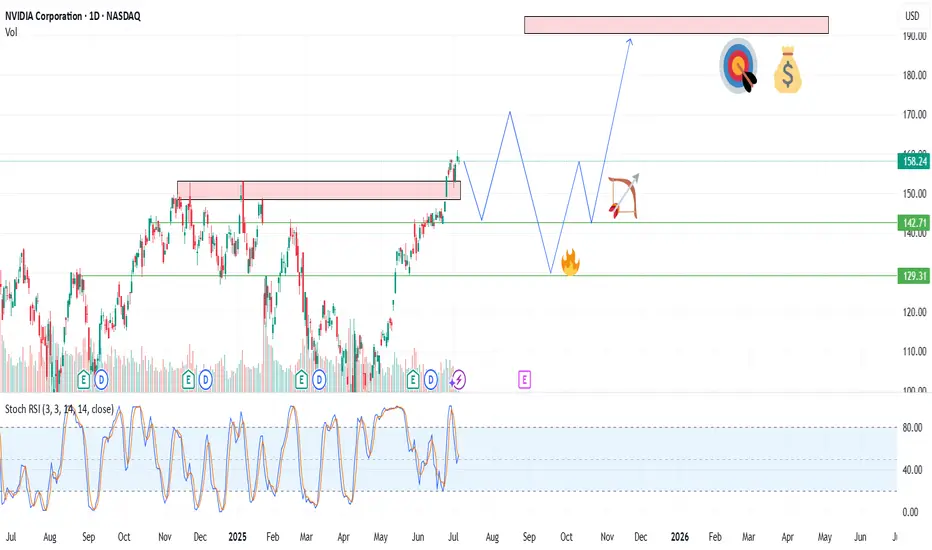
NVIDIA (NVDA)-Trade PlanNVDA, After an explosive run powered by GenAI infrastructure and bullish earnings, the chart is setting up for either a bullish continuation or a healthy pullback.
With volatility tightening and volume compressing, this is a great moment to prepare for either breakout or breakdown scenarios.
🎯 Trade Plan – Tiered Long Setup
📌 Entry Zones (Tiered Buying):
🔹 $150
🔸 $140
🔻 $120
📈 Profit Targets:
TP1: $160
TP2: $175
TP3: $200+ – Long-term continuation play if AI macro momentum persists
📌 DISCLAIMER: This idea is for educational purposes only. Always use proper risk management and assess your own strategy
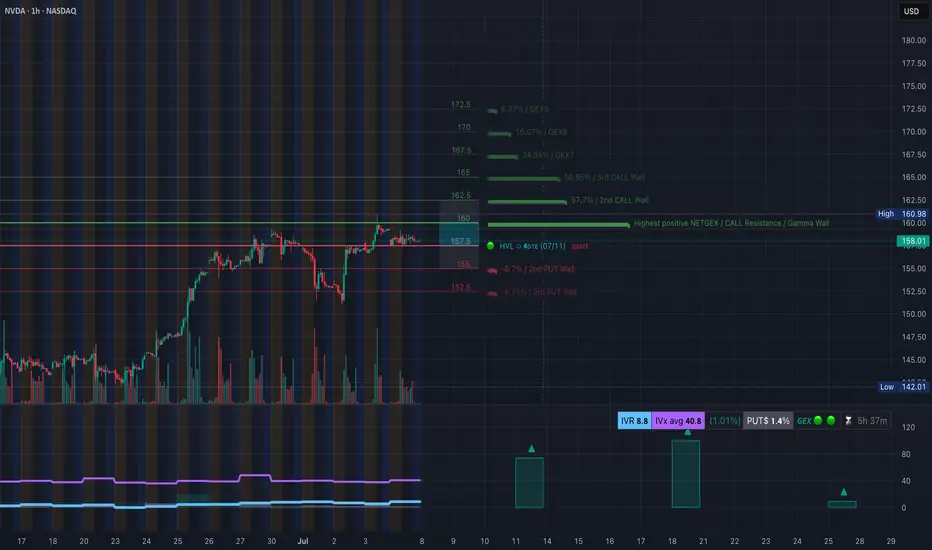
NVDA at a Make-or-Break Zone – Trade Setups Ahead 🔍 Options GEX Insights (Gamma Exposure):
* GEX Map Observation:
* NVDA is currently trading near 158, slightly under the major Gamma Wall at 160.98.
* This level marks the highest positive net GEX – strong resistance due to heavy call positioning.
* Above that, additional call walls stack at 162.5 → 165 → 167.5, creating a squeeze zone if price breaks out.
* Below, support levels sit at 155 (2nd PUT wall) and 152.5 (3rd PUT wall).
* Volatility & Options Sentiment:
* IVR: 8.8, IVx: 40.8 – low implied volatility rank = cheap options.
* Put Positioning: Only 1.4% = call-heavy environment, skewed bullish.
* Positive GEX (+) across expiries shows dealers will hedge upward if we move beyond 161.
🟢 Bullish Scenario (Breakout/Squeeze Setup):
* Break over 160.98 could ignite a gamma squeeze toward 165–167.5 range.
* Ideal for low delta CALL verticals or debit spreads targeting the 165 zone.
* Weekly options are cheap due to low IV.
🔴 Bearish Rejection Scenario:
* If price stays pinned under 160 and loses 155, dealers start to de-hedge – momentum toward 152/150.
* Consider put spreads or a cautious fade if it breaks structure.
📌 GEX Summary Suggestion:
If NVDA stays under 160, price may remain pinned or retrace. But above 161 opens the gamma doors to 165+. Cheap IV = opportunity.
📊 1-Hour Price Action Technicals:
* Market Structure:
* Previous BOS toward the upside has stalled inside a consolidation box under 160.
* Multiple CHoCH zones form below current price, hinting at exhaustion.
* Price is stuck within a wedge, coiling beneath resistance = compression phase.
* Support & Resistance Zones:
* Resistance: 159.34 → 160.98 (Gamma Wall and price supply).
* Support: 155.34, then 151.10.
* Bullish OB remains untested around 151 area if price flushes.
* Volume & Trend:
* Volume declining during chop = balance phase.
* RSI & MACD show slight bearish divergence, favoring caution near top of range.
⚙️ Trade Thoughts:
* Scalp Setup:
* Above 160.98 = scalp long toward 162.5/165, tight stop at 159.3.
* Below 155 = scalp short toward 152 zone.
* Swing Setup:
* Long only on strong breakout close above 161 with volume.
* Short swing possible under 155 if CHoCH confirms trend flip.
Conclusion:
NVDA sits at the pivot point of either breaking out toward 165+ or rejecting and retracing toward 152. GEX and price both hint at a coiled move ahead. Stay nimble, follow the volume.
Disclaimer: This analysis is for educational purposes only and does not constitute financial advice. Trade at your own risk.
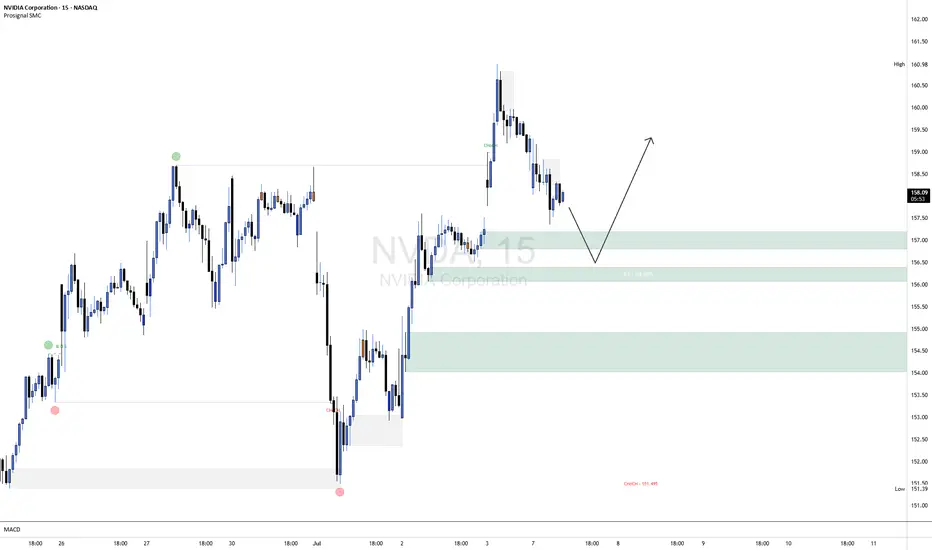
NVDA ShortNVDA is currently exhibiting short-term bearish order flow on the 15-minute chart, with price making lower highs and lower lows following a clear CHoCH (Change of Character) to the downside. The current leg suggests continued weakness as price retraces toward the highlighted bullish order block around the 156.20–157.00 range, aligning closely with the 50% equilibrium level of the last bullish impulse.
This area represents a high-probability demand zone where we anticipate a potential bullish reaction. A confirmation entry (e.g., bullish BOS or lower timeframe CHoCH within the OB) will be required to validate a long setup from this zone. Should confirmation present itself, upside targets can be trailed back toward recent highs near 159.00–160.00.
Risk Management Note:
Always wait for confirmation before entering against the prevailing short-term trend. Use a well-defined stop-loss below the order block and calculate your position size based on your overall risk tolerance (typically 0.5–1% of account equity per trade). Avoid overleveraging, and remember that patience and discipline are key to capital preservation.
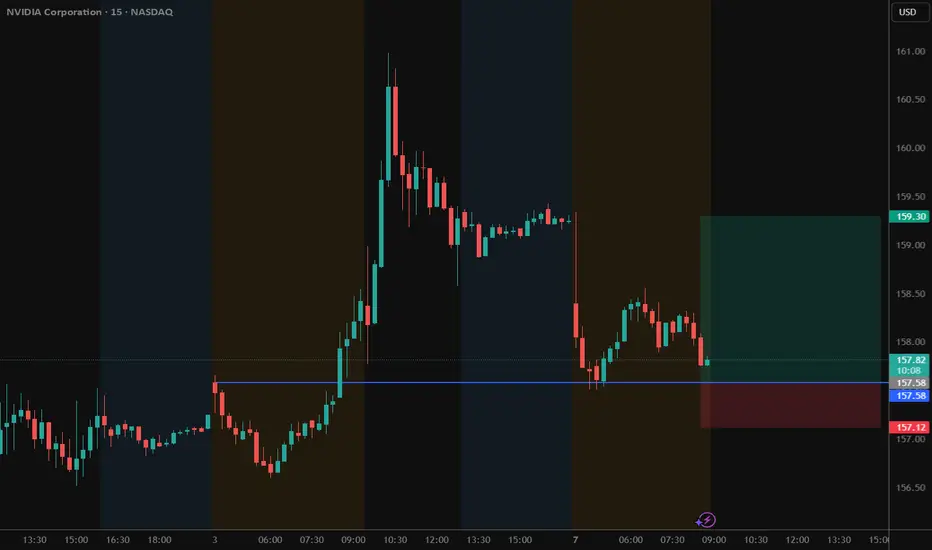
(NVDA) Long Pre-Market position off of previous support. Should wick down, grab liquidity then continue upwards.
How To Spot The Breakout In 3 Steps Or More..In this video we dive into how to spot the breakout
but here is a catch we are using the Stochastic RSI
to spot these breakouts.
Also this spotting of these breakouts is happening
together with the Rocket booster
strategy.
Watch this video to learn more.
Disclaimer:Trading is risky please learn risk management and profit
taking strategies.Also feel free to use a simulation trading account
before you trade with real money.

NVIDIA NVIDIA (NVDA) CORP IS LEADING IN AI CHIPS
NVIDIA closed the week in a massive green candle at $159.34 , marking a new all-time high.
NVIDIA’s market capitalization is approximately $3.89 trillion, making it the world’s most valuable publicly traded company as of July 2025.
Financial Performance
Q1 Fiscal 2026 (ended April 27, 2025):
Revenue: $44.1 billion (up 12% quarter-over-quarter, up 69% year-over-year)
GAAP EPS: $0.76; Non-GAAP EPS: $0.81
Gross Margin: 60.5% (61.0% non-GAAP), impacted by a $4.5 billion charge related to US export restrictions to China
Fiscal 2025 (ended January 2025):
Revenue: $130.5 billion (up 114% year-over-year)
GAAP EPS: $2.94 (up 147% year-over-year)
Non-GAAP EPS: $2.99 (up 130% year-over-year)
Business Highlights
AI and Data Center Leadership:
NVIDIA’s explosive growth is driven by surging demand for its AI chips, especially in data centers. The company’s Hopper and Blackwell GPU platforms are in high demand, with Blackwell samples now shipping to partners and customers.
Robotics and Automotive Expansion:
Robotics is emerging as a major growth area. NVIDIA’s robotics and automotive division generated $1.7 billion in revenue last year, with projections to exceed $7.5 billion by the early 2030s. The company recently unveiled the AEON humanoid robot and continues to invest in platforms for autonomous vehicles and industrial automation.
Product Innovation:
At Computex 2025, NVIDIA announced new AI infrastructure technologies, including NVLink Fusion and the Isaac GR00T-Dreams platform for robotics. The company is also expanding into custom AI server solutions and ARM-based CPUs for PCs and servers.
NVIDIA remains moderately bullish, the Bullish scenarios/probability could potentially reclaim $200–$250 per share in 2025 if AI demand accelerates and China market headwinds ease.
Growth Drivers:
Continued AI adoption across industries
Expansion in robotics, automotive, and cloud infrastructure
Strategic partnerships and global supply chain investments
Recent News
Market Leadership:
NVIDIA briefly surpassed Microsoft and Apple to become the most valuable company in history, with a market cap nearing $3.92 trillion.
Dividend:
The next quarterly cash dividend of $0.01 per share was paid on July 3, 2025.
Summary Table
Metric Value (July 2025)
Stock Price $159.34
Market Cap $3.89 trillion
Q1 FY26 Revenue $44.1 billion
Q1 FY26 EPS $0.76 (GAAP), $0.81 (non-GAAP)
Fiscal 2025 Revenue $130.5 billion
Fiscal 2025 EPS $2.94 (GAAP), $2.99 (non-GAAP)
Dividend (Quarterly) $0.01/share
NVIDIA remains the global leader in AI and accelerated computing, with record financial results, a dominant market position, and ambitious expansion into robotics and next-generation computing platforms.
#NVIDIA #AI #STOCKS

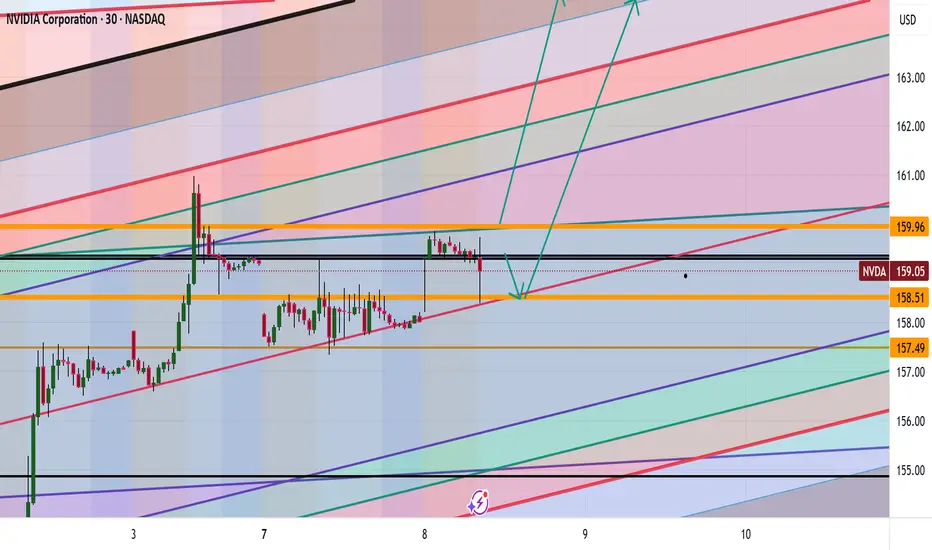
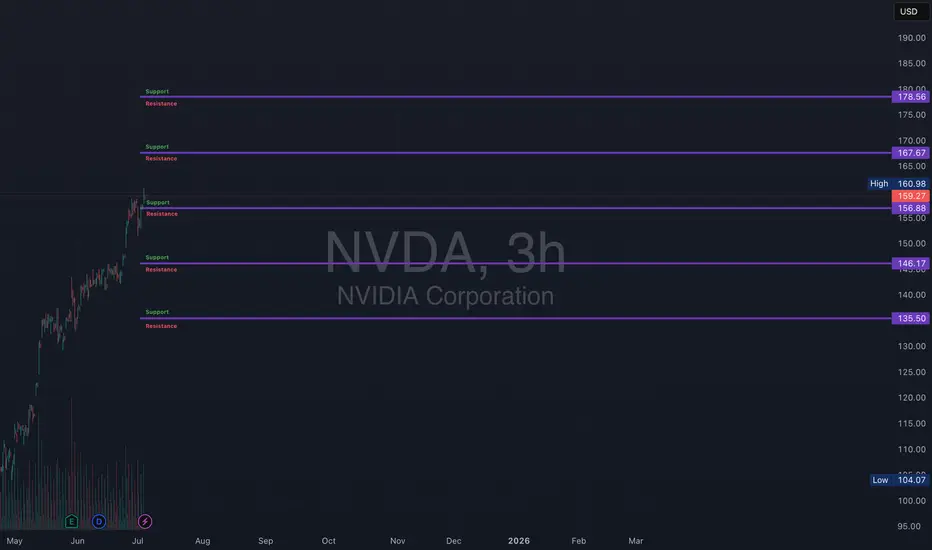
NVDA Support and Resistance Lines Valid from July 1 to 31st 2025Overview:
These purple lines act as Support and resistance lines when the price moves into these lines from the bottom or the top direction. Based on the direction of the price movement, one can take long or short entries.
Trading Timeframes
I usually use 30min candlesticks to swing trade options by holding 2-3 days max. Anyone can also use 3hr or 4hrs to do 2 weeks max swing trades for massive up or down movements.
I post these 1st week of every month and they are valid till the end of the month.
NVIDIANVIDIA is due for correction, anytime it can start. This week probably would be a good week to start the correction.
Disclosure: We are part of Trade Nation's Influencer program and receive a monthly fee for using their TradingView charts in our analysis.
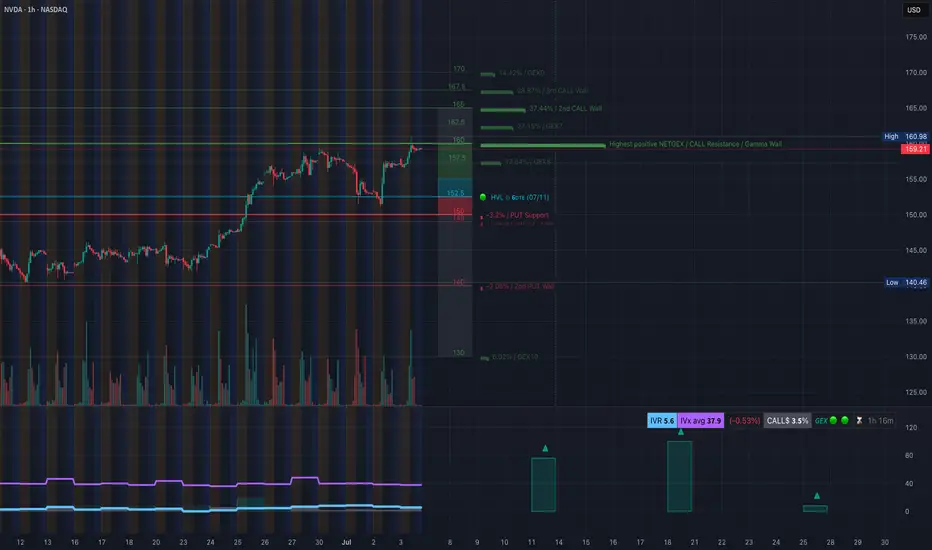
NVDA GEX Analysis for Options Trading. Jul 7Gamma Exposure (GEX) Insights – July 5, 2025
* 📍Key Gamma Wall (Resistance):
→ 160.98 — Highest positive GEX level (strong call wall / gamma resistance).
→ 162.5 — Next large call wall, acting as a magnet or rejection pivot.
→ 165 / 170 — Thin GEX above = squeeze zone if breakout occurs.
* 🧲 Support Side:
→ 152.5 – 150: HVL + Put Support + GEX pocket.
→ 140: Second PUT wall, deeper support if breakdown worsens.
* 📉 IV Sentiment:
→ IVR: 5.6, IVx avg: 37.9 = Low implied volatility.
→ Current IV crush environment favors debit call spreads or directional long calls with tight risk.
* 📊 Call/Put Flow:
→ Calls: 3.3%, Puts: -0.53%
→ Slight bullish bias but not overcrowded — room for gamma expansion.
🔄 Options Trade Setups Based on GEX
Bullish Gamma Squeeze Setup:
🟢 Trigger: Price breaks and holds above 161.
🧨 Target: 165 → 170 (thin GEX zone could cause sharp move).
🛡️ Strategy: Buy 160C / Sell 165C (debit spread) or long 162.5C with defined stop.
⛔ Stop: If NVDA fails to hold above 158.
Bearish Gamma Rejection Setup:
🔴 Trigger: Rejection at 160.98–162.5 zone with volume fade.
🎯 Target: 156.5 → 152.
🛡️ Strategy: Long 160P / Short 155P (bear put spread) or short 162.5C naked if IV allows.
⛔ Stop: Breakout above 162.5 invalidates this setup.
📈 1-Hour Chart Technical Analysis
Structure & Price Action:
* NVDA is in bullish market structure, forming higher lows with a clean CHoCH → BOS → retest play.
* It reclaimed the 159.20 level and is testing the 160.98–162.5 zone — a key area where momentum traders will engage.
Zones to Watch:
* Support:
→ 156.68 (minor swing support)
→ 153–152 OB zone (valid bullish OB + HVL)
* Resistance:
→ 161–162.5 (GEX resistance + supply)
→ Above 162.5 opens room to 165+
Trend & Volume:
* Strong bullish candle breaking BOS.
* Volume picked up during BOS, but follow-through needs to come with breakout candles or retest hold.
🔍 My Suggestions for Intraday/Swing Traders:
✅ Bullish Setup:
If NVDA holds above 159.20 and reclaims 161, enter on retest of 160.50.
TP1: 162.5
TP2: 165
SL: Below 157.80
❌ Bearish Setup:
If price gets rejected near 162 and breaks below 157.80 → short retracement to 153.
TP1: 156.5
TP2: 152
SL: Above 162.50
My View:
Currently bullish bias but entering a decision zone. Wait for clean breakout with volume, or short rejection if momentum fades. Keep GEX in mind — above 162.5 has little resistance and can rip.
This breakdown is for educational purposes only and not financial advice. Always manage your risk before taking a trade.
Inevitable Pull Back Coming Soon?| NVDA TSLA AAPL AMZN META MSFTStock market Forecast | QQQ SPY CME_MINI:NQ1! CME_MINI:ES1!
Mag 7 FORECAST| NASDAQ:NVDA NASDAQ:TSLA AAPL AMZN META MSFT July 2025 Forecast
