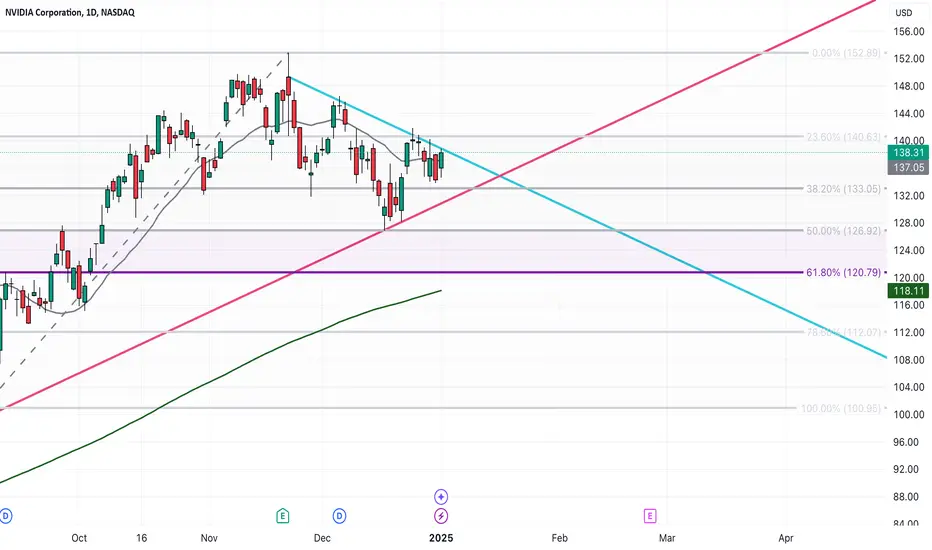
Strong ConsolidationNVDA is currently in strong consolidation, and I’m watching for a breakout above the blue trend line to enter long. The stock remains in a strong uptrend, holding above the 200MA. I’m also prepared for a bearish outlook if the price breaks below the pink trend line. I’m patiently waiting for confirmation to initiate a swing trade.
NVDA trade ideas
NVDA Z-Wave Coming to and End | -50%Z Wave coming to an end as the Trend Reader is overbought with weak price action
As shown I've highlighted the buyer in comparison and price is decreasing at each pump with the same amount in pullbacks except for this 3rd rally you can see price pulled back around 50% which can indicate the bears stating to roll in as buyers keep getting weaker.
Probably 30% increase before we see any significant selling, once price enters Top Zone ~($185) we'll look for short opportunities.

$NVDA TARGET $150NASDAQ:NVDA leading chip sector again going into wave 5 .. DAILY MACD looking bullish .RSI ready to run big
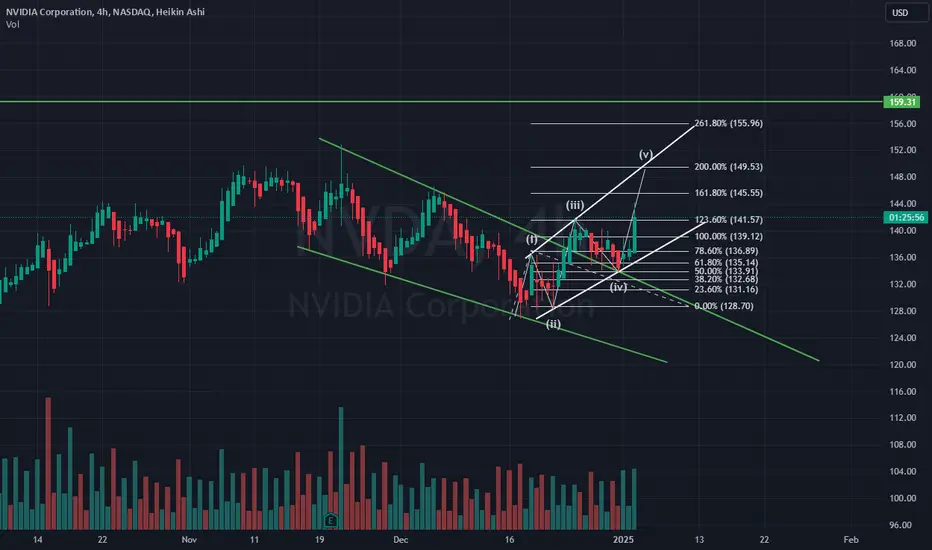
Nvidia's PRIMED for NEXT LEG UP NASDAQ:NVDA looks like the bottom is in and upon today's weekly close, if price closes above previous weekly candle high, that will trigger the next leg up with first target of $180.
Next key level to look for is previous all time high but for now, we might have a temporary bottom.
There is an active bullish time at mode trend set to expire on March with next target of $180.

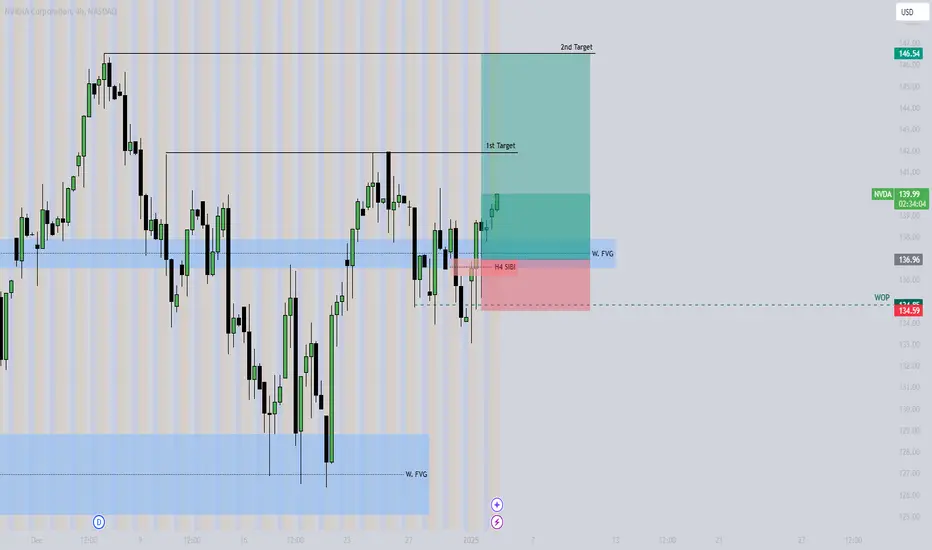
NVDA SwingNVDA longs swing trade idea based on invalidation of recent H4 SIBI and possibly W. SIBI (early confirmation). NVDA was stronger even when QQQ and other tech stocks dipped. Need Nasdaq to have some sort of upward movement to support this trade idea.
Nvidia TOP 2. The Top 30 Assets by Market CapitalisationDid you know that Gold leads the pack with a staggering $17.6 trillion market cap? It’s by far the largest asset, reflecting its status as a timeless store of value.
Right behind, Apple dominates the corporate world with $3.9 trillion, showcasing its unparalleled influence in technology and innovation. Other tech giants like Nvidia ($3.4T), Microsoft ($3.3T)) and Amazon ($2.4T hold strong positions, demonstrating the power of the digital age.
Surprisingly, Silver and Aramco represent the physical commodities sector, with $1.7T and $1.8T, respectively, emphasizing the enduring importance of natural resources.
Financial heavyweights like JP Morgan ($682B) and SPDR ($543B) also make the list, proving the global reach of banking and ETFs.
And here is so much room for Bitcoin to increase in value, especially if it compared to physical Gold.
These rankings highlight the diversity of assets shaping our world—spanning tech, finance, energy, and precious metals.
Do you believe that Nvidia still has power to get TOP 1 place?
Let me know in comments.
Your sincerely,
Mister iM

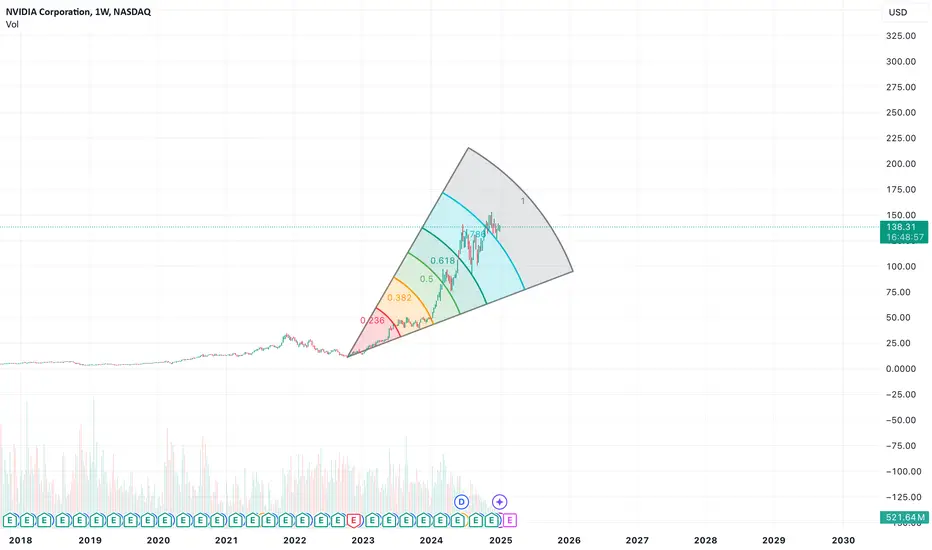
Nvidia Fib WedgeNASDAQ:NVDA
This chart looks so good like wow. Made this fib wedge and I like that I see some interesting signs of a trend. Going to discuss what I see and look at what direction this stock is going to go.
First, each time you went right through each fib to find a local high then came back down to consolidate. The interesting thing is the last 3 fibs show once you consolidated and touch the fib again it was a local bottom, which eventually led to new all time highs.
The consolidation in each zone led to a touch of the fib line and marked a local bottom. What I noticed is it looks like this happen recently again. 126.86 on a low in the candle for a close of 134.70 is the local bottom, which the last 3 times showed that you can make your way back to the highs on the stock. After making it back to highs on the stock, eventually led to new all time highs.
Comment what you think about this chart.
Comment any tips or suggestions.
NASDAQ:NVDA
12/27/24 - $nvda - don't overthink it. $200 in '2512/27/24 :: VROCKSTAR :: NASDAQ:NVDA
don't overthink it. $200 in '25
- while you might be distracted by the 10x's being made in these last few months... space memes, salad bots, and now quantum fanboi <3, don't get lost in the meme and miss the best long with the best sharpe out there, NASDAQ:NVDA
- while you scan X and there are mentions (valid) of application specific chips, NASDAQ:GOOGL and NASDAQ:AVGO come to mind, as does NASDAQ:AMZN , the demand for NASDAQ:NVDA 's silicon and cuda moat, nevermind the networking (M&A...) that have built this monster essentially mean there is *unlimited* demand.
- while the AMEX:VOO FIRE bro's are happy to own a ton of NASDAQ:AAPL , let the smooth brain maintain it's contour. paying 35x for barely 10% EPS growth and at the whim of consumer's cracked out on CC debt is "better than fiat". cool. but we want the ultimate denominator that's a good offset to our CRYPTOCAP:BTC position.
- NASDAQ:NVDA is growing EPS at 50+% for the next few years and trading at 30x PE. cash yields are still 3-4% at this growth. so "price target"? friend. 50x is more approps.
- will orange man create some shake and bake in the markets that involve china/ taiwan and put this at $100... $125... at some pt? god knows. and i'm not part of the klub, so i prefer my tool... math/ reason which allow me to create position sizing and conviction in what this co has delivered.
- took the oppty today to start re-building my length, even tho i'd also love the sticker lower. jan 17 2027 100C's for $60 is a good leg in. and i've got some ST gas on the Jan 17 2025 130C's b/c i see the stock strong in this tape and believe it's a core pick/ rotation from a lot of the trash that's rallied and runs hard into YE and early Jan (where i can monetize and creates some optionality). but if doesn't work/ i've not necked out, and can decide on right expires/ shares or play by ear.
- oh. and if this matters. because it should. it's a rare situation/ name where population growth and affluence/ consumer woes don't really factor in. the customers are fiat rich AF. population could get cut in half tmr, and NVDA will grow just as fast. would the stonk get nailed b/c passive flows, mkt risk off all that jazz? duh. but the pt is, the underpinnings are much more unique than most consumer/ tech plays.
- nvda remains at the epicenter of the AI disruption. and we might be inning 2? plan accordingly.
V

NVDA Approaching Crucial Levels! Trade Setups for Jan. 3, 2024NVDA Approaching Crucial Levels! Trade Setups You Need to Know 🚀"
* Current Trend:
NVDA is consolidating within a descending channel on the 1-hour chart, showing a range-bound movement. On the daily chart, it appears to be forming lower highs, indicative of a weakening uptrend with potential bearish continuation.
* Key Observations from Indicators:
* MACD (1-hour): Signals neutrality with no clear crossover, reflecting ongoing consolidation.
* Stochastic RSI (1-hour): Trending higher, suggesting a short-term recovery from oversold levels.
* Volume: Diminished during the recent pullback, indicating a lack of conviction from sellers, but no significant buying pressure yet.
Key Support and Resistance Levels (Daily Chart):
* Support Levels:
* $134: High Volume Node, with significant PUT activity in the GEX data.
* $132: Immediate support with a noticeable PUT wall.
* $130: Major support zone and the third PUT wall per GEX insights.
* Resistance Levels:
* $138: Immediate resistance and the highest positive GEX zone (CALL resistance).
* $140: Next significant resistance, aligning with a second CALL wall.
* $143-$144: Major resistance, marked by a strong CALL wall and historical rejections.
GEX Insights:
* Gamma Exposure (GEX):
* Positive GEX Zones: Above $138, CALL activity increases significantly, indicating a strong resistance level for upward movement.
* Negative GEX Zones: Below $134, gamma exposure becomes negative, suggesting increased downside volatility.
* Options Activity:
* IVR (Implied Volatility Rank) is at 20.2%, indicating relatively low implied volatility.
* A low CALL/PUT ratio reflects bearish sentiment, with sellers dominating near $132-$134.
Trade Scenarios:
Bullish Scenario:
* Entry: Above $138.
* Target: $140 (initial), $143-$144 (secondary).
* Stop-Loss: Below $134 to avoid downside risk.
Bearish Scenario:
* Entry: Below $134.
* Target: $132 (initial), with potential extension to $130.
* Stop-Loss: Above $138 to limit upside risk.
Conclusion:
NVDA is at a pivotal point, with $134 serving as a critical support level. Watch for a breakout above $138 for bullish momentum or a breakdown below $134 for bearish continuation. Volume and GEX levels should guide your directional bias.
Disclaimer:
This analysis is for educational purposes only and does not constitute financial advice. Always conduct your own research and trade responsibly.

NVIDIA correction might be overLooking at the market technically, I think the NVDA correction from the rally-up might be over now.
A buy from the current price is a good deal for me.
I will look at $140 and $150 as my TP1 and TP2.
Have a wonderful holiday season.

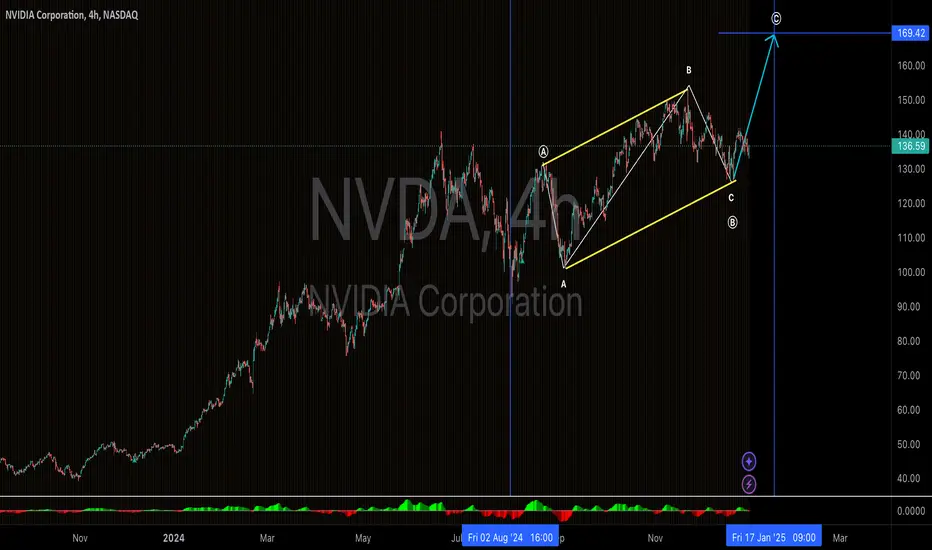
NVIDIA set to make one more higher high to $165?Technical Analysis:
================
A series of higher highs and higher lows in Weekly Timeframe:
NVIDIA has found support at $132, which previously acted as a resistance area during June, July, and August 24. If the stock continues to rise from this level, we could see another higher high (yellow cap) around $165. Alternatively, a deeper correction toward $104 could still be on the table if the support fails.
Fundamental Analysis:
==================
1) If NVIDIA struggles, it would suggest AI's momentum is waning—which is clearly not the case. This downtrend might simply reflect profit-taking by large traders.
2) The "Santa Rally" is in play, and NVIDIA appears to be on the "nice" list, signaling potential upward momentum.
3) NVIDIA's Blackwell product line is expected to contribute significantly to profits in the next quarterly earnings, potentially providing a substantial boost to the stock.
I bought NVIDIA stock at $145 and plan to hold sell at $160.

AI: The Future, and NVIDIA’s Crown !Artificial Intelligence? isn't just the next big thing—it's the thing.
The stock market? It’s not always about valuation—it’s about vision. Investors flock to what’s sexy and transformative, and AI is just that. NVIDIA's high profit margins and dominant position make it the clear winner. Yes, the stock might look expensive on paper, but the market rewards growth, potential, and leadership in the next frontier.
AI is the future, and NVIDIA is writing the playbook. Fundamentals matter, but in this era, the narrative of being the leader in a groundbreaking field is what drives the market.
Not a financial advice.
NVDA Technical Analysis and Options Trading Strategy Jan. 2, 251-Hour Chart Analysis (For Trading)
1. Price Action:
* NVDA is trading within a descending channel, respecting both the upper and lower trendlines.
* The price is near the lower channel boundary around $133-$134, suggesting a potential reversal zone.
2. Indicators:
* MACD: Bearish momentum persists with increasing red histogram bars, but the MACD lines are near a potential crossover.
* Stochastic RSI: Oversold, indicating a possible reversal in the short term.
3. Support and Resistance Levels:
* Support: $133 (trendline support), $130.
* Resistance: $137 (middle of the channel), $141 (upper channel boundary).
4. Trading Strategy:
* Entry (Long):
* Look for a reversal confirmation at the lower channel boundary near $133-$134.
* Ensure Stochastic RSI begins to rise from oversold levels, and MACD shows a bullish crossover.
* Entry (Short):
* If the price breaks below $133, consider shorting with a target of $130.
* Stop Loss:
* Long: Place stop-loss below $130.
* Short: Place stop-loss above $135.
* Target:
* Long: Initial target at $137, extended target at $141.
* Short: Target at $130.
Daily Chart Analysis (For Options Trading)
1. Options GEX Analysis:
* Call Walls (Resistance):
* $144 (3rd CALL Wall).
* $141 (2nd CALL Wall).
* Put Walls (Support):
* $133 (2nd PUT Wall).
* $130 (strong PUT support).
* Highest Positive NET GEX: At $137, indicating key pivot resistance.
* Highest Negative NET GEX: At $130, confirming strong support.
2. Implied Volatility and GEX Metrics:
* IVR: 21.2%, indicating moderate implied volatility.
* Options Oscillator: Calls at 21.2% and puts dominating at 26.4%, highlighting bearish sentiment.
3. Options Trade Strategy:
* Bullish Scenario:
* If NVDA reverses from $133, buy Call Options targeting $137-$141 with a strike price near $135, expiring in 1-2 weeks.
* Bearish Scenario:
* If NVDA breaks below $133, buy Put Options targeting $130 with a strike price near $132, expiring in 1-2 weeks.
* Neutral Strategy:
* Sell an Iron Condor with:
* Upper Leg: $141-$144 calls.
* Lower Leg: $130-$133 puts.
4. Risk Management:
* Bullish Calls: Exit if NVDA fails to break $137 with momentum.
* Bearish Puts: Exit if NVDA closes above $135.
Disclaimer:
This analysis is for educational purposes only and does not constitute financial advice. Please perform your own research and consult a financial advisor before making any trading decisions. All trading carries risks; trade responsibly.

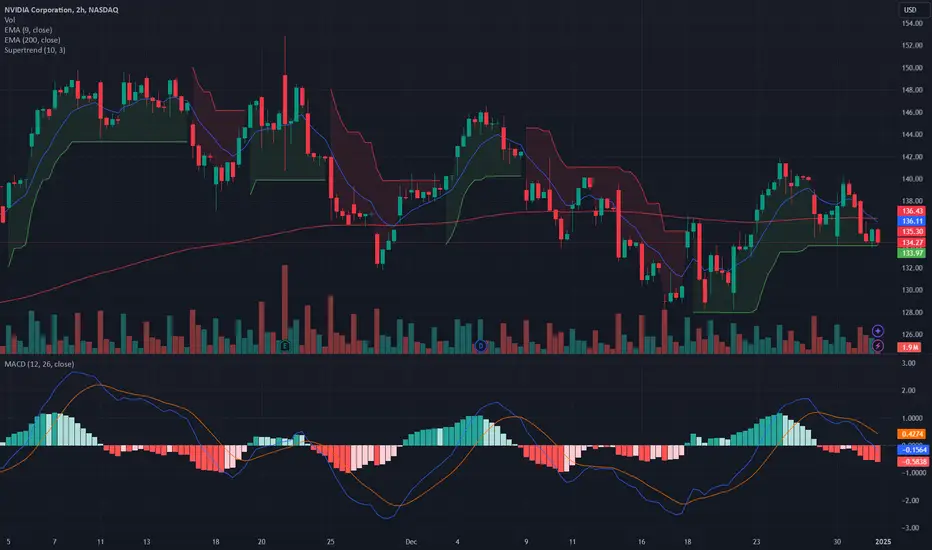
NVIDIA Corporation (NVDA): Testing Crucial lvl 🔥 LucanInvestor’s Commands:
🩸 Resistance: $136.11 and $138. A breakout above could target $140, restoring confidence among buyers.
🩸 Support: $133.97. A breakdown may lead to deeper retracements toward $132 and $130.
🔥 LucanInvestor’s Strategy:
🩸 Short: Below $133.97, targeting $132 and $130. Confirmation through increasing sell volume is key.
🩸 Long: Above $136.11, aiming for $138 and $140. Entry is only valid with bullish MACD crossover.
🩸 NVIDIA shows bearish MACD divergence, aligning with the "Sell" technical indicators. Current price action hovers around the 200 EMA, signaling indecision. A break in either direction will dictate the stock's next significant move.
👑 "Opportunities arise from clarity amidst the chaos. Stay sharp, stay ready." — LucanInvestor
NVDA- Nice patternNVDA- Nice pattern
-Reaccumulation on doww channel with less supply volume support.
-ABCD pattern.
-Fibo retracement to golden zone down target.
.
Let's see and buy the dip with plan.

