$PLTR: Regressive Heatmap🏛️ Research Notes
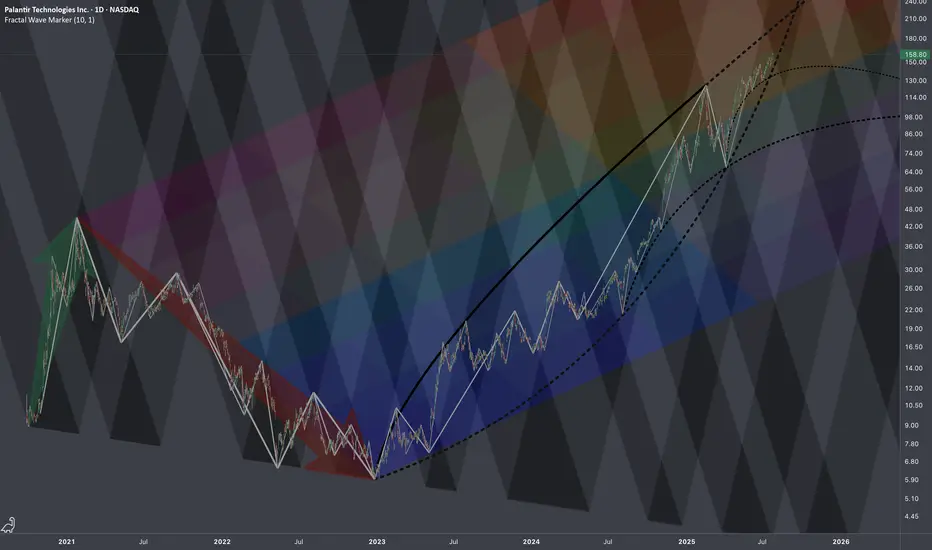
Technically this looks overbought, but fundamentally we know that under current administration this company is clear beneficiary (new contracts). Seems to explain why chart's dips were bought off extending bullish phases of cycle. However, there is still always a limit (as price keeps moving up, it alters the chances and magnitude of counter-move). Therefore, I'll test how wide range of 2021-2022yrs drop (prev cycle) can define the bullrun of current cycle. I'd say the very fact of anchoring the structure to actual chart points inherits its texture in next series of fractal based fib ratios.
All observed key coordinates build up into the following cross-cycle interconnections:
PLTR trade ideas
Guys take profit for PLN. A big correction coming soon.Guys take profit for PLN. A big correction coming soon. Based on technical, all the stock market over bull and a big correction coming with in a month. Pls be careful.
Palantir Technologies (PLTR) Shares Surpass $160Palantir Technologies (PLTR) Shares Surpass $160 for the First Time
Shares of Palantir Technologies (PLTR), a company specialising in big data analytics software, have continued their impressive performance. Following an extraordinary rally of approximately 340% in 2024, the stock remains among the top performers in the equity market:
→ since the beginning of 2025, the share price has climbed by approximately 113%;
→ on Friday, PLTR set another all-time high, with the share price exceeding $160 for the first time.
What Is Driving Palantir Technologies (PLTR) Higher?
The bullish sentiment is underpinned by the following factors:
→ Major partnerships. Among the contracts are an agreement with the US Army to develop a command system, collaboration with Accenture Federal Services, and many others.
→ Positive analyst outlooks , highlighting Palantir’s unique growth model and high margins. Analysts at Piper Sandler have set a price target of $170 for PLTR, while Wedbush recently raised their target to $160.
In addition, investors are looking ahead with optimism to the upcoming quarterly report scheduled for 4 August, which is expected to reinforce Palantir’s leadership position in a market increasingly driven by AI technologies.
Technical Analysis of Palantir Technologies (PLTR) Chart
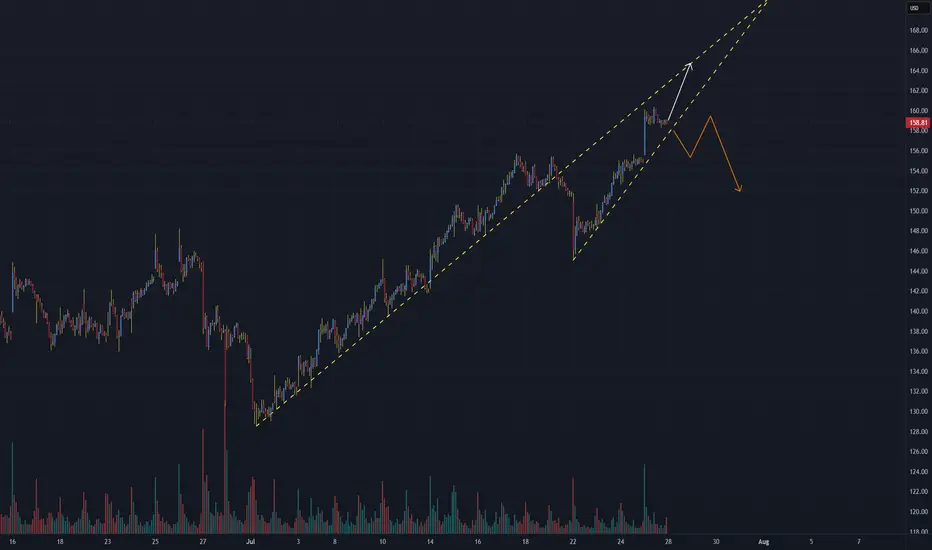
Price action has formed an ascending channel (shown in blue), with a notable bullish pattern: each pullback (marked with arrows) has been followed by:
→ a lack of further downside momentum;
→ a rebound above the level where the decline began.
From a sentiment perspective, it is reasonable to infer that price dips are perceived not as warning signs, but as opportunities to accumulate a high-performing stock at a relative discount.
Given these factors, we expect that the upcoming earnings report could propel PLTR shares towards the upper boundary of the blue channel.
This article represents the opinion of the Companies operating under the FXOpen brand only. It is not to be construed as an offer, solicitation, or recommendation with respect to products and services provided by the Companies operating under the FXOpen brand, nor is it to be considered financial advice.

Hot Take, PLTR is a BubbleHello I am the Cafe Trader.
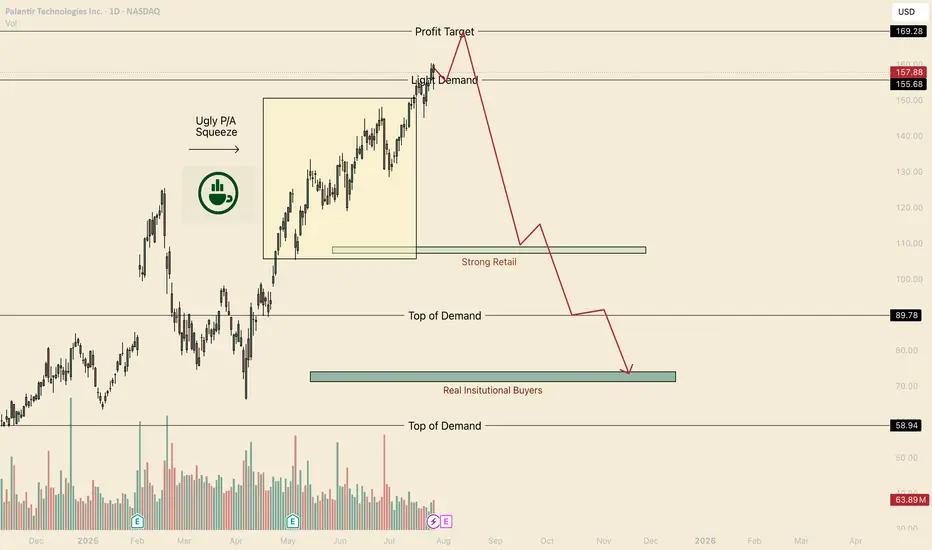
Price Action suggest we haven't had a proper buyer since $90.
Now I know that this can sound a bit off putting (especially if you bought above $90).
Even if this crashed, I am not suggesting you sell your long term position. I would instead look into hedging your position, giving yourself some exposure to the downside.
Consider these 2 non-biased reasons before writing me off.
Point 1
Price action suggests we have been in a short squeeze since April. Although in the short term I do see current retail buyers taking this to 169.
Point 2
If we do not land new Strong Buyer (someone that can support the price) all of this squeeze will come crashing back down to where they can support the price.
Conclusion
If we close below 152.50 on the day, this would suggest that bears have or are in control. This would expose many to tons of risk.
Here are my long Term prices for PLTR
Aggressive = 120
Fair = 107.50 - 108.50
Good = 89
Steal = 71-74.50
That's all for PLTR take a look at my other articles if you are interested in more!
Happy Trading!
@thecafetrader
7/28/25 - $pltr - Profit taking into print7/28/25 :: VROCKSTAR :: NASDAQ:PLTR
Profit taking into print
- no idea what print brings
- but mgmt have been sell-only
- valuation is what it is... inexplicable by anyone
- i'd not be surprised to see anything happen on the result
- but into result, big holders (read: not you) are likely going to see some profit taking/ risk mgmt given tape, outperformance
- could be a good hedge against other risk-on
- and if tape does see risk off, -ve gamma/ reflexivity largest here
V

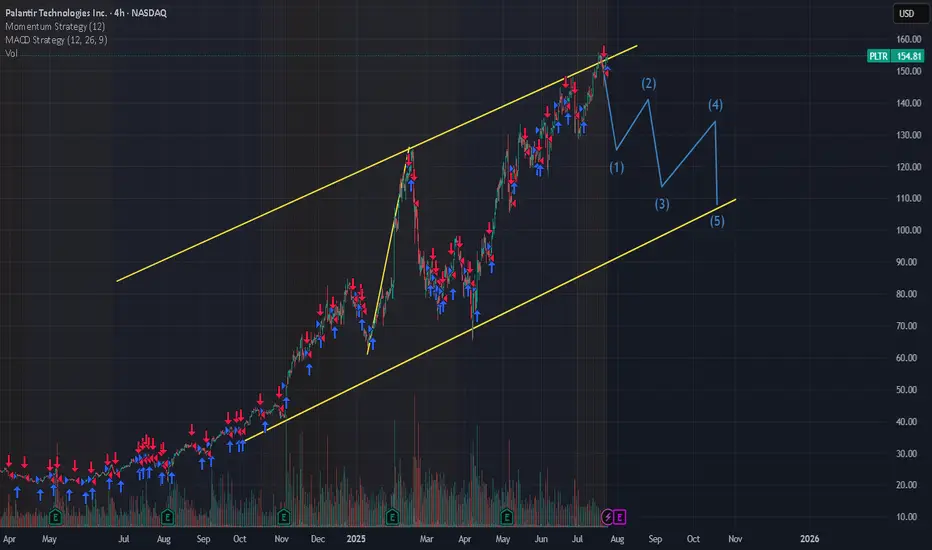
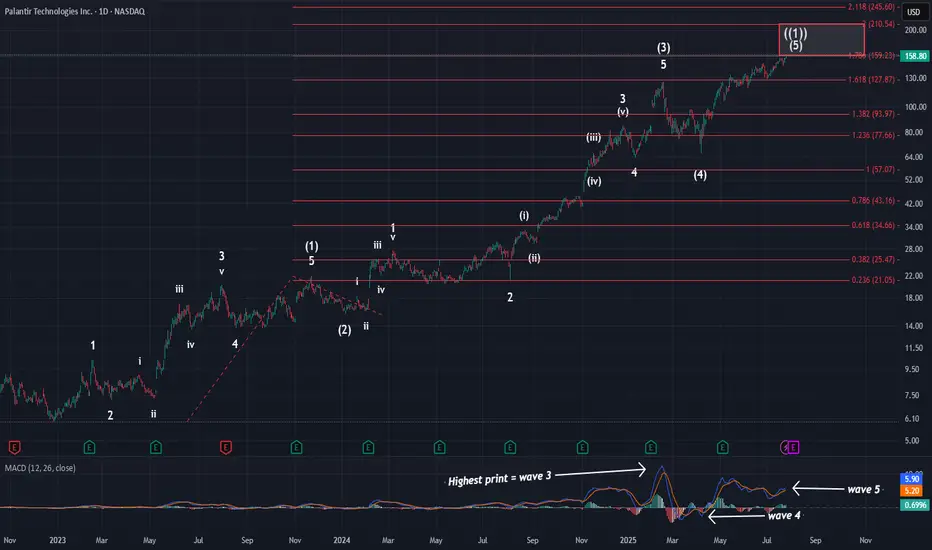
PalantirOn Friday, price hit the 1.236 extension and the larger red 1.786 extension @ $159. Tonight, I wanted to zoom out to show you where price is in the grand scheme of things. As you can see, we have all of the needed waves in place to consider this larger pattern complete. We have finally hit the standard target box for primary wave ((1)), and almost finished on what I am calling a smaller degree ED. This means that the reversal is soon at hand and that the initial move lower will be swift.
This primary wave ((1)) has lasted over 2.5 years. However, there is no way to predict exactly how long primary wave ((2)) will last. It could be short, or it could be long. Primary waves typically last months to even years to complete. Given the length of wave ((1)), I think it is safe to say wave ((2)) is likely to last over 1 year at the minimum. When our consolidation does kick off, we should be targeting the $50-$80 range for completion. Again, that won't happen fast. I will very likely take at least a year to complete.
For now, though, in the short term this pattern is putting the finishing touches on. Seeing this zoomed out picture again hopefully puts into perspective exactly how close we are to completion.
P.S: Looking at MACD, you can see I have labeled the larger waves. You can also see how much hidden bearish div we have at this time.
PLTR is doing it... pullback honeyThis video has my thoughts about PLTR and a trading view tip... the data window!!! Who knew?
Hope the talk inspires you as you decide on future investments; especially when it's stalling or pulling back.
My short term bias is bearish for a pullback on PLTR. Not sure when it will happen, but <155 is my trigger to see what I see.
What do you see?
**>162... slow your roll to see if 160 holds.

PLTR - Rising wedge formation leads to potentially larger move🧠 PLTR WEEKLY TECH+FUNDAMENTAL BRIEF
Ticker: NASDAQ:PLTR | Sector: AI / Big Data / Defense Tech
Date: July 27, 2025
🔍 Chart Watch: Rising Wedge Risk
Palantir is trading within a rising wedge formation, a pattern often signaling bearish reversal if upward momentum fades. Recent price action has tightened within this channel, and volume has been declining—a potential warning sign.
🔧 Key Technical Levels
Short-Term Resistance: $145–146
Short-Term Support: $140.50 → $137 → $132
Breakout Target: $150–155
Breakdown Risk: Below $137 could trigger $132–128
Trend Watch: If price holds wedge support, PLTR could climb toward the $150–155 range. A breakdown targets prior support at $135 or lower. Watch volume for confirmation.
💼 Palantir Fundamentals Snapshot
Q1 2025 Revenue: $884M (+39% YoY)
U.S. Commercial Growth: +71% YoY
Operating Margin: 36%
Free Cash Flow Margin (Projected): >40%
Cash Position: ~$4B
Profitability: GAAP positive for 7 straight quarters
Valuation: Forward P/S ~92–120x, Forward P/E ~200–230x
⚠️ High valuation implies heavy dependence on earnings momentum and contract wins. Any slip could lead to outsized pullbacks.
🧠 AI & Government Catalysts
Palantir continues to dominate the intersection of AI deployment and government data operations.
Notable Drivers:
$795M U.S. DoD Contract
Deep integration with agencies including CDC, IRS, Army, ICE, NHS
AI tools (AIP) deployed across sectors; strong commercial traction with Accenture, SAP, Microsoft Azure
Positioned as a critical AI infrastructure provider for NATO & U.S. defense modernization
AI Bootcamp strategy converting trial users into full deployments at scale
📆 What’s Ahead?
🔜 Upcoming Catalysts:
Q2 2025 Earnings (Early August):
Expected revenue: ~$937M (38–54% YoY growth range)
Federal Government Contracts:
Expansion of Project Maven, battlefield AI systems, and civilian data tools
AI Legislation & Spending Bills:
Ongoing policy developments could support longer-term tailwinds
🧭 Summary & Outlook
Timeframe Support Levels Resistance Levels Outlook Summary
Short-Term $140.5 → $137 → $132 $145–146 → $150–155 At wedge support. Breakdown could target low $130s unless buyers defend.
Near-Term $144.8–149.1; then $137 $159–160 → $170 (post-earnings) Strong fundamentals, but rich valuation demands execution.
🧩 Bottom Line:
PLTR remains an AI and defense-tech heavyweight. However, its current chart setup suggests caution in the near term. Watch for decisive moves around $145 and $140. Long-term bullish thesis remains intact, but the next move may hinge on Q2 earnings and AI contract flow.
Stay nimble.
PLTR Pressured at Key Support — Can $155 Hold? 8/1PLTR Pressured at Key Support — Can $155 Hold or Is a Break to $150 Next?
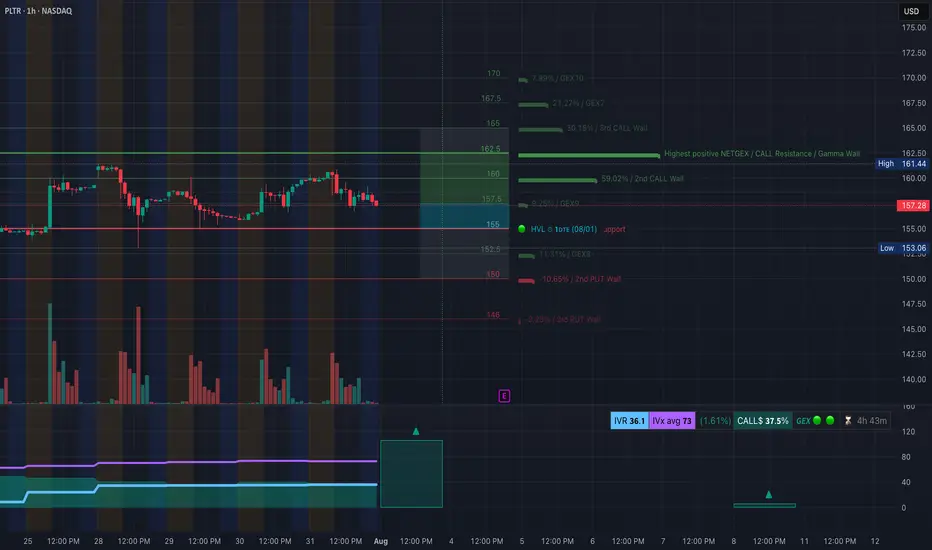
🔍 GEX & Options Flow Insight (1st Image Analysis)
PLTR has been sliding after failing to hold its $160+ range and is now testing the $155–156 gamma support. The GEX profile still shows moderate call dominance, but support is thin below this level, meaning a break could bring swift downside.
* Call Walls & Resistance:
* 📍 $160.14 → 2nd Call Wall (59.02% GEX)
* 📍 $161.44 → Gamma Wall / Highest positive NET GEX
* 📍 $162.50 → 3rd Call Wall resistance
* Put Walls & Support Zones:
* 🛡️ $155.94 → Current gamma pivot and support
* 🚨 $153.06–$154.91 → 2nd Put Wall & HVL zone — break here risks slide to $150
* 📉 $146.00 → 3rd Put Wall & major downside target
* Volatility Insight:
* IVR 36.1, IVx Avg 73 → Elevated volatility
* Call flow 37.5% → Still skewed bullish, but waning
* GEX sentiment: 🟢🟡🟢 = Cautiously bullish gamma positioning but losing ground
✅ Option Trading Suggestion:
Bias: Bearish if $156 fails; bullish recovery possible only above $160
Strategy: Bear put spread if $156 breaks
* Entry Idea: Buy 155P / Sell 150P (Aug 2 or Aug 9 expiry)
* Invalidation: Strong reclaim above $160
* Target: $153 → $150
Why this works: PLTR is nearing a key gamma inflection. Below $156, dealers may need to hedge by selling, fueling a sharper drop. Bulls need to defend this pivot.
🧠 Technical Analysis (1H Chart) (2nd Image Analysis)
Market Structure & SMC:
* 🟥 CHoCH confirmed after rejection at $160+
* ❌ Broke out of ascending structure to the downside
* Sitting just above prior BOS zone at $155
Trendline Dynamics:
* Broken short-term uptrend now acting as resistance
* Downward-sloping structure points toward $153–150 retest
SMC Zones:
* 🟩 Demand Zone: $155–$153 → Current defense area
* 🟥 Supply Zone (Purple Box): $160–$162.5 → Strong resistance cluster
🔄 Price Action & Key Levels
* Support:
* ✅ $155.94 → Gamma pivot / current defense
* ✅ $153.06–$154.91 → Last key support before major drop
* 🚨 $146.00 → Next downside target
* Resistance:
* 🚩 $160.14 → First upside target if bounce
* 🚩 $161.44–$162.50 → Gamma & call wall zone
🧭 Scalping / Intraday Trade Setup
🟥 Bearish Setup (Preferred):
* Entry: Breakdown under $156
* Target 1: $153.50
* Target 2: $150
* Stop: Above $158
🟩 Bullish Reversal Setup:
* Entry: Reclaim of $160 with volume
* Target 1: $161.44
* Target 2: $162.50
* Stop: Below $158
🔁 Summary Thoughts
* PLTR is at a critical gamma support level.
* A failure here brings a quick shot to $153–150.
* Bulls must defend $156 and reclaim $160 to flip structure back bullish.
* Options positioning still leans bullish but is weakening, meaning downside acceleration risk is real.
🚨 Disclaimer:
This analysis is for educational purposes only and does not constitute financial advice. Always do your own research and manage your risk accordingly.
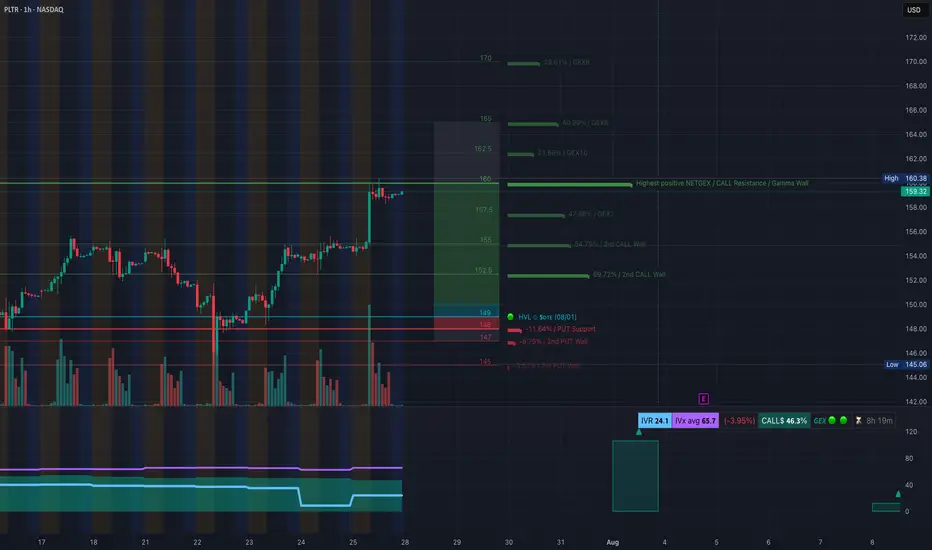
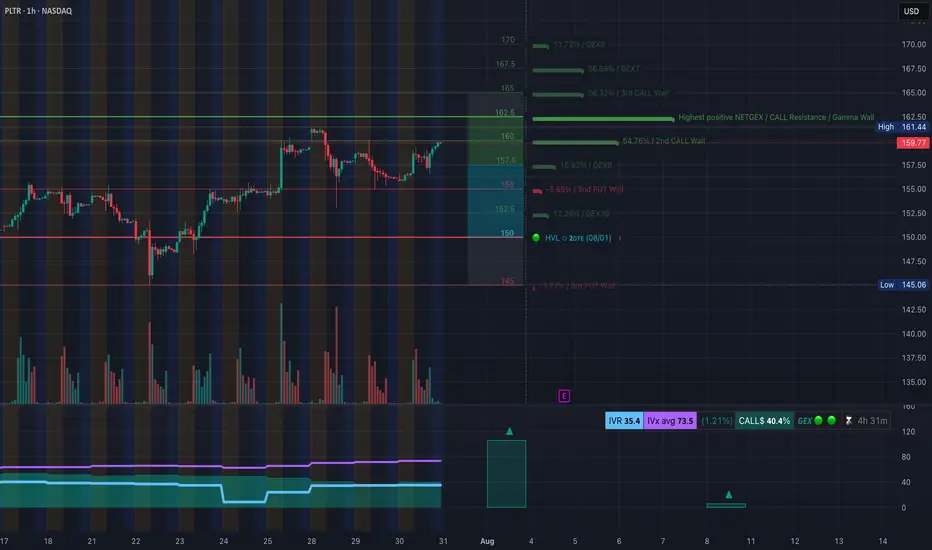
PLTR at Resistance Brink — Will It Break or Fade? Jul 28🔍 1-Hour GEX & Options Outlook
Palantir (PLTR) has reclaimed strength, now consolidating just below $160.38, which aligns with the Highest Positive GEX / Gamma Wall. The GEX stack gives us a powerful framework for potential options setups:
* $160.38 = Gamma Magnet – This is the wall where large call positioning accumulates. Price is currently pinned underneath, forming a short-term consolidation range.
* Above $160.38 opens the path toward:
* $162.5 (GEX10)
* $165 (GEX9)
* $170 (GEX9 top wall)
However, failure to break $160.38 cleanly could cause price to slide back to key support zones around:
* $157.5 (GEX Cluster, minor put wall zone)
* $152.5 (2nd Call Wall, liquidity pocket)
* $149–147 (High Volume Node + Put Support)
🧠 My thoughts: This is a textbook high gamma compression zone. If PLTR breaks and holds above $160.38 early in the week, it could trigger a gamma squeeze toward $165+. If it gets rejected again, short-term premiums may decay fast, and a move toward $152.5 is likely before any next leg.
🎯 Options Strategy:
* Bullish Setup:
* Entry: Over $160.50 with volume and confirmation.
* Target: $165, then $170.
* Contract: Aug 2nd or Aug 9th $165C.
* Stop: Below $157.5.
* Bearish Setup:
* If rejection from $160.38 with weakness.
* Target: $154.88 / $152.5.
* Contract: Aug 2nd $155P or $152.5P.
* Stop: Above $160.8.
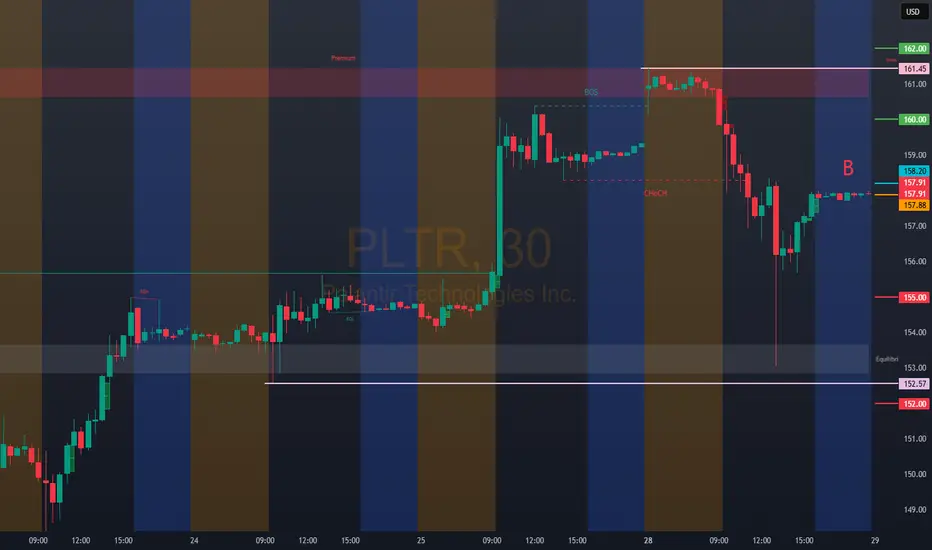
🕒 15-Minute Intraday TA
We saw a sharp rally followed by sideways compression in a narrow range between $159.32 and $160.38. The breakout leg was supported by a clear CHoCH (Change of Character) in the NY morning session followed by a BOS (Break of Structure) up.
Price has since been flagging within a parallel channel, forming a minor order block between $158.29 and $159.32. As we head into Monday’s session, here’s what to look for:
🟢 Bullish Intraday Scenario
* Look for price to hold the OB or do a liquidity sweep down to $158.29, then break above the current flag.
* A break and retest of $160.38 with rising volume sets up a clean scalp toward $162.
* Bias remains bullish as long as price stays above the rising channel and $157.5.
🔴 Bearish Intraday Scenario
* A break below $158.29 could trigger a fade toward the next support around $154.88 / $153.97.
* A mid-morning failed breakout above $160.38 that quickly reverses would be a trap short setup.
* If price falls below $157.5 early in the day, expect downside acceleration.
📌 Scalper’s Zone to Watch:
* $158.29–$159.32 = Bullish OB + Liquidity Zone.
* $160.38 = Resistance + Gamma Wall.
* $154.88–$153.97 = Demand zone if flush occurs.
🧠 Final Thoughts:
PLTR is at a pivotal level with serious GEX heat. It's consolidating right beneath a gamma ceiling that could either trigger a breakout squeeze or unwind. Use the first 15–30 minutes Monday to judge strength. Watch the reaction to $160.38 carefully — that’s the gatekeeper.
⚠️ Disclaimer:
This analysis is for educational purposes only and does not constitute financial advice. Always do your own research and manage your risk responsibly.
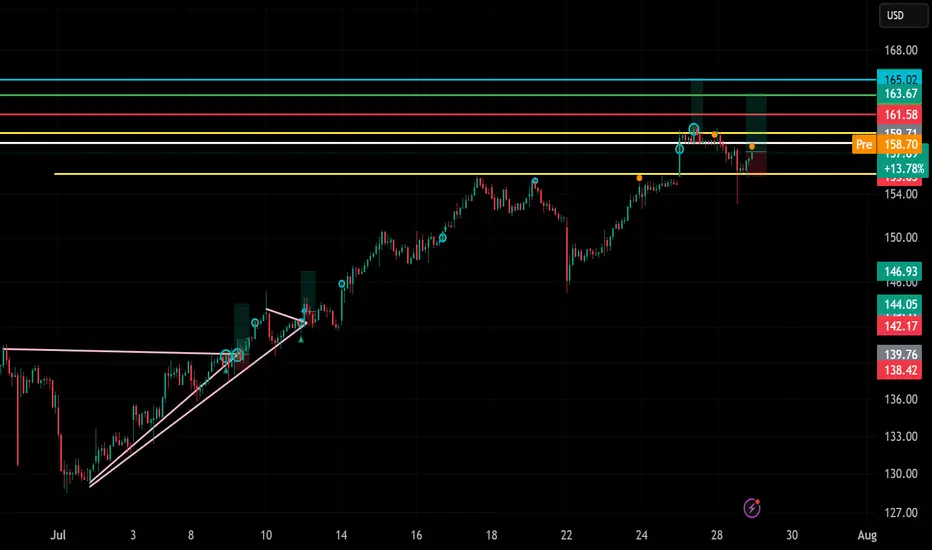
PLTR Long trade!🟢
You’re expecting price to move upward, and your chart reflects a breakout setup with multiple resistance levels marked.
🔍 Key Technical Elements Noted:
Ascending triangle breakout:
The pink trendlines show an ascending triangle (bullish pattern) that successfully broke out.
Support Zone:
Around 158.00 – 158.62 (highlighted by the yellow lines), showing a prior resistance turned into support.
Resistance Zones (Target Levels):
161.58
163.67
165.02
These cyan and red lines look like Fibonacci extensions or supply zones — ideal for profit targets.
Risk Level:
Likely below 158 or just under the recent wick — this acts as your stop-loss zone.
Volume/Breakout Candle:
Strong bullish candle visible near breakout level, confirming entry strength.
✅ Possible Long Trade Plan (Example):
Entry: Around $158.60 (current price)
Stop-Loss: Below $157.00 or candle low
Targets:
$161.58 (Target 1)
$163.67 (Target 2)
$165.02 (Final Target)
Long Setup for Continued Growth Potential Next WeekCurrent Price: $158.80
Direction: LONG
Targets:
- T1 = $162
- T2 = $166
Stop Levels:
- S1 = $157
- S2 = $153
**Wisdom of Professional Traders:**
This analysis synthesizes insights from thousands of professional traders and market experts, leveraging collective intelligence to identify high-probability trade setups. The wisdom of crowds principle suggests that aggregated market perspectives from experienced professionals often outperform individual forecasts, reducing cognitive biases and highlighting consensus opportunities in Palantir Technologies.
**Key Insights:**
Palantir Technologies has demonstrated remarkable resilience and strong market momentum, reflected in its substantial surge since early-year lows. Significant investor enthusiasm, coupled with robust fundamentals, has propelled the stock to all-time highs, suggesting further upside potential. Traders should monitor key levels at $160 (resistance) and $155 (support) to identify promising entry and profit-taking opportunities. Additionally, consistent earnings growth and strategic partnerships continue to enhance Palantir's attractiveness as a long-term play.
**Recent Performance:**
Palantir closed its last trading session with positive upward momentum, gaining +2.54% and marking a new high close. Its performance outpaces broader indices during the same period, demonstrating technical strength and sustained investor confidence. With steady gains and consistent returns through volatile markets, Palantir remains a compelling trade for growth-oriented investors.
**Expert Analysis:**
Analysts remain cautiously optimistic about Palantir’s near-term trajectory, emphasizing its resilience and growth-driven attributes. Predictions suggest potential sideways movement in the coming sessions, making pullbacks attractive for entry ahead of further bullish momentum. A strong earnings pattern and investor-driven rallies underpin expert calls for sustained upside potential, aligning it with other high-growth equities in the technology space.
**News Impact:**
Recent developments, including key advancements in Palantir's technology initiatives and strategic partnerships, have fueled market enthusiasm. Strong retail interest, coupled with favorable earnings updates, reinforces the stock's position as a favored choice among traders and investors seeking high-growth opportunities. Continued focus on innovation and expansion has added further confidence to Palantir’s trading outlook.
**Trading Recommendation:**
Given Palantir's recent price action, technical strength, and positive growth narrative, a long position is recommended. Monitor pullbacks to support levels for entry opportunities while maintaining stop losses below support at $153 to mitigate downside risk. Holding through potential resistance at $160 could lead to gains toward established targets at $162 and $166.
PLTR Breaking Out or Bull Trap? Jul 31PLTR Breaking Out or Bull Trap? Options Flow Says Bulls Might Win!
🔍 GEX & Options Flow Insight (1st Image Analysis)
PLTR is pushing into key resistance around $159.77, just under the 2nd CALL Wall at $161.44, with massive gamma clusters building overhead. Here's the breakdown:
* Call Walls & Gamma Resistance:
* 📍 $159.77 → Current wall that price is testing
* 📍 $161.44 → 2nd CALL Wall / Highest positive NET GEX
* 📍 $165–168 → 3rd Call Wall and deeper GEX levels = high resistance/squeeze potential
* Put Support Zones:
* 🔻 $155.00 / $153.00 / $151.06 → Multiple layers of liquidity and support
* 🛡️ $145.00 → 3rd PUT Wall = Strong downside defense
* Volatility Metrics:
* IVR: 35.4, IVx Avg: 73.5 → High IV suggests elevated premium
* Calls Flowing Heavy (40.4%), Bullish GEX 🌕🟢🟢
* Options sentiment is decisively bullish with strong open interest at upper walls
✅ Option Trading Suggestion:
Bias: Bullish momentum with caution at overhead resistance
Strategy: Debit Call Spread or Vertical Fly
* Entry Idea: Buy 160C / Sell 165C (or 168C) for Aug 2 or Aug 9
* Risk: Price must hold above $156.24 to remain valid
* Target: $161.44 → $165.00 if gamma squeeze plays out
Why this works: PLTR is pressing into a GEX transition zone. If price breaks through $161.44 with volume, dealers will likely hedge net short exposure by buying more, pushing toward $165+. But risk is tight — failure to break 160 convincingly can lead to fast reversal.
🧠 Technical Analysis (1H Chart) (2nd Image Analysis below)
Market Structure & SMC:
* ✅ CHoCH → BOS confirmed mid-July, with aggressive bullish structure
* ⚠️ CHoCH again on July 30 = possible trap or reload
* Price now retesting previous BOS zone under supply
Trendline Analysis:
* Ascending trendline holding support from July 29 to now
* Price approaching upper wedge resistance around $160–161
SMC Zones:
* Order Block Support: Around 156.24–154.91
* Reversal Zone / Supply: Purple box between 159.77–161.44 → Caution for fakeout traps
* Below 153.06, liquidity opens to HVL gap zone at 151–145
🔄 Price Action & Key Levels
* Support:
* ✅ 156.24 → Critical order block + trendline confluence
* ✅ 154.91 → Confirmed demand wick
* 🔻 151.06 → Liquidity base
* ⚠️ 145.00 → 3rd PUT Wall (GEX-based demand)
* Resistance:
* 🔼 159.77–161.44 → Major supply + 2nd Call Wall = high-conviction resistance
* 🚀 165.00 → Next wall for gamma expansion
* 🧨 Above that → Blowoff zone (168+)
📉 Bearish Reversal Zone
If price fails to close above 160 or gets rejected from 161.44, watch for:
* Breakdown to 156.24 → If this fails, opens up to 154.91 then sweep to 151.06
* Options IV is high → risk of premiums collapsing on rejection, so avoid chasing long OTM calls
🔁 Summary Thoughts
* PLTR is coiling tightly under a strong gamma ceiling with a bullish structure intact.
* Option flow shows aggressive CALL positioning, suggesting bulls are betting on breakout.
* Smart money might be stacking up before pushing through 161.44 — or could trap retail and unwind.
* Day traders can long above 157.5–158 on dips toward 160–161.44. Swing traders should avoid entries until breakout confirmation or dip to OB.
* Watch gamma squeeze to 165 if bulls break structure.
🚨 Disclaimer:
This analysis is for educational purposes only and does not constitute financial advice. Always do your own research and manage your risk accordingly.
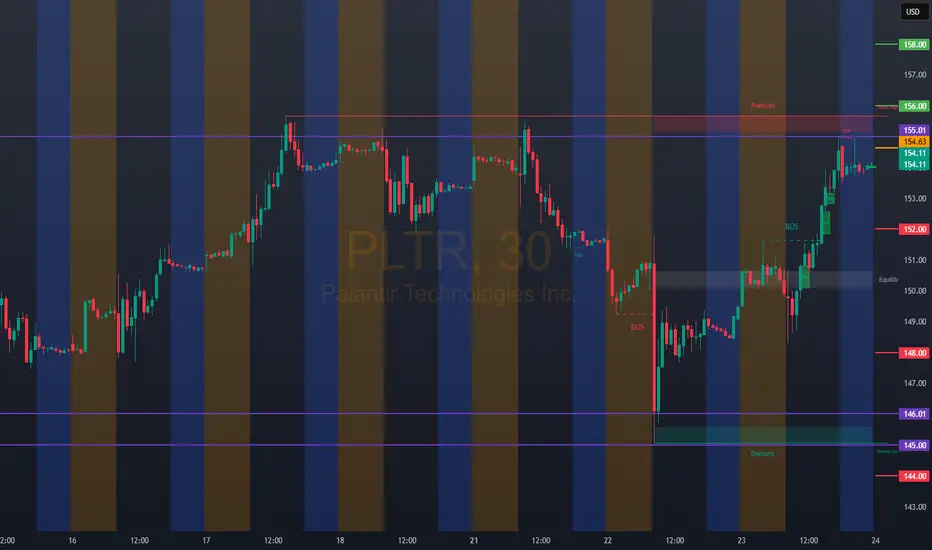
PLTR: (154.63)The idea that I am going to present below is based on technical and institutional entries. PLTR: Bullish Entry (156.00 / 158.00) Bullish Stop (154.00) Bullish Target 160.00 / 162.00 (Bearish Entry 152.00/148.00) Bearish Stop 154.00 (Bearish Target 146.00 / 144.00)
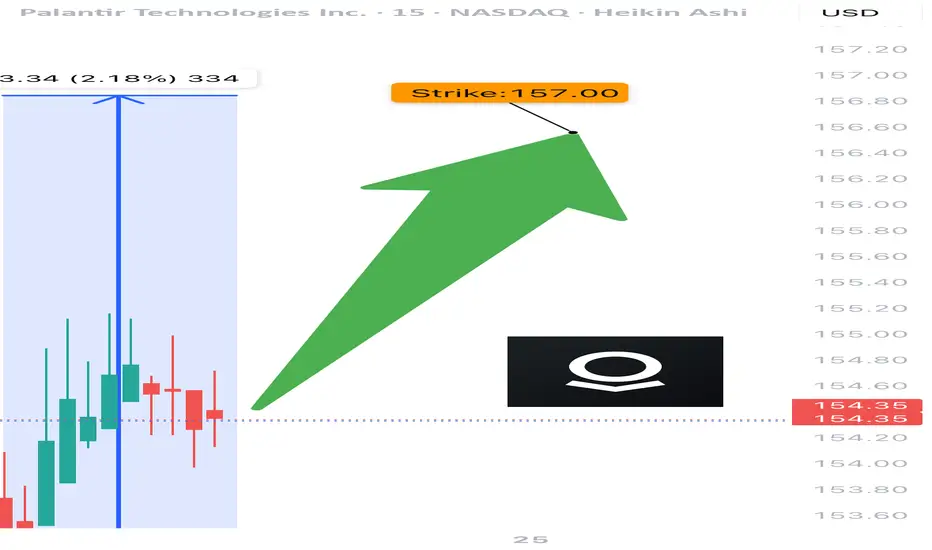
PLTR TRADE SIGNAL (07/24)
🚨 PLTR TRADE SIGNAL (07/24) 🚨
💥 Expiry in 1 day = HIGH GAMMA risk = BIG MOVES coming
🧠 Key Highlights:
• Call/Put Ratio: 1.40 → bullish options flow
• Strong institutional positioning 📈
• RSI cooling off = ⚠️ watch momentum
• Volume concerns → cautiously bullish
💥 TRADE SETUP
🟢 Buy PLTR $157.50 Call exp 7/25
💰 Entry: $0.59
🎯 Target: $0.89 (50%+)
🛑 Stop: $0.24
📈 Confidence: 65%
⚠️ Gamma + Time Decay = explosive but risky. Tight execution needed.
#PLTR #OptionsAlert #OptionsFlow #UnusualOptionsActivity #TechStocks #DayTrading #GammaSqueeze #TradingView #BullishSetup #CallOption
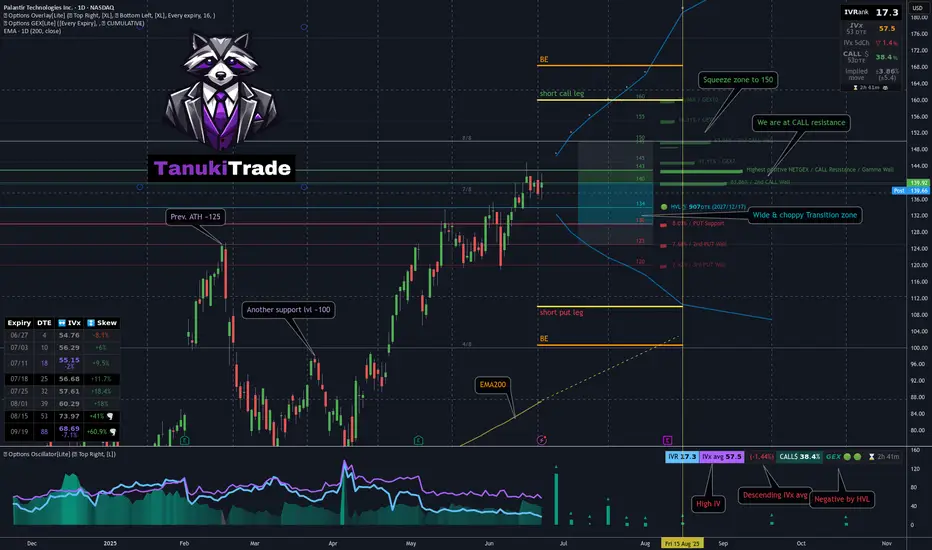
Jade Lizard on PLTR - My 53DTE Summer Theta PlayMany of you — and yes, I see you in my DMs 😄 — are trading PLTR, whether using LEAPS, wheeling, or covered calls.
I took a closer look. And guess what?
📈 After a strong move higher, PLTR was rejected right at the $143 call wall — pretty much all cumulative expiries cluster resistance there
Using the GEX Profile indicator, scanning all expirations:
After a brief dip, the market is repositioning bullish
Squeeze zone extends up to 150
The most distant GEX level is sitting at 160
On the downside, 130 is firm support, with some presence even at 120 — the market isn’t pricing in much risk below that
📉 From a technical standpoint:
We’re near all-time highs
125 (previous ATH) and 100 are key support levels
The OTM delta curve through August is wide, and the call side is paying well — with a current call pricing skew
🔬 IVx is at 57, trending lower + call pricing skew📉 IV Rank isn't particularly high, but the directional IVx matters more here
💡 Summer Theta Play: Jade Lizard on PLTR
Since I’ll be traveling this summer and don’t want to micromanage trades, I looked for something low-touch and high-confidence — and revisited an old favorite: the Jade Lizard.
If you're not familiar with the strategy, I recommend checking out Tastytrade's links and videos on Jade Lizards.
🔹 Why this setup?
Breakeven sits near $100, even with no management
On TastyTrade margin:~$1800 initial margin ~$830 max profit
53 DTE — plenty of time for theta to work
Earnings hit in August — I plan to close before then
Covers all bullish GEX resistance zones
Quickly turns profitable if IV doesn’t spike
Highly adjustable if needed
My conclusion: this strategy covers a much broader range than what the current GEX Profile shows across all expirations — so by my standards, I consider this to be a relatively lower-risk setup compared to most other symbols right now with similar theta strategies.
🔧 How would I adjust if needed?
If price moves up:
I’d roll the short put up to collect additional credit
Hold the call vertical as long as the curve supports it
If price drops:
Transition into a put ratio spread
Either extend or remove the call vertical depending on conditions
🛑 What’s the cut loss plan?
I have about 20% wiggle room on the upside, so I’m not too worried — but if price rips through 160 quickly, I’ll have to consider early closure.
If that happens, the decision depends on time:
If late in the cycle with low DTE:→ Take a small loss & roll out to next month for credit
If early with lots of DTE remaining:→ Consider converting to a butterfly, pushing out the call vertical for a small debit→ Offset this with credit from rolling the put upward
As always — stay sharp, manage your risk, and may the profit be with you.
See you next week!– Greg @ TanukiTrade
Palantir Technologies: Long Opportunity Amid AI MomentumCurrent Price: $153.52
Direction: LONG
Targets:
- T1 = $159.20
- T2 = $165.80
Stop Levels:
- S1 = $150.70
- S2 = $147.30
**Wisdom of Professional Traders:**
This analysis synthesizes insights from thousands of professional traders and market experts, leveraging collective intelligence to identify high-probability trade setups. The wisdom of crowds principle suggests that aggregated market perspectives from experienced professionals often outperform individual forecasts, reducing cognitive biases and highlighting consensus opportunities in Palantir Technologies.
**Key Insights:**
Palantir Technologies is positioned as a leading player in the AI and defense sector. Its profitability, expanding government contracts, and commercial growth provide solid fundamentals for long-term value. Institutional interest in Palantir has surged, with strong demand for its distinctive AI-driven analytics and software platforms. The upcoming earnings report on November 4, 2025, offers a potential catalytic event likely to further attract institutional buyers. Traders are exploiting the rising demand for AI-driven solutions, making near-term resistance and support levels critical for short-term opportunities.
The company’s leadership in data analytics and AI integration has positioned it as a pivotal contributor in both government and enterprise applications. Its ongoing investments in research, product offerings, and customer partnerships add to the bullish narrative, with many analysts suggesting transformational upside potential in the medium to long-term.
**Recent Performance:**
Palantir Technologies has seen a steady upward momentum in recent weeks. In response to market pullbacks earlier this year, the stock demonstrated resilience, largely driven by a combination of strong fundamentals and enthusiastic sentiment surrounding AI markets. The stock recently edged closer to its 52-week high, reflecting growing levels of institutional accumulation and alignment with Palantir's ambitious growth projections.
**Expert Analysis:**
Professional analysts remain overwhelmingly bullish on Palantir's stock, citing strong growth prospects in AI integration, robust government contract pipelines, and its near-indispensable role in defense applications. Institutional investors highlight the company’s ability to convert monetary investments into consistent performance, arguing its AI-driven platform raises barriers against potential competitors. Analysts observe a convincing technical setup, indicating sufficient momentum to breach resistance and establish new highs over the next quarter. Palantir’s strong customer relationships in government markets remain a testament to its credibility and expertise.
**News Impact:**
Palantir has benefitted from positive headlines, especially its increasing involvement with government defense initiatives and autonomous systems technologies. The company’s highly anticipated earnings announcement will likely shape the next major price move, with investor sentiment strongly skewed toward upside surprises. Additionally, market participants are closely watching Palantir's ability to secure long-term contracts, which have driven further confidence in its growth trajectory.
**Trading Recommendation:**
In light of Palantir’s current price action, institutional interest, and AI momentum, a long position is recommended. With clear price targets of $159.20 (T1) and $165.80 (T2), and risk managed via stop losses at $150.70 (S1) and $147.30 (S2), this trade setup aligns with both technical and fundamental insights. As the AI sector continues to expand and Palantir strengthens its dominance in government and commercial markets, the stock presents a tactical opportunity for traders seeking high-potential rewards.
PLTR moving higherPLTR expected to move higher.
The price is bouncing off the 20MA and respecting it.
Making new higher/highs and higher lows.
Earnings is due shortly, which could have a negative impact to the price.
However, the long term outlook for the company is still strong.
Anyone else have thoughts on this stock?

PLTR: 157.88Bullish Entries: 160.00/162.00 Stop 155.80 Target 164 – 165
Bearish Entries: 155.00/152.00 Stop 157.00 Target 152 – 150
Everything remains within the framework of probabilities, so have a good trading day.
PLTR WEEKLY TRADE IDEA (07/28/2025)
**🚀 PLTR WEEKLY TRADE IDEA (07/28/2025) 🚀**
**Momentum is 🔥 but Volume is the Missing Ingredient**
---
📈 **Momentum Snapshot:**
* **Daily RSI:** 71.9 ⬆️ (🚨 Overbought but still rising)
* **Weekly RSI:** 76.7 ⬆️ (📢 Clear Bullish Strength)
➡️ *Strong upside pressure, but entering the overbought zone*
📉 **Volume Insight:**
* Weekly Volume = **0.8x last week**
⚠️ *Weak institutional conviction during the breakout = yellow flag*
🔍 **Options Flow Check:**
* **Call/Put Ratio:** 1.09 = *Neutral*
➡️ Balanced flow = *no aggressive buying yet*
🌪️ **Volatility Environment:**
* **VIX = 15.4**
✅ Favorable for directional trades — low IV supports premium growth
---
📊 **Model Consensus Recap:**
✅ Bullish RSI momentum (unanimous)
✅ Volatility ideal for long calls
⚠️ Volume flagged as a concern by some models
📌 Final stance: **MODERATE BULLISH**
---
💥 **RECOMMENDED TRADE SETUP (Confidence: 65%)**
🎯 **Play:** Buy CALL Option
* **Strike:** \$167.50
* **Expiry:** Aug 1, 2025
* **Entry Price:** \~\$0.74
* **Profit Target:** \$1.48 (🟢 2x return)
* **Stop Loss:** \$0.37 (🔻-50%)
📆 **Entry Timing:** Market Open Monday
📦 **Size:** 1 Contract
---
⚠️ **Key Risks to Watch:**
* 📉 Weak volume = possible consolidation before next leg up
* ⏳ Premium decay risk into expiry
* 📊 No strong institutional footprint = stay nimble
---
📌 **JSON FORMAT TRADE DETAILS (Automation Ready):**
```json
{
"instrument": "PLTR",
"direction": "call",
"strike": 167.50,
"expiry": "2025-08-01",
"confidence": 0.65,
"profit_target": 1.48,
"stop_loss": 0.37,
"size": 1,
"entry_price": 0.74,
"entry_timing": "open",
"signal_publish_time": "2025-07-28 10:13:40 EDT"
}
```
---
🔥 TL;DR:
* Momentum is undeniable ✅
* Volume = suspect 🟡
* VIX = Green light for directional play ✅
💬 **\ NASDAQ:PLTR Bulls, are you ready or waiting for volume confirmation?**
\#PLTR #OptionsTrading #BullishSetup #UnusualOptions #MomentumPlay #TradingView #StockMarket

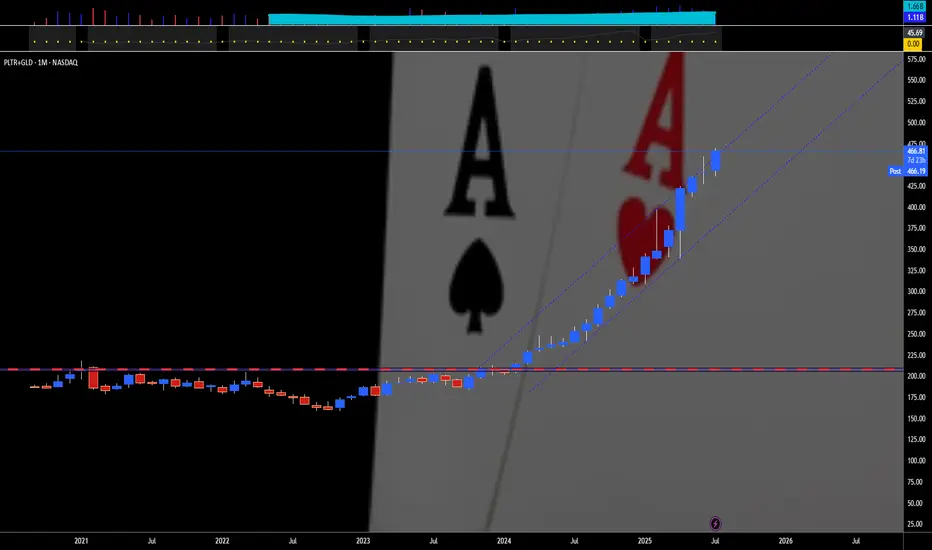
PALANTIR PLUS GOLD — TWO IS A PAIR"Two is a pair" means that the number two represents a set of two identical or closely related items that are used together or considered a unit. For example, a pair of socks, a pair of shoes, or a pair of gloves. It can also refer to two people, animals, or things that are grouped together.
Here's a more detailed breakdown:
Definition:
A pair is a set of two things that are alike, matched, or intended to be used together.
Examples:
"A pair of socks" - two socks designed to be worn on the feet.
"A pair of scissors" - two blades joined together.
"A pair of lovers" - two people romantically involved.
Singular/Plural:
The word "pair" can be singular or plural, depending on how it's used. For example: "This pair is comfortable" (singular) and "These two pairs are comfortable" (plural).
Relationship:
While "pair" often implies a strong connection or matching nature, it can also be used for things that are simply grouped together.
For example, like Palantir NASDAQ:PLTR & Gold AMEX:GLD that match each other, for 18 straight months in a row. 💖
--
Best wishes,
@PandorraResearch Team
PLTR WEEKLY OPTIONS TRADE IDEA – JULY 21, 2025
🔥 NASDAQ:PLTR WEEKLY OPTIONS TRADE IDEA – JULY 21, 2025 🔥
Bullish Momentum + Strong Options Flow = Prime Setup 📈
⸻
📊 TRADE SETUP
🎯 Instrument: NASDAQ:PLTR
📈 Direction: CALL (LONG)
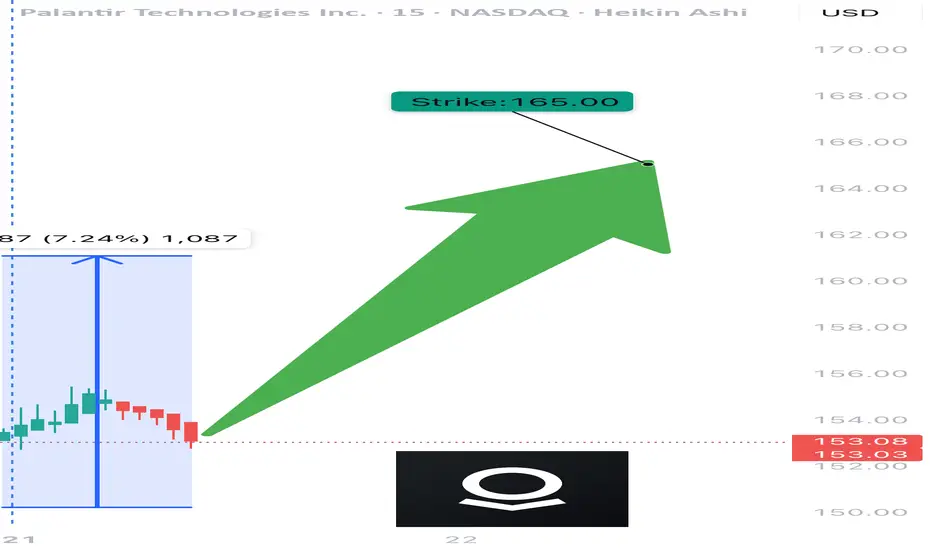
💵 Strike Price: $165.00
🟢 Entry Price: $0.59
🛑 Stop Loss: $0.30 (50% risk cap)
🎯 Profit Target: $1.18 (2x reward)
📅 Expiry: July 25, 2025 (Weekly)
📏 Size: 1 contract
💪 Confidence: 75%
⏰ Entry Timing: Market Open
⸻
📌 Why This Trade?
✅ RSI Strength: Daily RSI = 71.0 | Weekly RSI = 75.3 → Bullish continuation
✅ Weekly Range Positioning: Trading at 96.6% of weekly high
✅ Options Flow: Call/Put ratio = 1.47 — institutional bullish bias
✅ Strike Interest: Heavy OI @ $162.50 & $165.00 = strong magnet zones
🟡 VIX = 16.6 → Favorable volatility for short-term premium plays
⚠️ Volume is flat (1.0x) — no surge confirmation, so keep stops tight
⸻
🧠 Execution Plan
• Open position at the bell
• Mental stop at -50%, or ~$0.30
• Target 100% return = ~$1.18
• Exit ahead of Friday’s expiration unless the trade hits target early
⸻
💡 Key Levels to Watch
🔹 Resistance Zone: $155.68 – $156.59
🔹 Support Watch: Below $152 could break structure
🔹 Earnings Risk: Check calendar — volatility can spike unexpectedly
⸻
🏁 Verdict
• Momentum = 🔥
• Flow = 🚀
• Volume = 😐
➡️ Net Bias: MODERATE BULLISH — Risk-managed call with solid R:R
⸻
NASDAQ:PLTR Call @ $165 — Entry $0.59 → Risk $0.30 → Target $1.18 💥
Clean setup for disciplined bulls. Don’t overstay. Ride momentum. 🎯
⸻
#PLTR #OptionsTrading #WeeklyOptions #MomentumPlay #CallOptions #FlowTrade #TradingView #StockSignals #TradeSetup #RiskReward #SwingTrade #SmartMoneyFlow
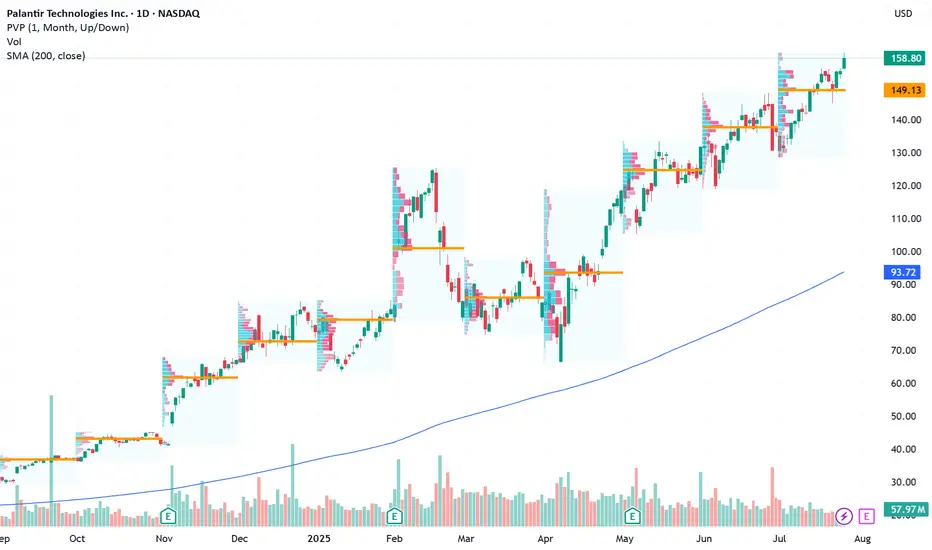
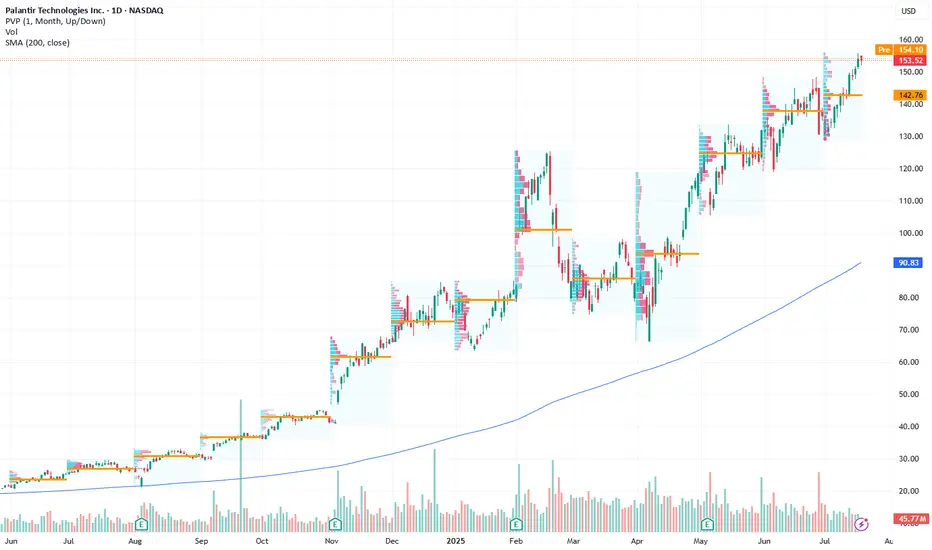
Palantir Is Up 600%+ Since August. What Do Its Charts Say?National-security software firm Palantir Technologies NASDAQ:PLTR hit a new all-time high this week and has gained more than 600% since hitting a 52-week low last August. What does technical and fundamental analysis say could happen next?
Let's look:
Palantir's Fundamental Analysis
PLTR has been on a tear of late, hitting a $153.91 intraday record high on Thursday. (Full disclosure: I own the stock.)
Shares have been rising in part because NATO member nations recently agreed to increase defense and defense-related infrastructure spending to 5% of each country's gross domestic product -- news that could play right into the company's hands.
Only Spain opted out from among the 32 Western nations that belong to the military alliance, although Canada went along only somewhat reluctantly.
The move surprised many NATO observers. Just some eight years ago, President Trump couldn't get a majority of these nations during his first term to pay what he called their "fair share" -- which was then mandated at only 2% of GDP.
But having a hostile Russian Army in Ukraine knocking at NATO's front door has changed global perceptions of what's fiscally necessary and what's not. Spain and Canada are far away from the Russia-Ukraine war, but some NATO members physically closer to the fighting have far more enthusiastically embraced the new 5% spending target.
What becomes of these promises to boost military spending?
There will, no doubt, still be costly purchases of expensive military hardware like tanks, artillery, aircraft and naval vessels. But intelligence provided by the kind of data-based, AI-assisted analysis that Palantir sells seems likely to only grow in significance.
Purchasing such intelligence (or the high-tech, modern systems to gather it) looks to be far more cost-effective than simply throwing money at things like submarines and fighter aircraft.
That's what nations need these days for national security, as well as what many large businesses need just to compete. All of that sounds like music to Palantir's ears.
The company will report Q2 earnings after the closing bell on Aug. 4, with analysts looking for the firm to post $0.14 in adjusted earnings per share on $939.3 million of revenue.
That would represent a 55.6% increase from the $0.09 in adjusted EPS and 38.5% improvement on the $678.1 million in revenues that PLTR reported for the same period last year.
Of the 19 sell-side analysts I found that cover Palantir, 12 have revised their earnings estimates higher since the current quarter began, while three have lowered their forecasts.
Palantir's Technical Analysis
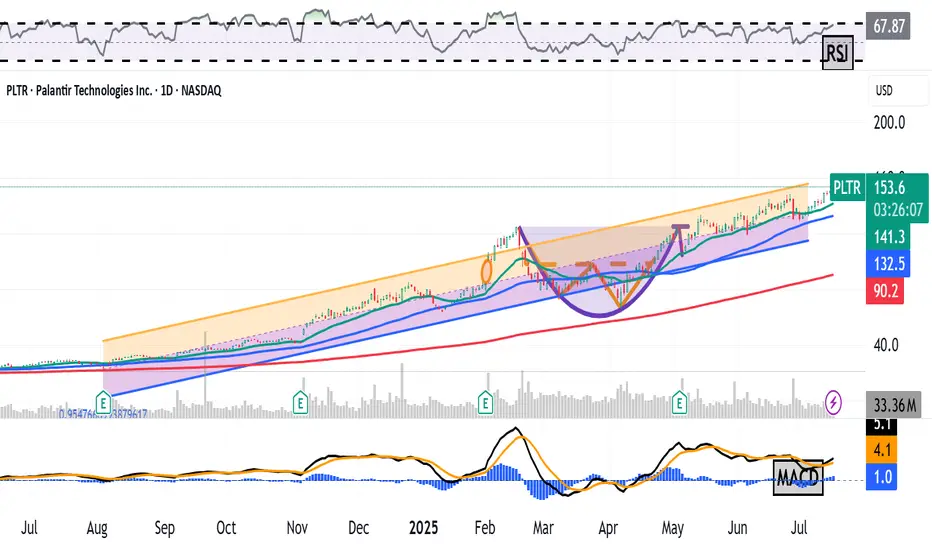
Now let's take a look at PLTR's charts, beginning with this one that runs from January through Tuesday afternoon:
Readers will first note that Palantir continues to break out from the bullish "cup-with-handle" pattern that became visible this spring (shaded purple in the chart above).
The stock's Relative Strength Index (the gray line at the chart's top) also remains quite robust, but is not yet technically overbought.
Similarly, Palantir's daily Moving Average Convergence Divergence indicator (or "MACD," marked with gold and black lines and blue bars at the chart's bottom) is postured bullishly as well.
Within that MACD, the histogram of the stock's 9-day Exponential Moving Average (or "EMA," denoted with blue bars) is above zero. That's often seen technically as short-term bullish.
Meanwhile, Palantir's 12-day EMA (the black line) is back above its 26-day EMA (the gold line), with both in positive territory. That's also a historically bullish signal.
Now let's look at PLTR's chart going back 12 months:
Taking a longer look back, we can take a Raff Regression model (the orange and purple field above) and place it over the stock's price action to better illustrate the trend that's in place.
This view shows PLTR riding its 21-day EMA (the green line above) since mid-April.
Palantir's current pivot is the upper trendline of the model -- about $156 in the chart above vs. the $153.43 that PLTR was trading at on Thursday afternoon.
The stock's 50-day SMA (the blue line at $131.40 in the chart above) represents PLTR's downside pivot, with the Raff Regression model's lower trendline not too far below that for potential support.
(Moomoo Technologies Inc. Markets Commentator Stephen “Sarge” Guilfoyle was long PLTR at the time of writing this column.)
This article discusses technical analysis, other approaches, including fundamental analysis, may offer very different views. The examples provided are for illustrative purposes only and are not intended to be reflective of the results you can expect to achieve. Specific security charts used are for illustrative purposes only and are not a recommendation, offer to sell, or a solicitation of an offer to buy any security. Past investment performance does not indicate or guarantee future success. Returns will vary, and all investments carry risks, including loss of principal. This content is also not a research report and is not intended to serve as the basis for any investment decision. The information contained in this article does not purport to be a complete description of the securities, markets, or developments referred to in this material. Moomoo and its affiliates make no representation or warranty as to the article's adequacy, completeness, accuracy or timeliness for any particular purpose of the above content. Furthermore, there is no guarantee that any statements, estimates, price targets, opinions or forecasts provided herein will prove to be correct.
Moomoo is a financial information and trading app offered by Moomoo Technologies Inc. In the U.S., investment products and services on Moomoo are offered by Moomoo Financial Inc., Member FINRA/SIPC.
TradingView is an independent third party not affiliated with Moomoo Financial Inc., Moomoo Technologies Inc., or its affiliates. Moomoo Financial Inc. and its affiliates do not endorse, represent or warrant the completeness and accuracy of the data and information available on the TradingView platform and are not responsible for any services provided by the third-party platform.