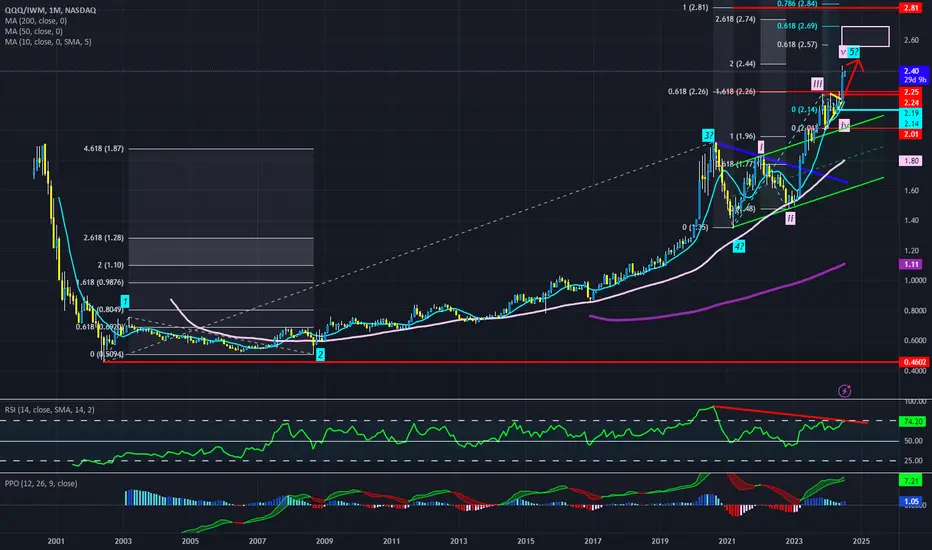
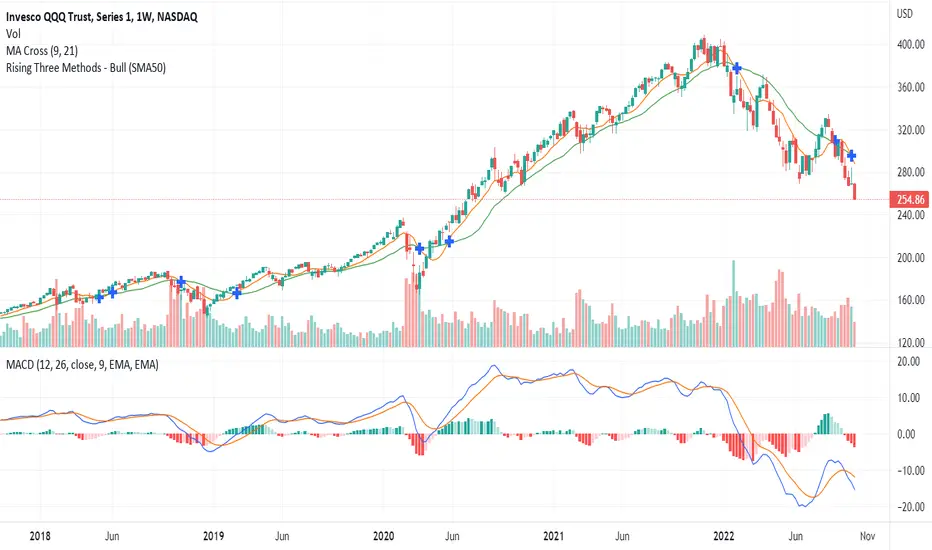
Small caps will likely outperform NDX in coming years 2025-2028I have chastised small cap analysts and FURUs over many years for their propensity to lure investors into smaller names vs large cap tech because the overall market is bullish and higher beta smaller stocks should outperform.
They haven't. As my chart clearly shows it's been one way traffic for the last 22 years since the lows following the bursting of the dotcom bubble.
BUT.
I can see some light at the end of the tunnel for small caps - maybe not until later this year or in 2025 (or maybe once the FED criminals start to cut rates). Interestingly the last time small caps outperformed tech was in the 2000-2003 bear market era. So If my analysis is anywhere near correct then what may be good news for small caps (on a relative basis) may not be great for the wider market.
Caveat emptor.
QQQ trade ideas

QQQ Short IdeaQQQ recently broke below a small bear flag and now it is nearing a retest. I'll look for puts if it hits. Will need to have a tight stop due to the conditions. Holiday week and TNX is rocketing so kind of scary. However, VX is making new all time lows today so we have some conflicting signals.

Market Update - 6/30/2024In short:
• breadth is improving
• small caps are leading
• lots of setups and the numer increased from the last weeks
• the list of breakouts is expanding each week - there is follow through coming in
• supportive economic data this week

Overall bullish, expecting over $500 in 2 monthsThis video is for level considerations. Trades based on these levels are contingent upon your risk tolerance. If it gaps up on Monday I'm bullish on any pullback but that's considering the prior high of the day was surpassed otherwise I'll be positioned as a bear until the gap fills. I'm open to conversation and feedback. Let me know what you think. :)

QQQ : Heading into smaller correction territoryQQQ : Heading into smaller correction territory
$470-$480 ( lower 470 ) - 1st week
$460-$470 ( lower 470 ) - 2nd week
$450-$460 ( lower 470 ) - 3rd week
$440-$450 ( lower 470 ) - 4th week
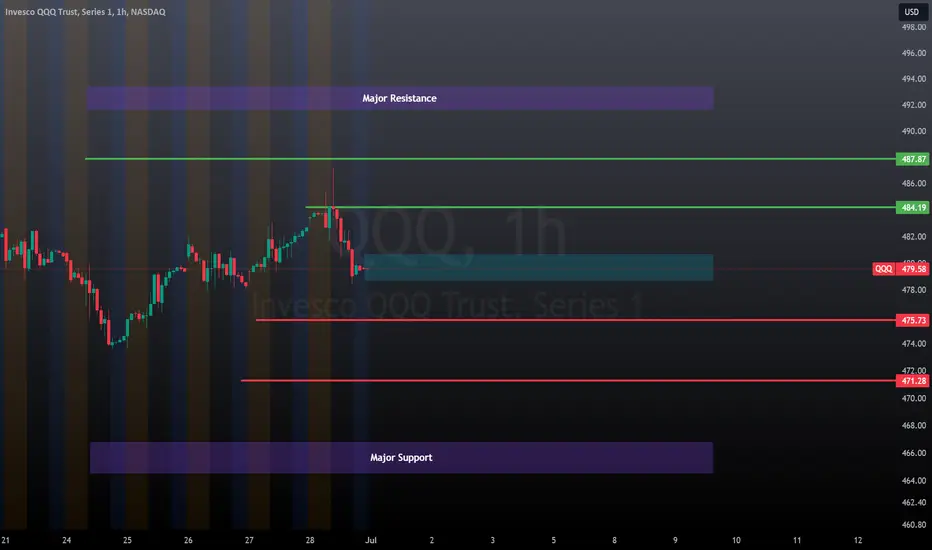
QQQ: First week of JulyLooking at this, looks like we could see a continuation of pullback. No huge amounts of short interest for next week after the squeeze we saw this week, so that generally is when the market decides to actually pullback.
Levels to watch are in the chart.
Most likely high is 484 and most likely low is 475.
Purple boxes represent max high and low ranges.
Bias remains overall to the upside in the long term but caution is merited into next week of a continuation of pullback.
QQQ - Trade Update - Biden Wins Debate According to the ExpertsLOL as I mentioned the other day, if Biden wins the debate the market will pullback, if Trump wins, expect a fake rally and then a pullback. So with probably the worst showing of any presidential candidate in any debate, we got our fake rally and now it is time for the pullback.
Here I am looking at the daily chart and the pinbar forming is telling that there simply are no buyers at these levels. Sellers have control of the market above 485.
Now though we are a little in the red on our trade, I am not at all worried here.
1) We have a stop level to minimize losses.
2) The market is at a level where a 5-10% pullback is likely. (better than 50%)
3) Biden was so bad, it is throwing even more uncertainty into the markets.
So as I posted:
I am short 100 QQQ's outright (I may add to that position) and I am just holding here, not worried about the little bounce out of the gate this morning.
I am also:
short one 28JUN 476 C As it stands I am down $85 in this trade
short one 28JUN 480 C As it stands I am up $82 in this trade
So what do I do with these?
Well it is getting close to the close so I can do one of the following:
1) Roll it out another week
2) close them out
3) Take assignment of the contract (which would be acquiring a short position of 100 shares per contract)
There are some other strategies I could employ but these are the basic ones.
If I roll out the 476 Call I am only going to collect another 36 cents on this contract so I am going to let the contract be assigned and I may near the close sell a PUT for next week against this short. I may also just keep the position.
If I roll out the 480 I will collect another $1. That may be worth it and I will likely roll this out if it is still slightly ITM.
I will update around 3:45
So that is my strategy here, Unlike many guys throwing out signals, these are real trades I take in my real account. Not like those "fake gurus" who need mom to sign for the lease on their car and don't even have a trading account more than $5k.
Have a blessed weekend and good luck trading. Will update BTC also.

Nasdaq is gonna crash in the next two weeks! SAME PATTERN!CAUTION: AWESOME OPTIONS PLAYS AT THE END OF THE POST! NFA ;-)
Look at this weekly chart and don't tell me that this is a repeating fractal!? The same color trend lines are almost the same length to a T. The upper trend line channels are gonna be the same distance, which extrapolates this going south for a very long time. (check out my AMEX:SILJ thread to show the repeating fractal line up)
Now of course these lines aren't gonna be what happens, you can see there was some out of the ordinary channel reactions on the downtrend last time.
I personally think that Biden is gonna mess up the debate, then pardon his son and leave the presidency while Kamala will tap Hillary Clinton as VP (via Ford Agnew redux) and then pardon Biden for any crimes done in office or out of office.
The markets will melt down, the FED will cut rates, maybe by 250 basis points since they keep going larger with their reactions to contain the ponzi scheme.
I'd buy puts right now, 400 December Puts for 4.10, sell them for 5x for a nice Christmas/New Year's present.
OR you can go the supersize route and buy puts on TQQQ for 42$ for the $25 strike price (it'll go lower imo) for a 25x return, if the price goes down to $15, that's around a 4200% return!! NFA ;-)
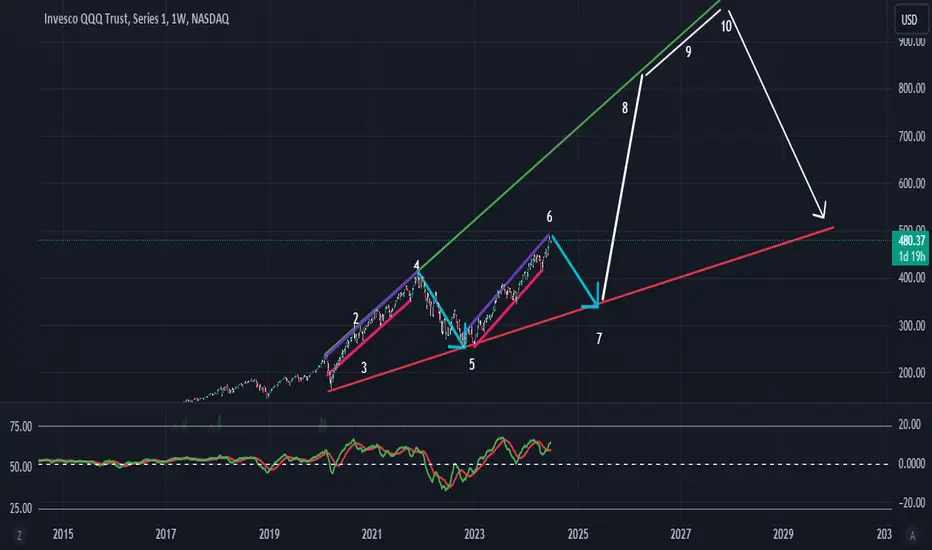
Also this shows the road forward, via a Livermore Accumulation Pattern. So we go very UP for the long term.
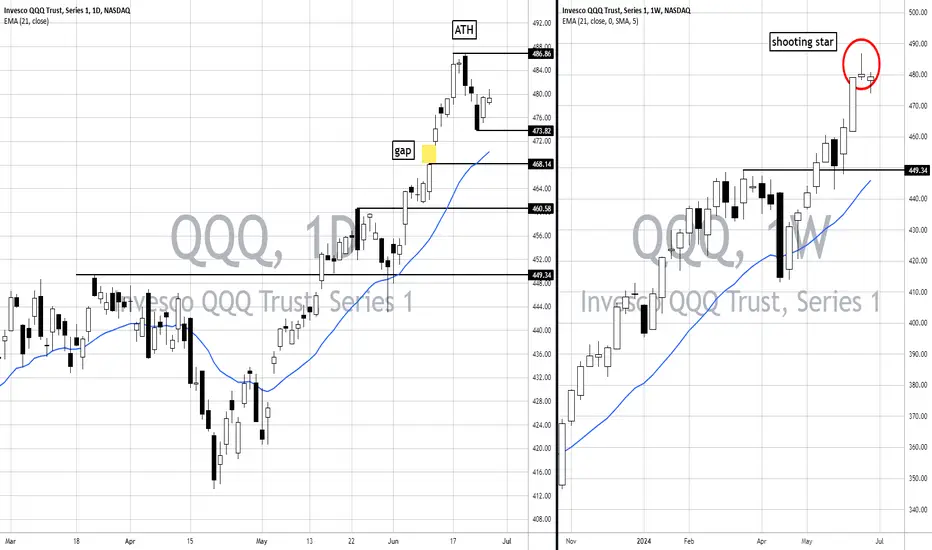
QQQ: Key Levels and Potential Scenarios (D&W charts).Daily Chart:
On the daily chart, QQQ has recently hit an all-time high of 486.86, marking a significant resistance level. This milestone suggests a bullish momentum, but it's essential to watch how the price behaves around this level.
There's also a noticeable gap at 468.14, which often acts as a magnet for price action, serving either as support or resistance. Currently, the price is hovering around the 473.82 support level, which, if maintained, could signal continued bullish momentum.
Additionally, the 21-day EMA is another critical support level; staying above it would further validate the uptrend. Should the price break above the all-time high, we could see new peaks. Conversely, losing support at 473.82 might lead to a sharper pullback, potentially down to 460.58 or even 449.34.
Weekly Chart:
Looking at the weekly chart, a shooting star pattern has emerged, typically a bearish signal suggesting a potential reversal. This pattern indicates that despite reaching new highs, there was significant selling pressure, hinting at a possible decline.
The 21-week EMA, however, shows that the longer-term trend remains bullish as the price is still well above this level. If the price confirms the shooting star by dropping in the following weeks, it might signal a deeper correction.
Maintaining above the 21-week EMA would still suggest a strong underlying bullish trend, despite short-term bearish signals.
Conclusion:
In conclusion, while the QQQ shows strong bullish signals, indicated by new all-time highs and support levels on the daily chart, the shooting star pattern on the weekly chart warrants caution.
If the price holds above 473.82 and the 21-day EMA, the bullish trend is likely to continue with potential for new highs. However, if these supports fail, we might see a correction down to the gap at 468.14 or lower. Overall, monitoring these key levels will be crucial in determining whether the QQQ continues its upward trajectory or enters a period of correction.
For more detailed technical analyses and insights like this, be sure to follow my account. Your support helps me continue providing valuable content to help you make informed trading decisions.
Remember, real trading is reactive, not predictive, so let's stay focused on the key points described above and only trade when there is confirmation.
“To anticipate the market is to gamble. To be patient and react only when the market gives the signal is to speculate.” — Jesse Lauriston Livermore
All the best,
Nathan.
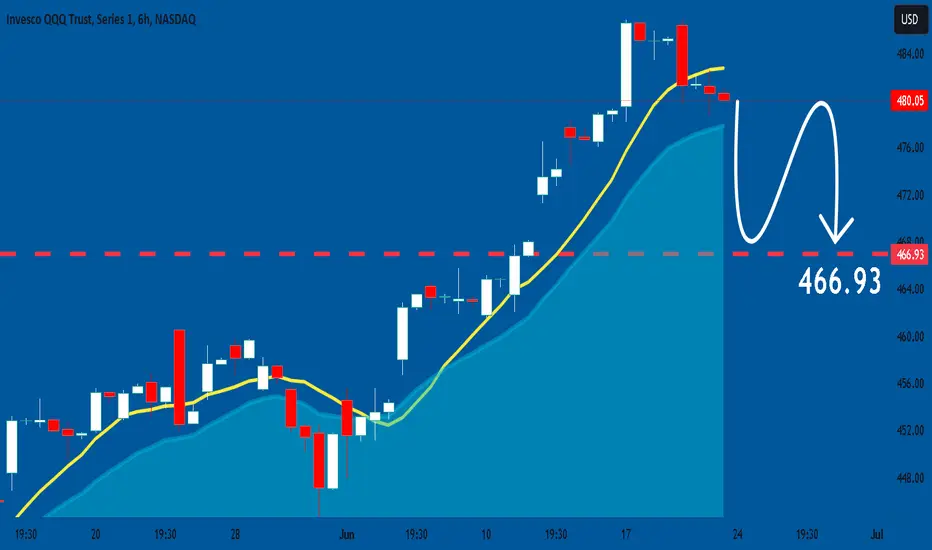
QQQ What Next? SELL!
My dear subscribers,
This is my opinion on the QQQ next move:
The instrument tests an important psychological level 480.05
Bias - Bearish
Technical Indicators: Supper Trend gives a precise Bearish signal, while Pivot Point HL predicts price changes and potential reversals in the market.
Target - 463.65
My Stop Loss - 489.72
About Used Indicators:
On the subsequent day, trading above the pivot point is thought to indicate ongoing bullish sentiment, while trading below the pivot point indicates bearish sentiment.
———————————
WISH YOU ALL LUCK

QQQ Blow Out Indicates Closer to bottom I have been waiting for the blow out at the bottom and this has some of those markings but it will take severals days to be sure.
QQQ - Trade Ideas - Market OverboughtI see so many posting trades using an hour or 30 minute candles, counting waves like it is meaningful. It is not, it is simply amateur at best unless you are day trading. For swing trades I like I always start with the weekly candles. It paints a broader picture, not just some inner day noise that randomly prints patterns.
So I have been watching this market for a couple months now, continue to grind higher and higher and higher, BUT we have some uncertainty coming up, and also we printed a potential short pattern on a weekly time frame.
Like most things in life, other than war and being sick, longer is better!!! ;).
This is a trade I like here and will take myself next week as I like buying over sold markets, and selling over bought. Now yes.... there is the old adage "don't short into a bull market", but that is more of a newb type of thing and not something I pay much attention to. Yes the market can stay overbought longer than shorts can stay liquid, but that is why we have a stop!!!
Bearish pinbar into an extended market and looking for a potential 10% or greater pullback in the near term.
I posted two trade ideas, one is a swing trade for you traders out there that like action. Short and sweet, look for 1-3 weeks to play out.
The other is a Position trade, and the one I will be taking. Notice the stop is moved higher, and the targets are much lower. It also has a greater Reward : Risk to it. Over the years I have given up being Action Jackson and I have had a lot of gains over the past year and I want to hedge them so this is one way to do that.
No I am not selling NVDA though it has become quite a huge position in my portfolio. At least not yet, the market is still bull!!!
So before I get the comment "if you think it is still bull, why are you shorting here?"
1) Over bought conditions (slightly not a hyper excited market)
2) After large runs 10% pullbacks are quite common
3) Election year and the debate is next week - creating a little uncertainty on how it may come out.
4) Biden moving up in the polls, market is hesitating. I read the tea leaves, so I don't care what you think of Biden or Trump. The fact Trump met with business leaders, when 4 years ago they wouldn't give him the time of day. Even silicon valley and the NY bankers are warming up to Trump. So if Biden wins, expect the market to pullback, Trump wins, may get another rally.
5) Bearish Pinbar on the weekly
6) The fact "Elliott Wave Masters" are bullish still on their 30 min chart not realizing this could be a B leg of a corrective sequence, since it has not closed above the 0.618 extension.
7) Because I made a lot of money over the last year and I want to hedge!!!
8) Straight up I've been doing this longer than you, or most of you anyways.
Feel free to comment and if you don't know how to calculate risk, ask someone, don't just short blindly. Yes you can also sell calls or buy puts, I will post that trade over the weekend.

QQQ - Options Idea - Selling OptionsSo I am looking to get short the QQQ over the next week or so and one of the ways I like to get short is selling Calls. Now a couple ground rules to go by.
1) Do not sell calls on individual stocks UNLESS you own the stock and it is a covered call. You can get destroyed quickly.
2) Do not sell puts UNLESS you are able to have the contract assigned to you. (this is not applicable to this trade, more if you want to go long a stock, but I am going over general rules overall)
3) Do not get TOOO BIG you can lose your ass quickly.
Selling options is the slow boat to China trade so don't get greedy. Small wins = Big gains.
In lieu of just shorting the market, or in conjunction, if you have that kind of account, selling Calls is a great way to get a little extra premium for shorting.
Now what is the risk here? Well it is a little more risky than shorting outright simply because there is no pre or post market. But overall selling one contract is equal risk to selling 100 shares, to provide some proportion.
What I am going to do on Monday is a mix, of shorting the stock and selling a couple calls. I want to be clear here, I give the market 30-45 min after the open to see if I want to sell a Call based on how the market reacts. Patience may provide a better entry price, also the spreads are a little wider at the open and I generally like to wait for the market to stabilize after the open.
So I am looking at selling 480 Calls in addition to shorting the stock per my previous trade post.
Be patient, and if you have never shorted or sold calls, nothing wrong with doing a paper trade to get the idea of what you are doing. Obviously I will not be sending out real time signals, but I will post Monday my entry and trades.
Have a blessed Weekend!!!!

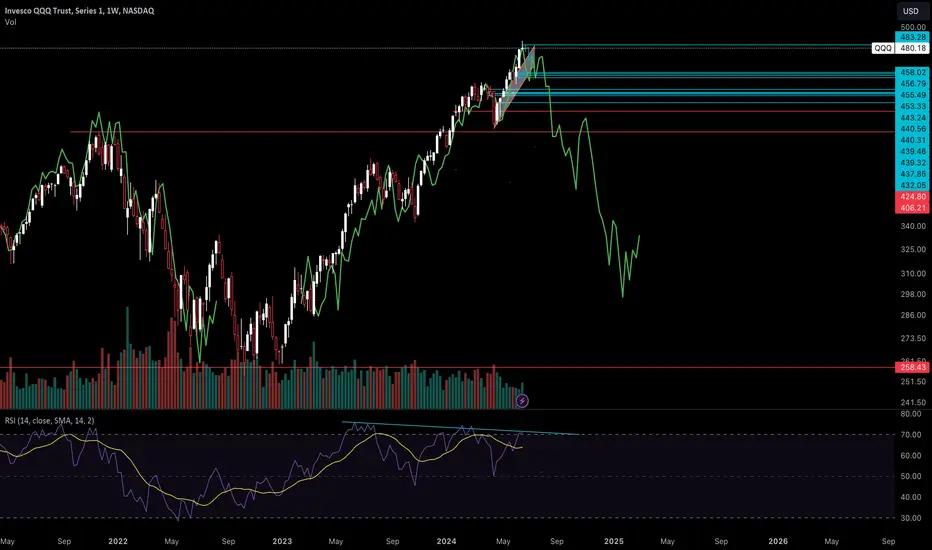
QQQ SPY BTC Markets Topped This WeekLooking at this weekly chart, although we didnt close RED, we closed as an inverted hammer on the weekly. The weekly timeframe is important to look at. Because its a high timeframe chart, the candles help you understand where the trend is going much more accurately then low time frames like the hourly chart.
Now an inverted hammer isnt THE reason I believed we topped. But it is the price action that triggered me going short over the weekend.
I have been preparing for a top in the market, specifically the Qs since we got close to ATHs.
Why?
If you take a look at DXY, it looks like its about to go parabolic(ill add a chart later). Unemployment rate looks to have bottomed. BTC, Gold, and NVDA look to have topped as well.
An interesting stat i read, 76% of stocks have been in a bear market this whole rally up.
NVDA has held up the entire tech sector almost by itself, along w the other Top 7.
NVDA and APPL both had a huge spike last week which got quickly sold off. Seems to me like it gave that final upthrust after distribution. Which is normally that final move that takes out most short sellers liquidity before actually making that impulse move down.
A lot of people are saying to buy the dip, but Ive seen this before. This will be the dip that doesnt stop dipping.
VIX is very low but looking to be bottoming. TLT is also looking strong.
I will upload a few more charts so you can better understand my view.
Lastly, the green pattern is simply the price action leading up to the last top in the market. And it looks like it has high potential to play out as such. The RSI is also looking to be playing out a major bearish divergence.
Will update in the coming days weeks and months.
Good luck everyone.
QQQ Thursday Gap Up ReversalShort-term & small sample, but an interesting pattern nonetheless...
If we look back at similar events to Thursday's action, they've all been short-term tops in the market. We're looking at: (1) Gap up open on a Thursday; (2) Bearish reversal closing near the lows of the day; (3) Increased Volume from the prior day(s); (4) Preceded by a good run in the market.
I think it's worth noting, although I'm not sure the market dynamic behind it, that these recent short-term tops have all occurred on a Thursday. So seeing similar-type action this past Thursday is sending up a short-term cautionary signal, especially after such a strong runup over the last few weeks. I want to emphasize 'short-term' though, because the long-term trend is still very much in tact. It may also be worth noting the lack of breadth under the hood as an additional short-term cautionary sign, although there are certain areas and groups that have been participating... it's been very much a stock picker's type of environment.

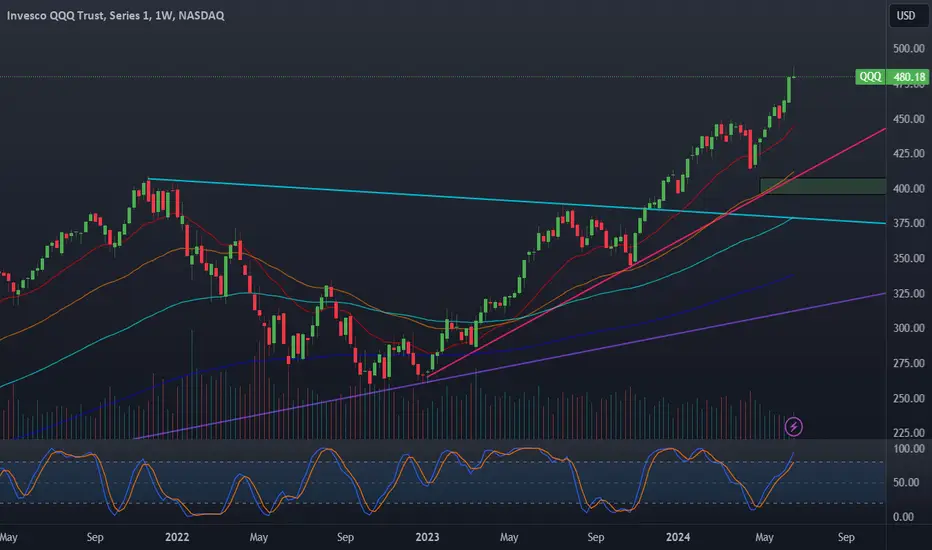
qqq sell!! STILL OVERBOUGHT!Party like it's 1999! Definitely cannot call a top or bottom but we can spot foolishness and bubbles. QQQ needs a correction even to maintain the uptrend
Targets $470.71, $459.94, $451.23 and possibly $442.52

QQQ about to correctWith NVDA finally losing steam, META looking the same, and TSLA looking weak as well I expect a correction here. This index has outperformed for a while. I look to 450-460$ in the coming weeks. By this occurs a test of the 20 EMA on the weekly will be around 450$. I look for a stochastic RSI that is starting to flatten here. Volume has slowly been falling over the year as well. That hammer hammer candle is bearish. Remember, my last few charts have been weekly timeframes, this will take a while to play out.
QQQ In correction territory As we can see QQQ made a double top on June 20th with that day making a bearish engulfing candle followed by a spinning top, all while the RSI is signaling over bought conditions.
In addition, the average volume since April has been dropping as the price has been rising, creating bearish divergence.
Finally, the price is well above the 1 year POC line ($369), the point where the most shares have traded over the last year.
Given the big run and the overbought conditions it appears that QQQ is ready for a correction. Based on the Elliot Wave forecast and the Fibonacci ratios a pullback to a range between $413-$432 (11-15% drop) is very likely, especially with Summer tending to be the weakest part of the seasonal trend as traders take vacations and people "Sell in May and go away."

QQQ: Market of Sellers
It is essential that we apply multitimeframe technical analysis and there is no better example of why that is the case than the current QQQ chart which, if analyzed properly, clearly points in the downward direction.
❤️ Please, support our work with like & comment! ❤️
QQQ Q2 2024QQQ ETF Q2 2024 view with RSI and 200, 100, 50, 20 VWMA indicators.
SPY
GOOGL
NVDA
AMZN
AAPL
MSFT
TSLA
META

Triple witching on FridayTriple witching, also known as quadruple witching, is a financial market event that occurs on the third Friday of March, June, September, and December each year. In 2024, the dates are: March 15, June 21, September 20, and December 20. The simultaneous expiration of stock-index futures, options on stock-index futures, single-stock options and index options can generate significant volatility and volume. However, the E-Mini S&P 500 (ES1!), E-Mini Nasdaq-100 (NQ1!), Dow Jones Industrial Average (YM1!) and Russell 2000 (RTY1!) futures contract switch was last week.
Here's a 1 week chart of SPY and QQQ. This support and resistance trend channel is based on the trajectory so far since the October 2022 low till last weeks high. *if this trend trajectory continues until the end of the year, then SPY range is 550- 590 and QQQ range is 500 - 550 by 1/1/25. However, the red resistance line is a short area and green support line is a long area along the way. *if the trend changes you will know based upon this trend channel.
Don't forget the Markets are closed on Wednesday for the Juneteenth national holiday.

QQQ journal for price at $484I have had the number 84 a ton back in March and April when I though there may be a dump to 384. However, once we broke my upside levels, I had to reassess wth 84 is and realized quickly it was 484.
So this is just for my journal to see what happens once we hit. It's only $3 away. I have negative energy atm and think we may retrace into Friday, but on monthly time frames still go up.
