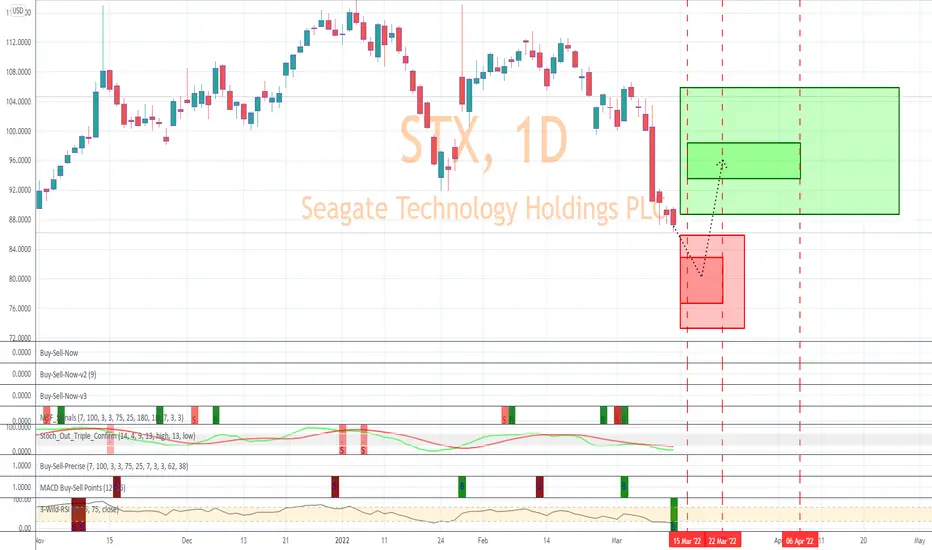
STX Set For A Quick Jump Next Week?Based on historical movement, the trough could occur anywhere in the larger red box. The final targets are in the green boxes. The pending top should occur within the larger green box as has been the historical case. Half of all movement has ended in the smaller green box. In this instance, the signal indicated BUY on March 11, 2022 with a closing price of 87.33.
If this instance is successful, that means the stock should rise to at least 88.71 which is the bottom of the larger green box. Three-quarters of all successful signals have the stock rise 7.129% from the signal closing price. This percentage is the bottom of the smaller green box. Half of all successful signals have the stock rise 9.993% which is the end point of the black dotted arrow. One-quarter of all successful signals have the stock rise 12.625% from the signal closing price which is the top of the smaller green box. The maximum rise on record would see a move to the top of the larger green box. These are the same concepts for the levels in the red boxes as well.
The ends/vertical sides of the boxes are determined in a similar fashion. The peak of the rise can occur as soon as the next trading bar after signal close, while the max rise occurs within the limit of study at 35 trading bars after the signal. A 1% rise must occur over the next 35 trading bars in order to be considered a success. Three-quarters of successful movement occur after at least 2 trading bars; half occur within 7 trading bars, and one-quarter require at least 18 trading bars.
The black dotted arrow represents median historical movement. Medians are a good metric, but they are just one of many I use when forecasting future movement.
As always, the stock could decline the very next bar after the signal without looking back (therefore the red boxes would not come into play) or the stock may never decline (and the green boxes may never come into play).
STX trade ideas

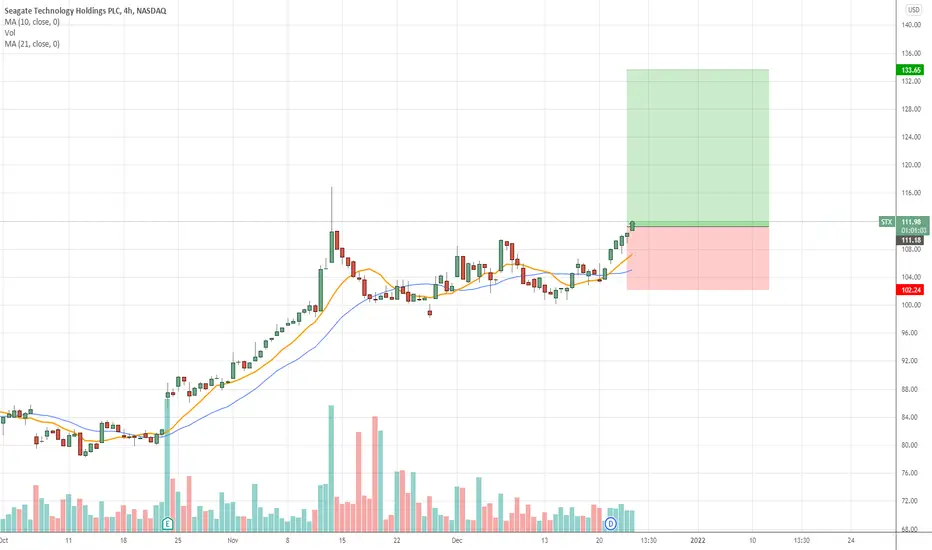
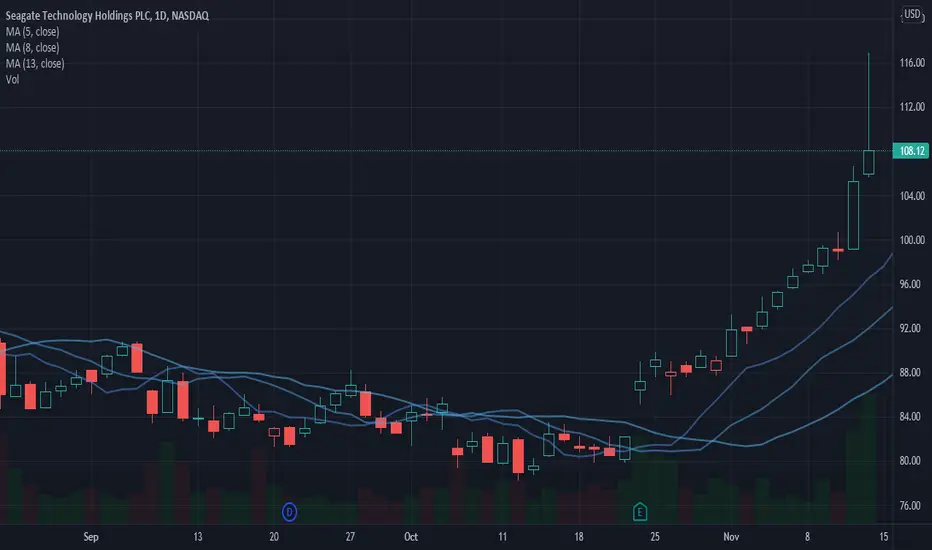
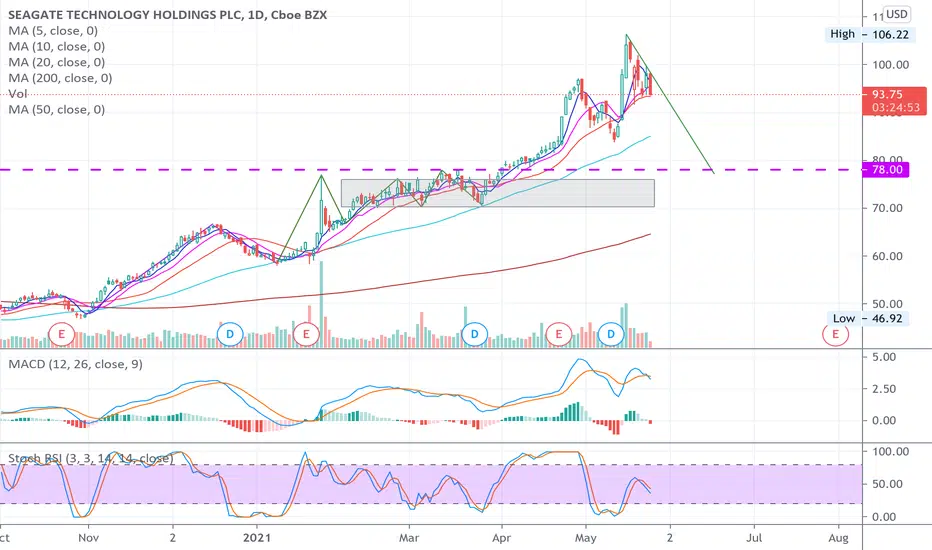
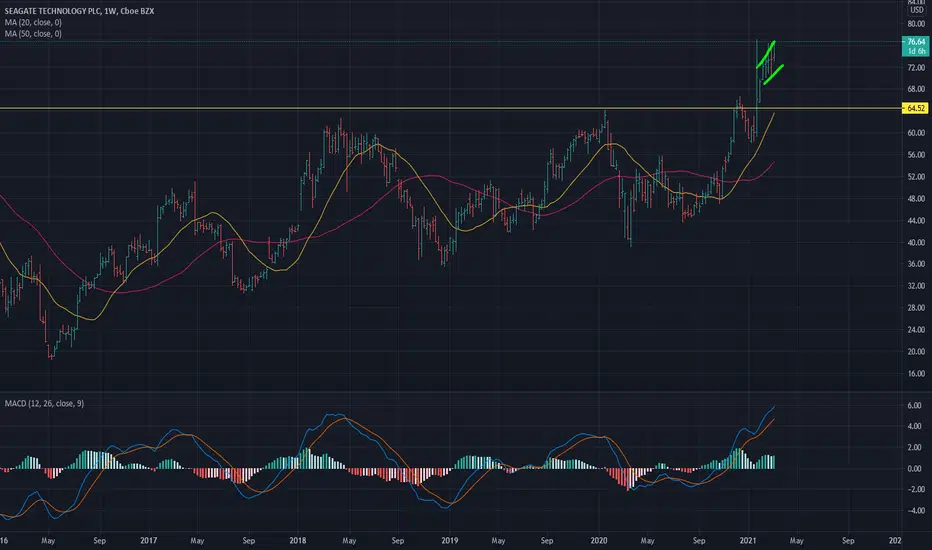
Bullish moveBase and Break of 25 week cup formation
stops 5-7%
Target 20%
Not financial Advice please use proper risk management
$STX / Long$STX showing VCP characteristics and tightness to the right of the base. Some OHS to contend with so on the WL for now.
$HBP / Long$HBP showing VCP characteristics. Isn't as tight as I'd like but it's printed a new 10 Week RS high before price and there's demand in the base.
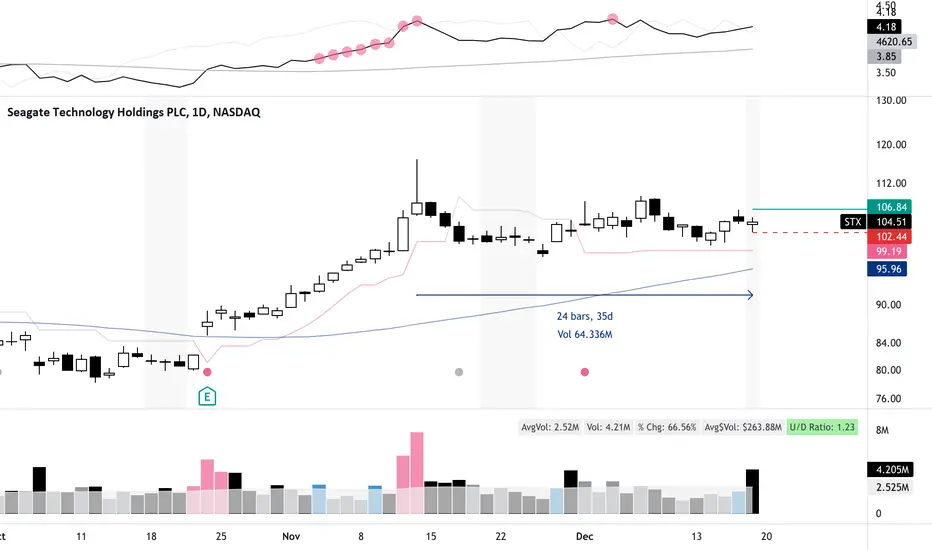
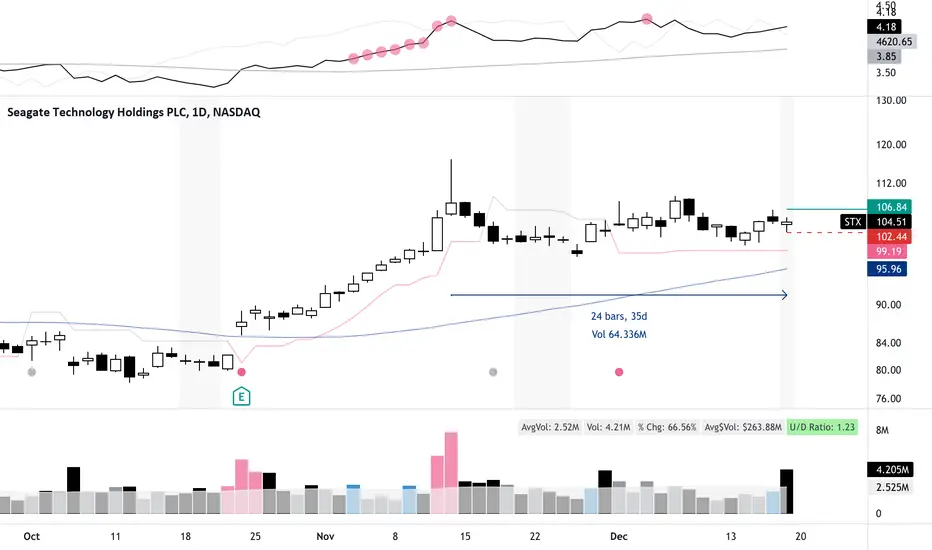
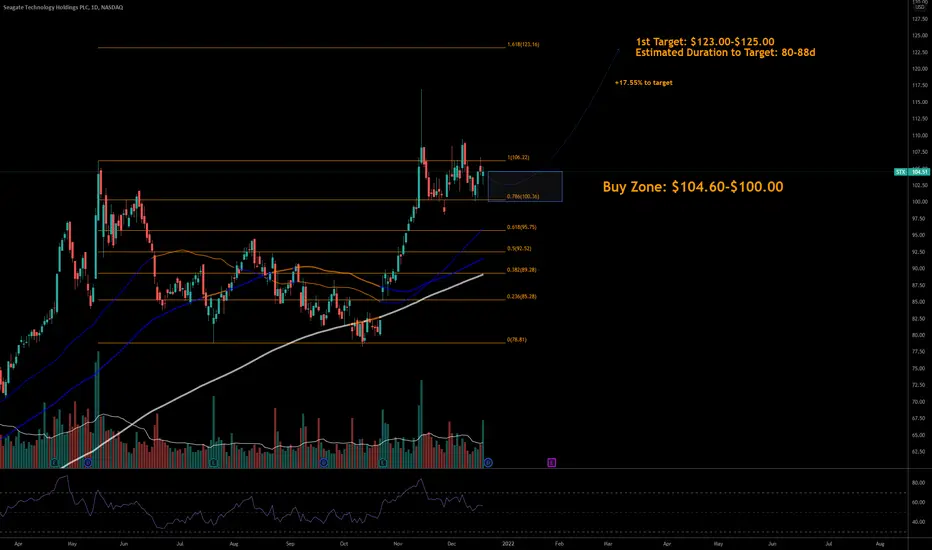
12/19/21 STXSeagate Technology Holdings PLC ( NASDAQ:STX )
Sector: Electronic Technology (Computer Peripherals)
Market Capitalization: 23.268B
Current Price: $104.51
Breakout price: $106.80
Buy Zone (Top/Bottom Range): $104.60-$100.00
Price Target: $123.00-$125.00
Estimated Duration to Target: 80-88d
Contract of Interest: $STX 3/18/22 105c
Trade price as of publish date: $8.15/contract
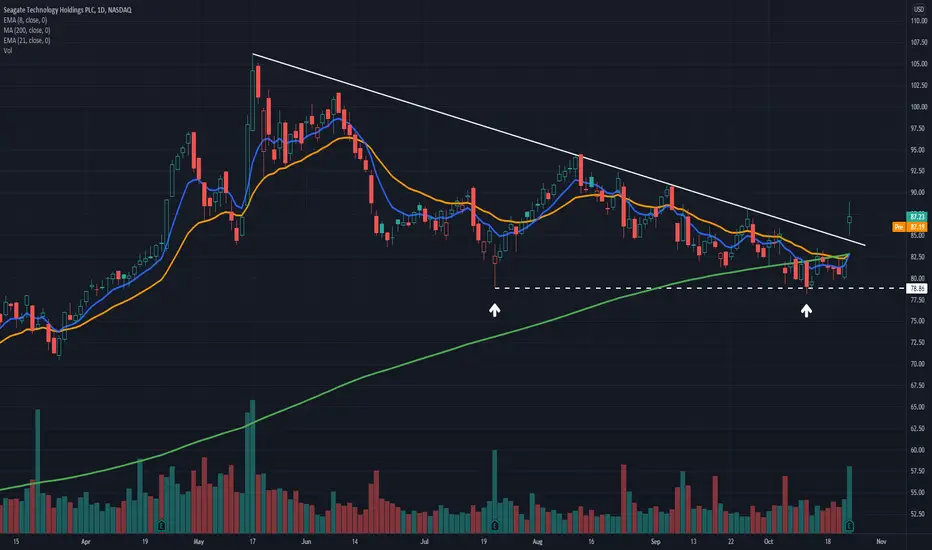
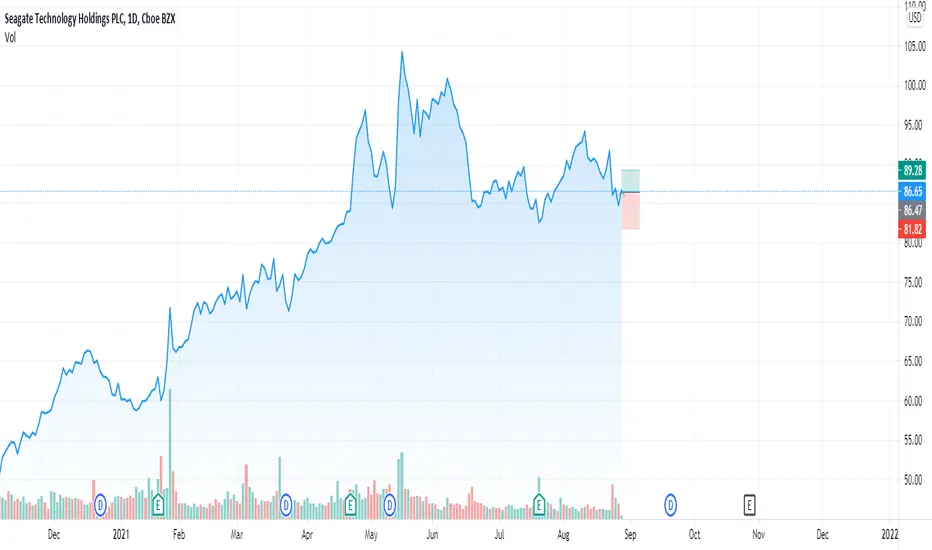
Seagate Breaks the DowntrendSeagate Technology has spent the last five months pulling back. But now it may be turning around.
The main pattern on today’s chart is the descending trendline that started in May and ran along the peaks of August and September. Notice how STX closed above that line on Friday.
Next, the jump followed two weeks of consolidation along the 200-day simple moving average (SMA). A bounce at that level may suggest its longer-term uptrend remains intact. It also occurred near the July 21 low at $78.86.
Third, consider why STX jumped last week: strong quarterly results and guidance. The hard-drive maker is enjoying a surge of demand from data-center customers. Its relatively low multiple (about 10 times forward earnings) could also provide some cushion against rising interest rates.
Finally, notice how the 8-day exponential moving average (EMA) is on the verge of rising above the 21-day EMA. STX may pause around its current level, but a cross of the 8-day EMA above the 21-day could signal shorter-term momentum has grown more positive.
TradeStation is a pioneer in the trading industry, providing access to stocks, options, futures and cryptocurrencies. See our Overview for more.
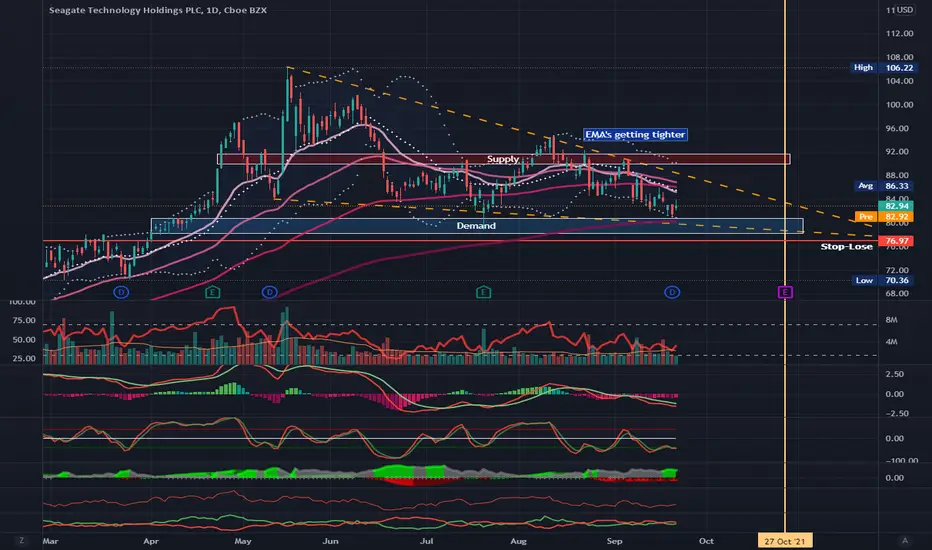
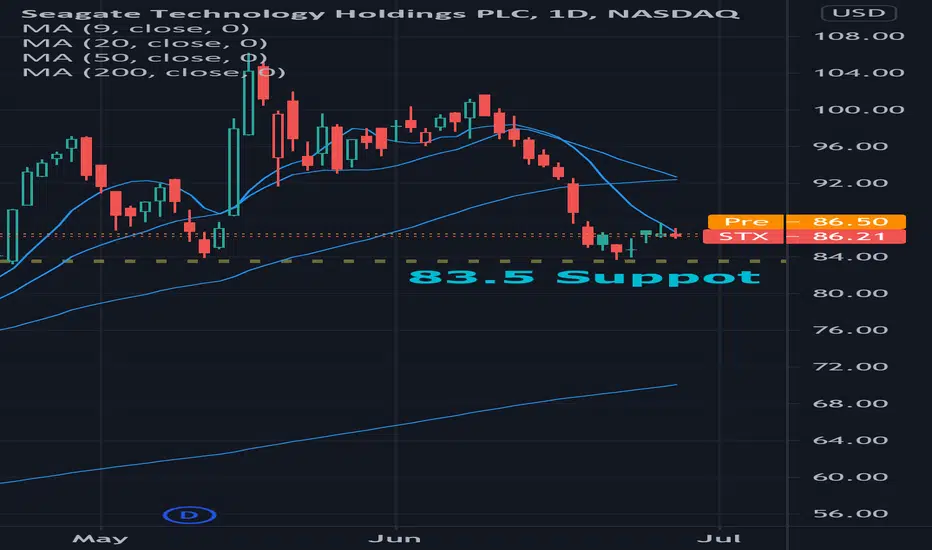
Khan's Chart-Requests 16 - $STXI like the current setup, although in a current descending channel, the EMA 200 provides a good support structure, the MA's getting tighter and we have a possible catalyst in the upcoming earnings.
STX - Will go up?According to Traders-Paradise's Algorithm, #STX has a high chance of going up
More opportunities: Traders-Paradise.com
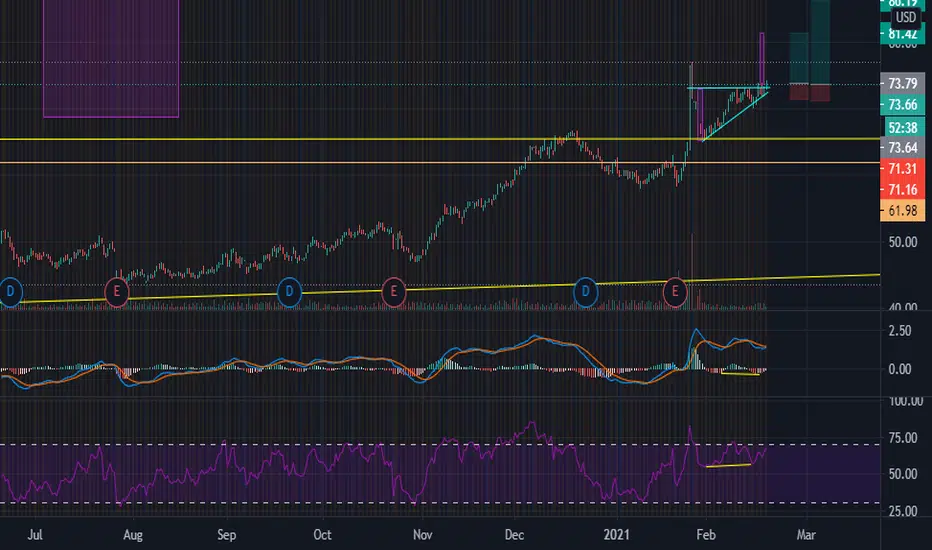
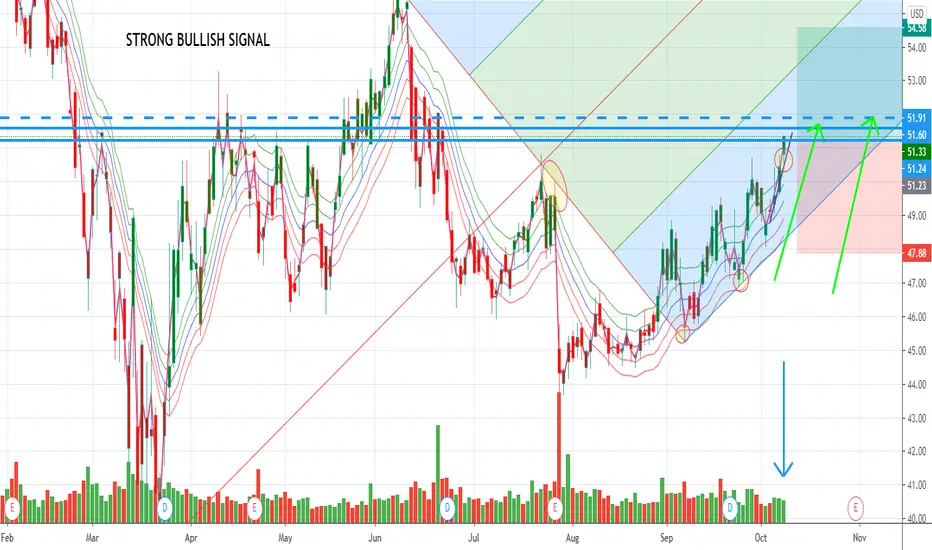
STX about to have very good weeks ahead!Looks like the $1.9T is having a strong effect on the market again. Lots of stocks showing bullishness!
STX is about to breakout of an up-sloping flag pattern.
Target profit 1 is $82-83 (calculated from the bottom of the previous swing low at about $58 to resistance at $64 i.e. a $6 move.)
Since there's no resistance, watch for reversal pattern at the Daily chart to exit, or you can trail with either the 20 or 50 MA.
Disclaimer: I'm not giving any trading and investing advice. Just sharing my chart observations.
If you have any symbol that you'd like me to analyze, feel free to leave me a comment.
Thanks!
STX wedge breakout 4h part of a much bigger b.o. on Wnice wedge breakout on the 4hr w some class c bullish divergence on the macd and rsi. tight stop as this is not a value area but if u can even believe it this is part of a bigger breakout on the weekly, the measured move of the weekly wedge is like $115
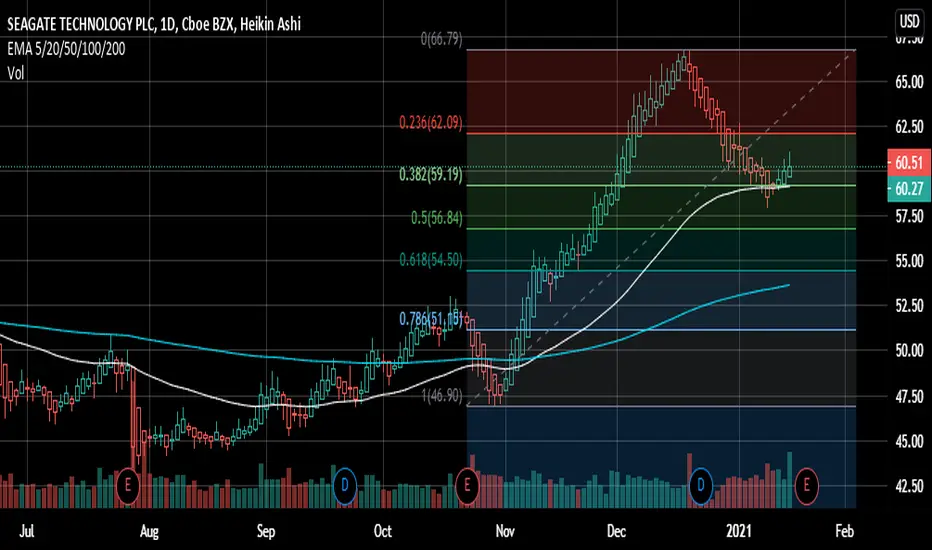
Seagate Rebounded Above EMA 50 With Fibonacci Level of 0.382Seagate (CBOE:STX) retraced to EMA 50 with Fibonacci retracement level of 0.382. Good for those seeking pullback buying
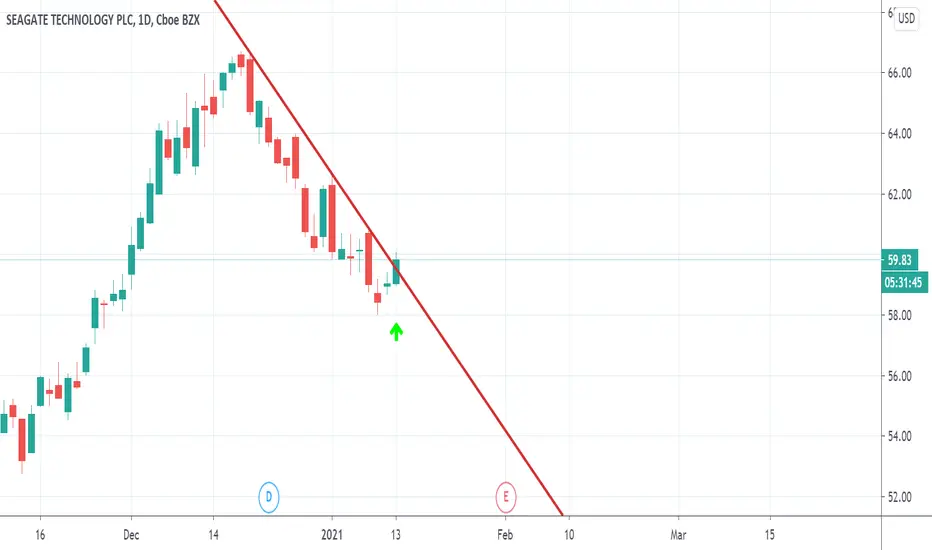
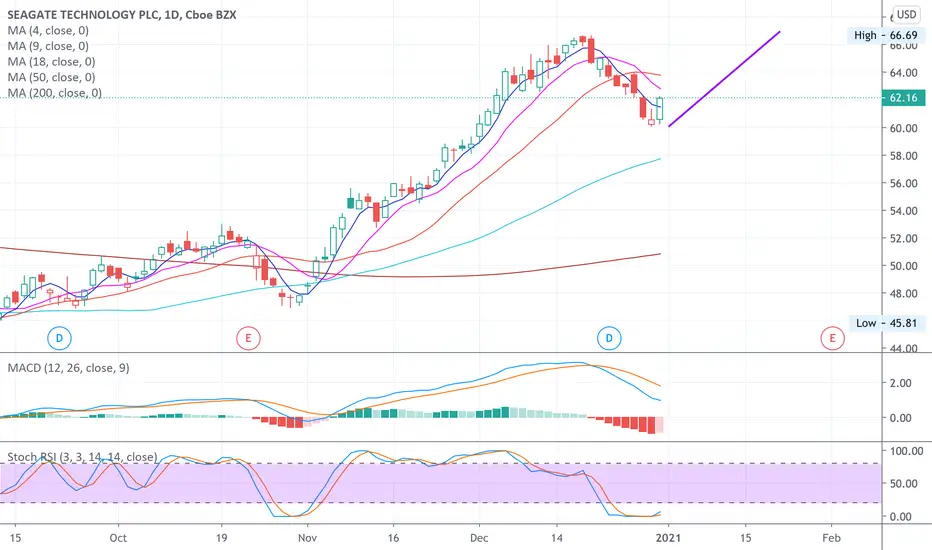
Seagate Technologies bullish trend line breakSeagate Technologies has been in a correction since mid-December, but today it made a bullish break across a trend line that has held for about 4 weeks. Seagate is one of the better values in the technology space, with a dividend payout of over 4.5% and about 11% upside to its median earnings-day valuation of the last 3 years. It's a highly innovative company, averaging 26 patents per year per billion in market cap.
Sentiment for Seagate has been somewhat negative, with analysts and technicals neutral and options interest mostly on the put side. However, today's trend line break signals that sentiment is beginning to improve. We may see one or two more dips before the stock moves decisively higher, but I do think an upward move will be coming in the next few weeks.
STX LongGood place to enter long here looking out for the $66 level for first zone. Volume is also an indicator here
STX Insider Selling of $86 Million Coupled with Potential H&S Insider selling of $86 Million final three days of December.
I anticipate an attempt at regaining $63 on Monday by this one and this is where I plan to initiate a short position by using February or March Puts.
Disclaimer: Not trading advice.
STX

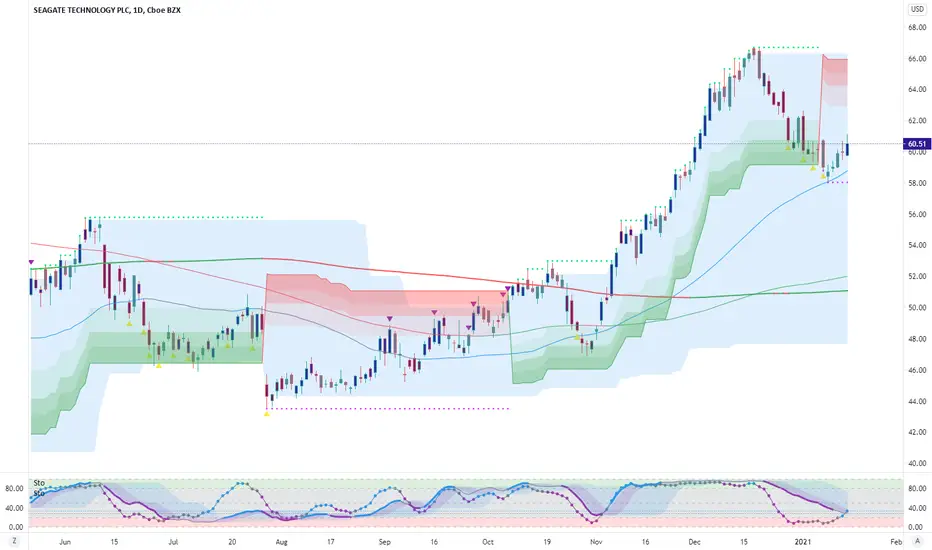
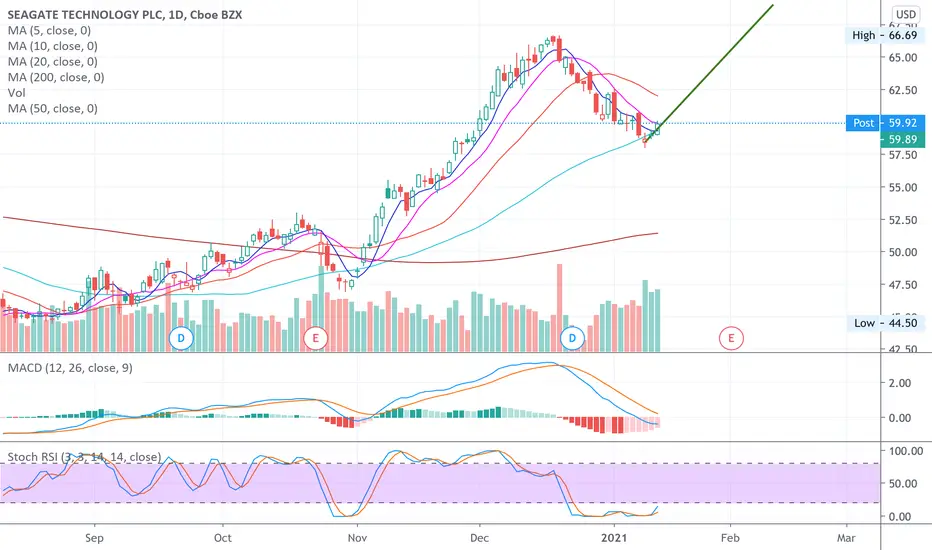
SEAGATE TECHNOLOGY Chart DailyHey investors, SEAGATE TECHNOLOGY is in a bullish configuration with low buy volume issued and a hammer bull candle. We see that the 1 Min TIMEFRAME results in an inverted hammer candle, which is heading towards its next low. And come back in a price increase, there is a great chance to come on the next higher. See the TIMEFRAME 4H and if the buyers are still there, it can land on the top that follows.
Please LIKE & FOLLOW, thank you!
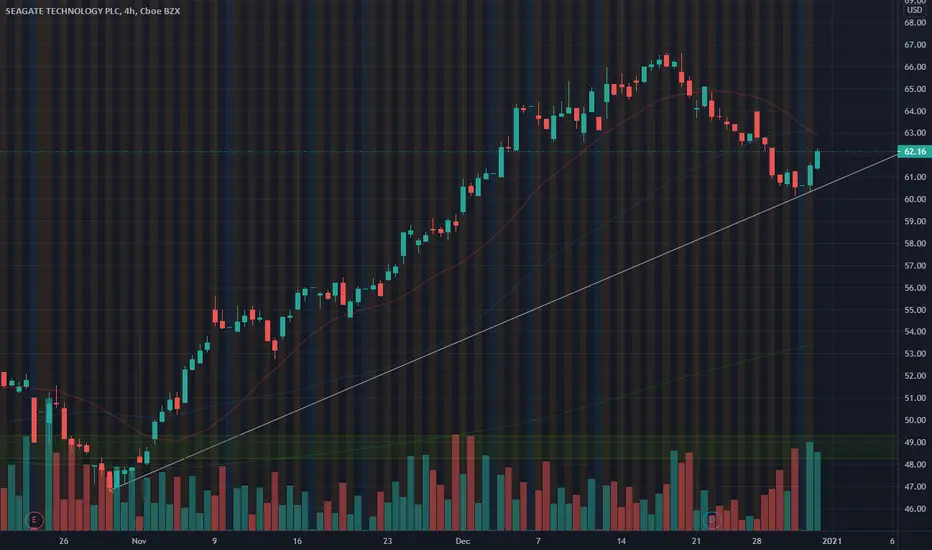
STX LONG Looking at the charts, STX may rally to the Zone at $57. I anticipate it to break through that zone and head to $62. The weekly chart shows higher highs and higher lows with a nice trendline.
It could bounce off the 57 back to the trendline and then continue to rally.
