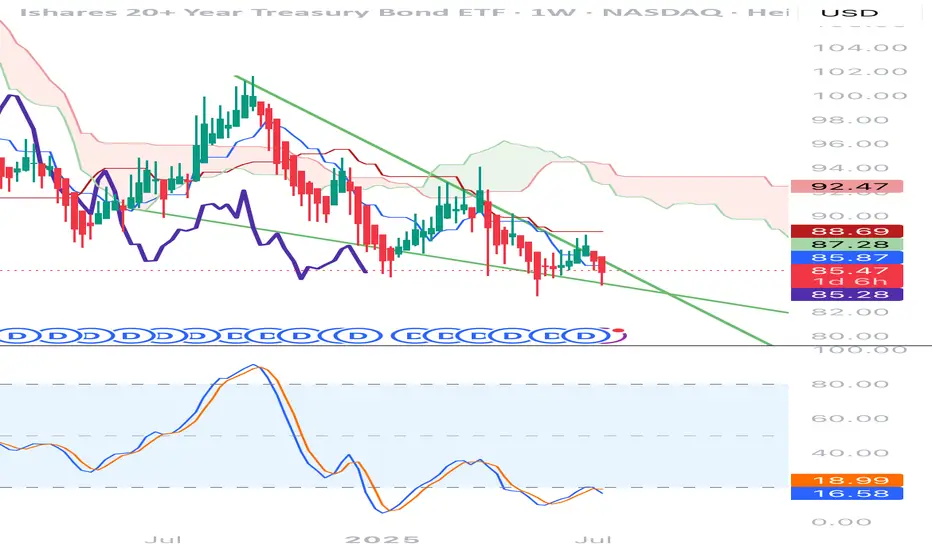
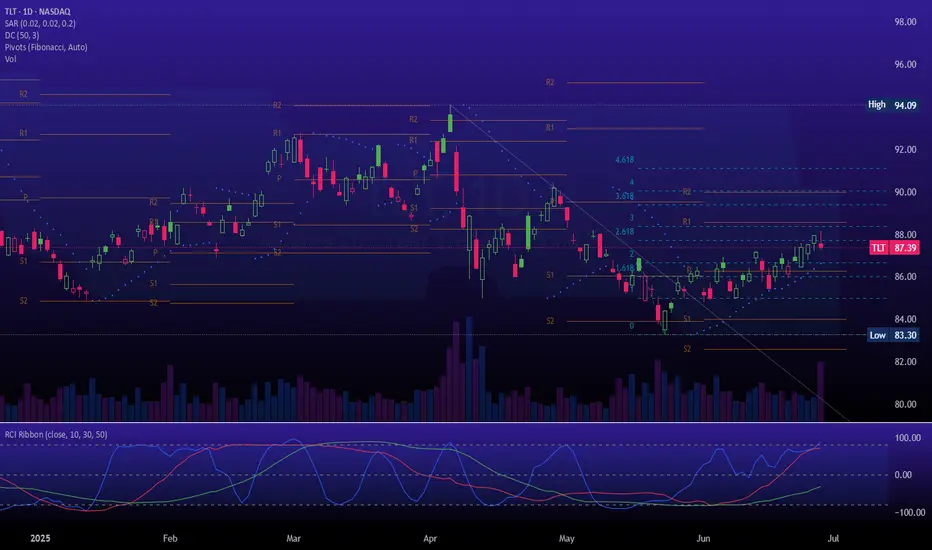
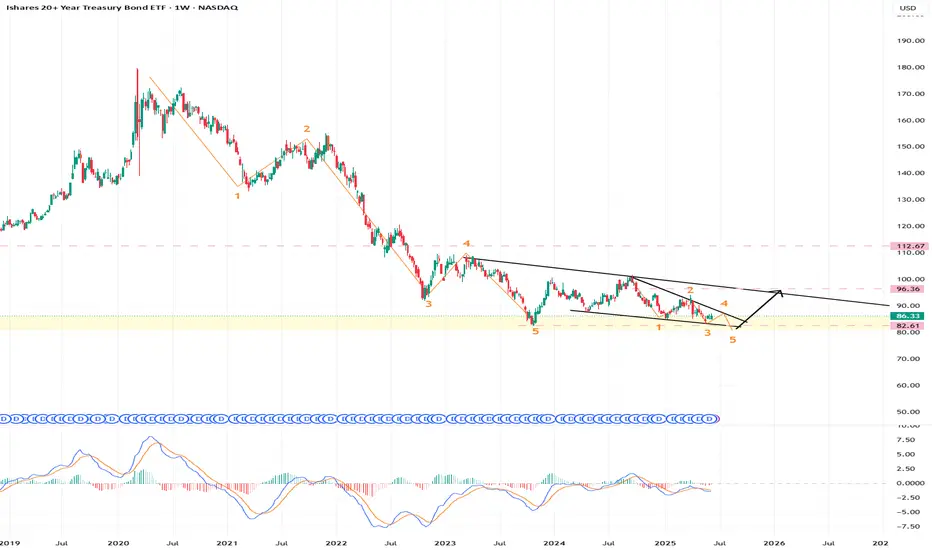
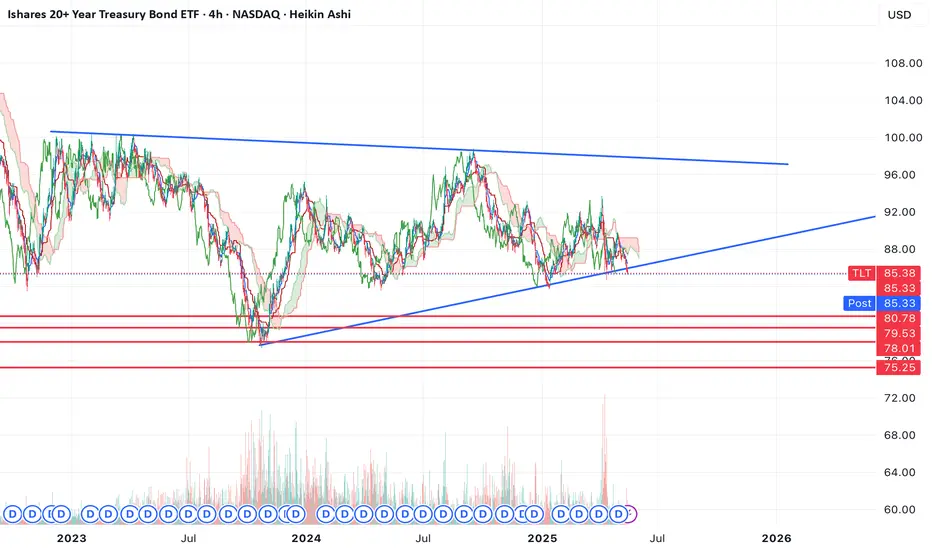
Rates Coming Down?TLT could be a great trade here. I'm seeing signs that the low could be in. The RSI is coiling up and piercing the downtrend. We are also climbing above the 21 Week Moving average, which is has been firm resistance since the rate hiking cycle.
Bond yields are tanking, employment is weakening, pressure is building on rate cuts from the highest level. TLT could be a beneficiary.
Not financial advice, do what's best for you.
TLT trade ideas

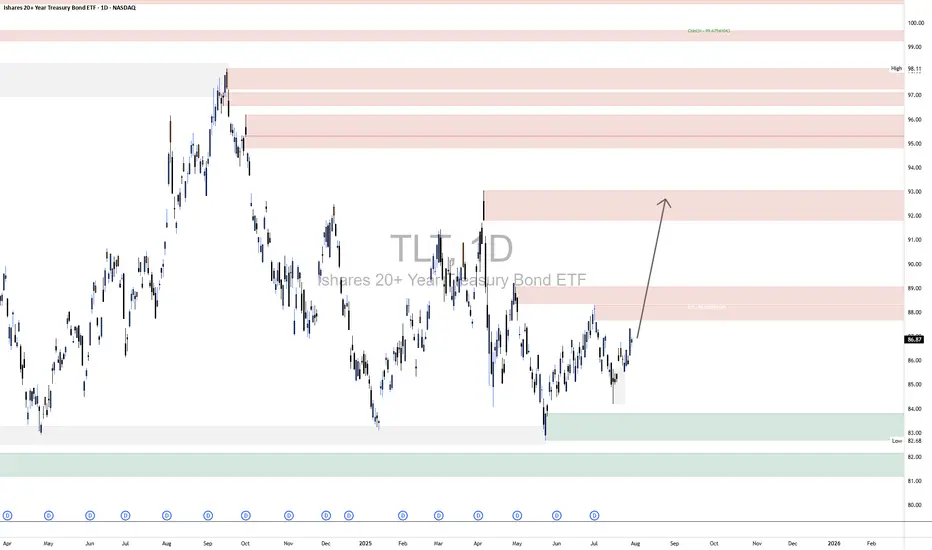
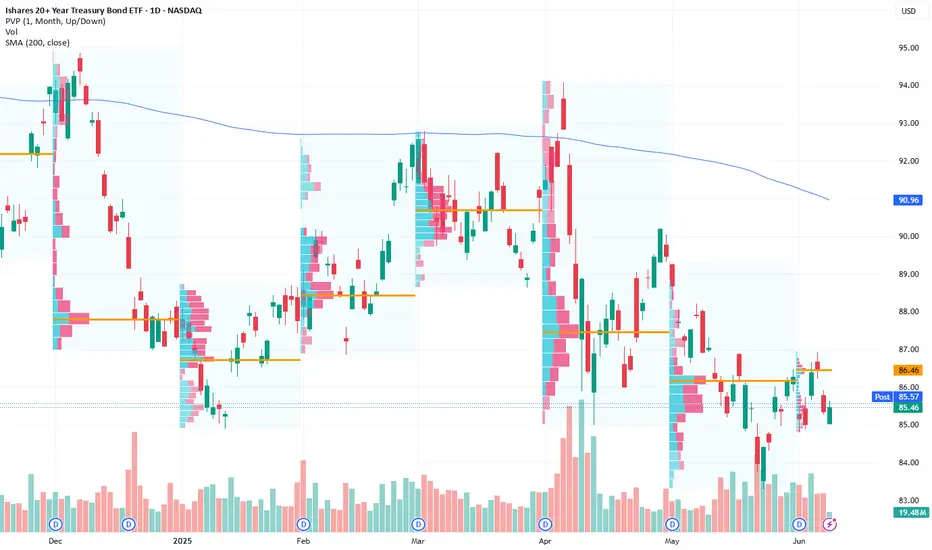
TLT LongThe broader market structure on the TLT 1D chart shows a clear downtrend, followed by a Change of Character (CHoCH) when price broke above the lower high near $86.50, signaling a potential trend reversal. This CHoCH is further validated by a strong push off the demand zone around $83–$84, where buyers stepped in with conviction, leading to a series of higher lows and an emerging bullish structure.
The demand zones below, especially the wide green area near $82.68–$84, are strong; price previously reversed sharply from this level, indicating institutional interest. In contrast, the supply zones between $88–$93 appear layered and moderately strong, especially around $88.20 and $92.70, where price previously sold off. However, the lack of deep wicks and clean rejections in the lower supply zones suggests that sellers may be weakening.
Currently, price is pushing upward toward the $88–$89 zone with bullish momentum. Within the marked region, price is climbing steadily after forming a minor higher low. If it can break above $88.20 convincingly, the next logical target would be the supply near $92.70–$93. A minor pullback to the $85.50–$86 zone could offer a buying opportunity if demand holds.
The trade bias is bullish with an expected continuation toward $92.70, assuming momentum holds. Invalidation of this outlook would occur if price breaks back below $84.00, which would indicate a failed breakout and potential return to the broader bearish trend. Momentum currently favors buyers, with higher closes and strong-bodied candles confirming upward intent.
Possible Scenario for the Bond FundSimply took a previous move the Bond Fund already made, and inverted it, copy pasted and voila. It has already happened before

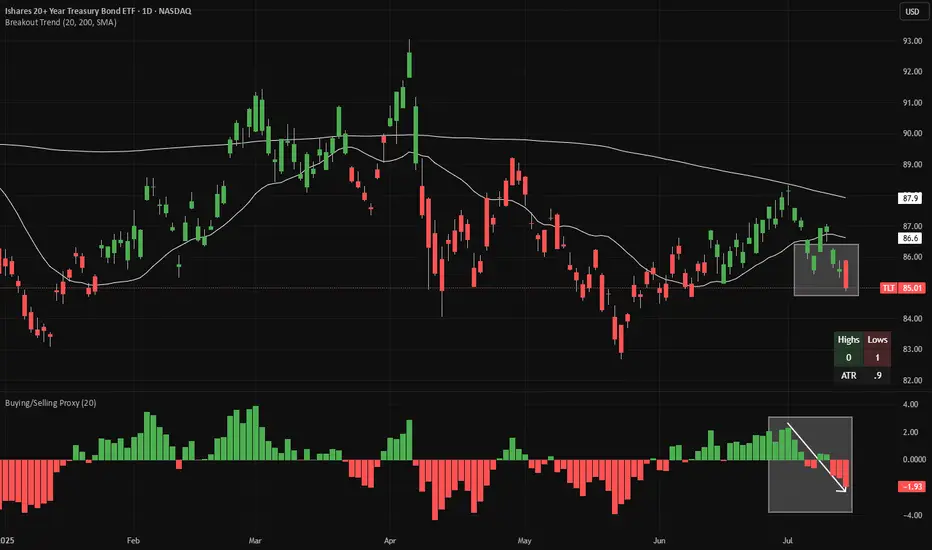
TLT short - warning signs from JapanTLT is making 20-day lows (red candles in the main chart), while continuing to make 20-week lows on a weekly chart (not shown). Meanwhile, looking at a proxy of net buying/selling (bottom panel), we have flipped from buying to selling.
Looking at Japanese bond yields, 10-year JGBs (JP10Y) just broke out of tight range. This is the third attempt to trade above ~1.59% recently, which we saw earlier today. As Japan's is one of the world's leading overseas investors, this is an obvious warning sign for bonds globally.
There is good risk/reward to short bonds here, with a stop-loss if the price closes at a 20-day high. If a 20-day high is made, the candles will change color from red to green.
Both indicators (Breakout Trend and Buying/Selling Proxy) are available for free on TradingView.
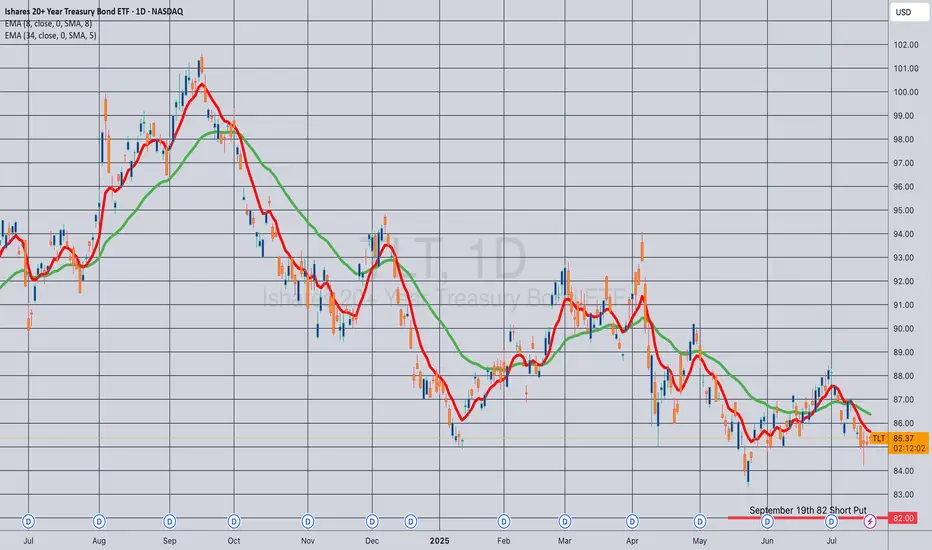
Opening (IRA): TLT September 19th 82 Short Put... for a .90 credit.
Comments: Adding to my position at strikes slightly better than what I currently have on ... .
Do we continue the wedge…Bonds have been hit hard and Crypto at Ath trend lines, do we need to finish the wedge
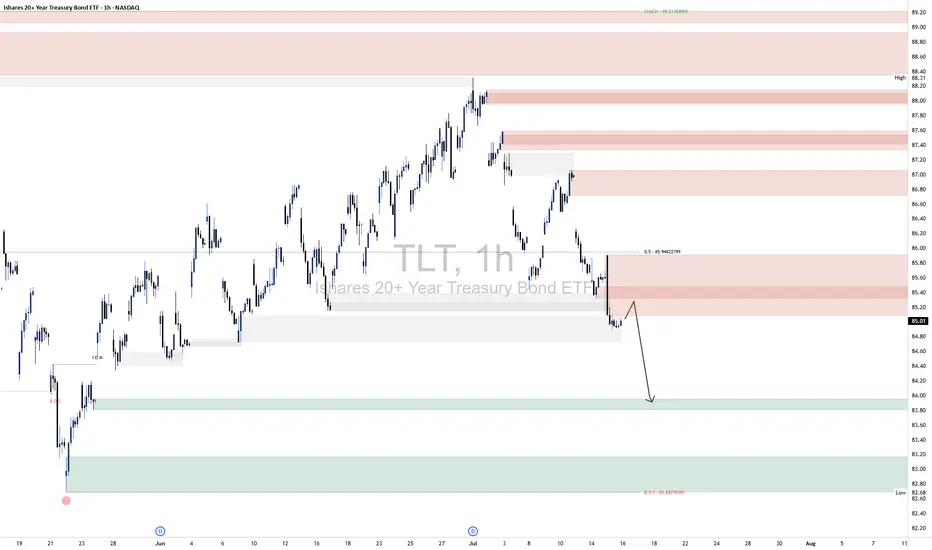
TLT ShortTLT 1H Technical Analysis
📈 Outlook:
The current setup suggests a bearish continuation scenario:
A corrective move toward the 85.20–85.60 supply.
Rejection from this area confirms continuation of the downtrend.
Target: 83.20–83.60, where resting liquidity and untested demand reside.
This sequence follows a classic liquidity sweep + supply mitigation + continuation pattern. Unless price breaks convincingly above 85.80, the bearish outlook remains intact.
🔼 Supply Zones (Bearish Liquidity Layers):
Primary Zone: 85.20–85.60
This is the most immediate area of interest, aligning closely with the 50% equilibrium level of the last bearish impulse (~85.84). Price is likely to reject from here as it also coincides with a previously unmitigated supply block and market inefficiency.
Stacked Supply Above: 86.40–88.00
Should price break the lower supply, these zones will come into play. However, the current structure suggests strong probability of rejection before reaching these levels.
🔽 Demand Zones (Target Areas):
First Demand: 83.20–83.60
This is your marked initial downside target. It represents the next logical draw on liquidity and aligns with prior accumulation and support structure. It’s likely to act as a temporary reaction zone or the next entry point for accumulation.
Deeper Demand Zone: 82.40–82.80
Marked by your secondary border, this range offers higher time-frame confluence and could act as the final sweep zone if the 83s fail to hold.
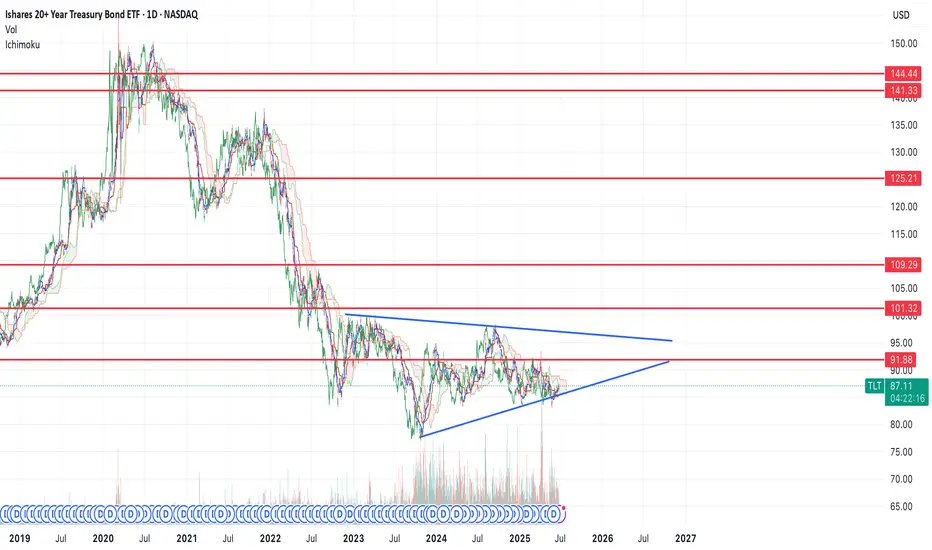
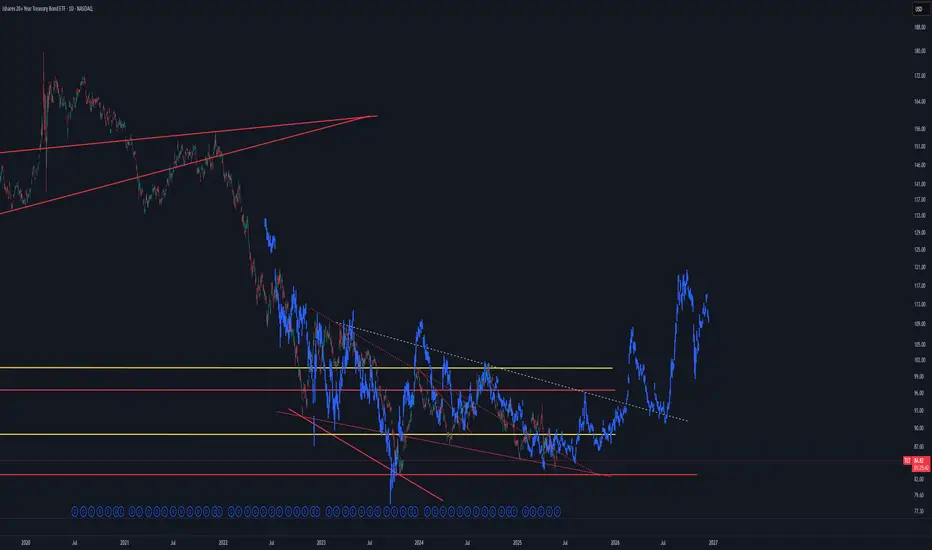
Bottom in for bonds, flight to safety trade coming soon $100+If we look at the chart of TLT, you can see that we're forming a bottoming reversal pattern.
We had a spike low down to $83 back to the middle of May and have now reclaimed the structure. I think that move marked the bottom.
I think it's very likely that bonds spike in the near future, if they can make it over the $92 resistance level, then I think price will see continuation and likely break the pattern finding the first resistance at that $101 level.
That said, I think this is the start of a larger move higher in bonds that will take us all the way up to the top resistance levels over the course of the next few years before the move is done and we start the long term trend in rates higher.
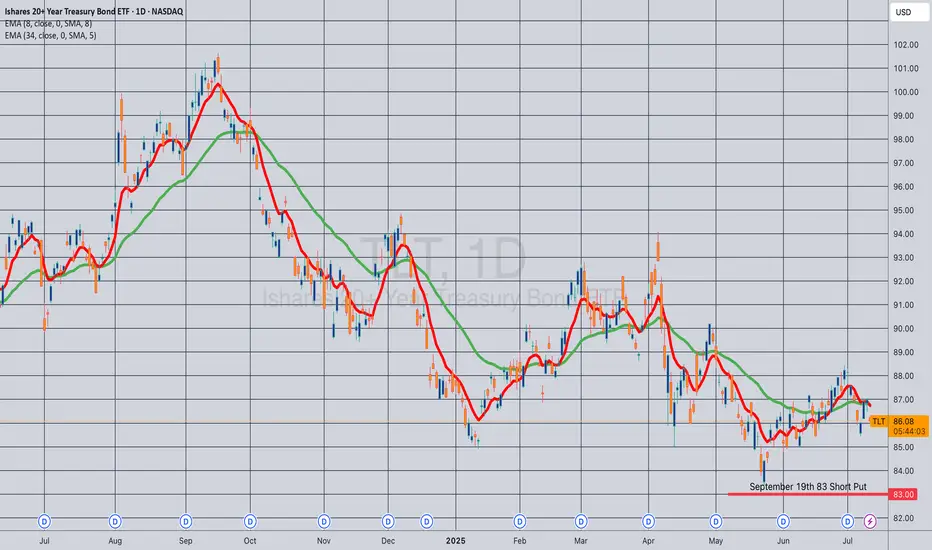
Opening (IRA): TLT Sept 19th 83 Short Put... for an .88 credit.
Comments: Camping out with a strike slightly below the 52-week low, where the options contract is paying a smidge more than 1% of the strike price in credit.
I don't really need more TLT, but wouldn't mind being assigned more at a lower price than the stock element of my covered calls.
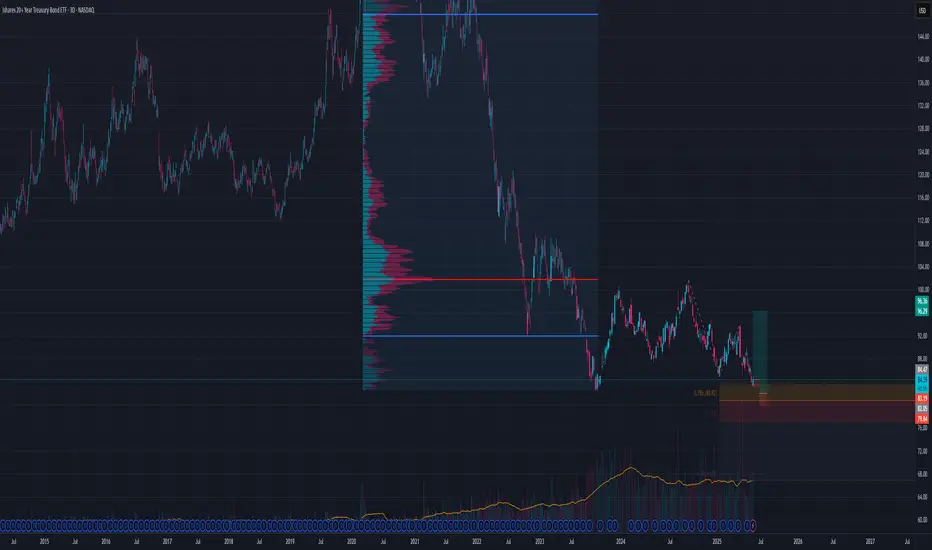
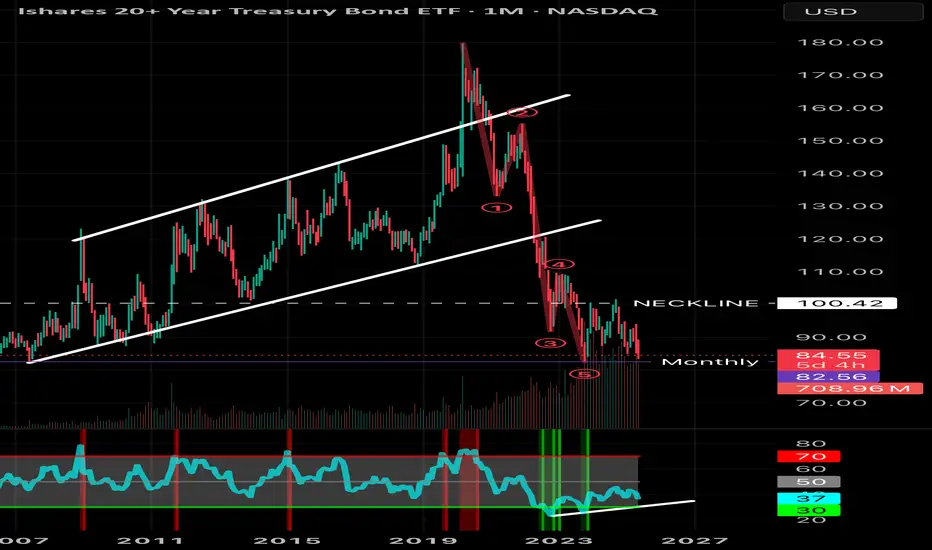
How Will Uncle Sam Strike Back? – U.S. Treasuries on the Edge📉 How Will Uncle Sam Strike Back? – U.S. Treasuries on the Edge
After covering leveraged loans ( BKLN ), junk bonds ( HYG ), and investment-grade corporates ( LQD ), we now focus on the most important piece of the U.S. credit puzzle: Treasuries.
Specifically, the long end of the curve — tracked by TLT .
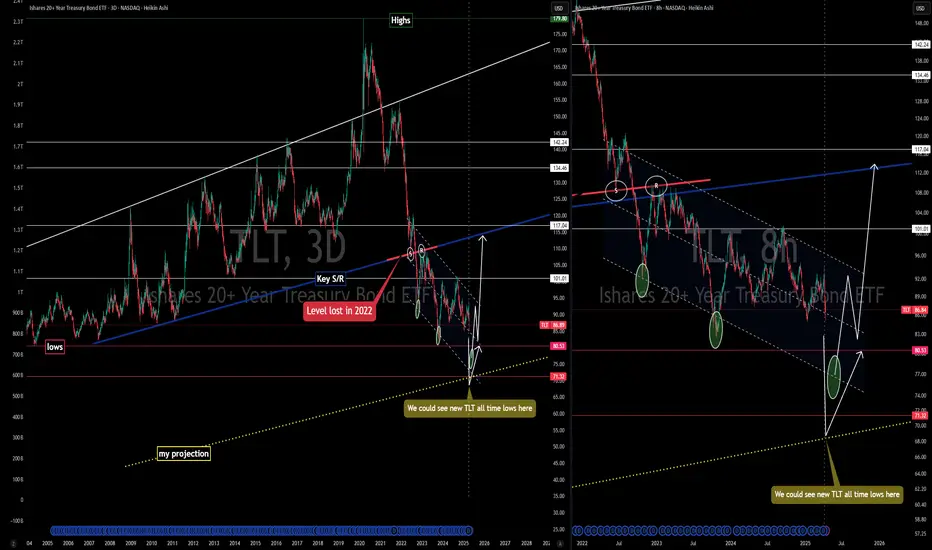
📊 What the Chart Shows
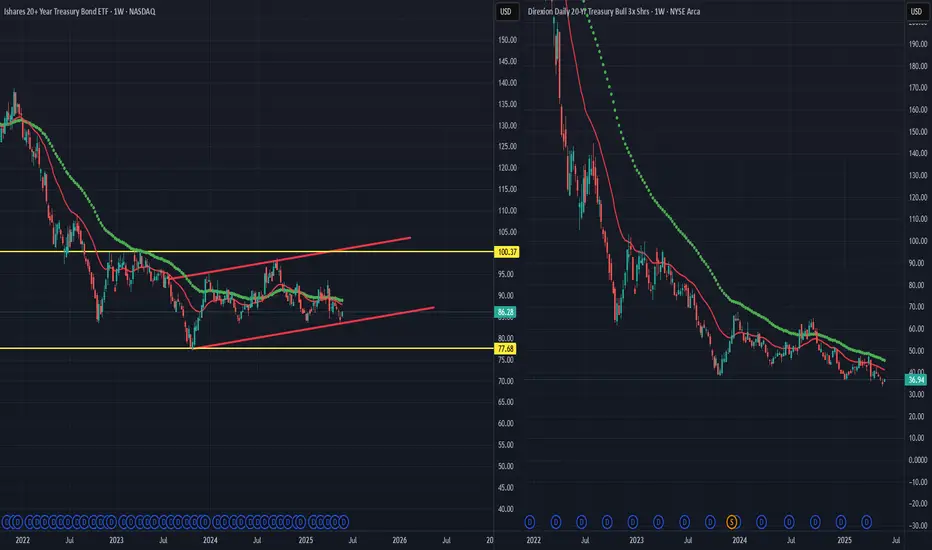
Left Panel (3D Chart)
• All-time highs in Feb 2020 at $179.80
• Long-term trendline going back to 2004
• Critical support was broken in 2022 — a structural breakdown
Right Panel (8H Chart)
• Clear descending channel since 2020
• Price has rejected from the channel top multiple times
• Recent bounces off the lower channel suggest a potential final flush
🧠 What Happened in 2022? (can't blame Trump for that...)
This wasn’t politics — it was policy.
• The Fed's fastest hiking cycle in decades
• Liquidity evaporated
• Long-duration bonds were abandoned
• The key trendline that had held for years was finally lost
That line — once support — is now resistance.
📐 My Technical Expectation
I expect one final slide before a reversal.
• Channel base sits at ~$76.32
• My projection targets $71.30 or even $68
• That would mark new all-time lows for TLT
🟡 After that? I expect a macro reversal , targeting:
• 🔼 $101 – mid-channel reversion
• 🔼 $112–115 – former support zone (2019–2022), now resistance
🔍 Macro Context
This chart isn’t just about price.
It reflects how markets are pricing confidence in U.S. debt .
And right now?
That confidence is shaky . With Trump turning 'orange' and taking it out against almost everyone else: China but also his allies(EU, Canada, Japan, etc )
🔄 Recap of the Series So Far:
• BKLN – record leveraged loan outflows
• HYG – junk bonds bounced at historical support
• LQD – investment grade bonds holding steady
• TLT – U.S. Treasuries under pressure, and possibly breaking down
📌 Next up?
🟧 CRYPTOCAP:BTC
Because when the world begins to question Treasuries , the search for alternative stores of value begins.
One Love,
The FXPROFESSOR 💙
ps. wait for the next posts...they might be epic!
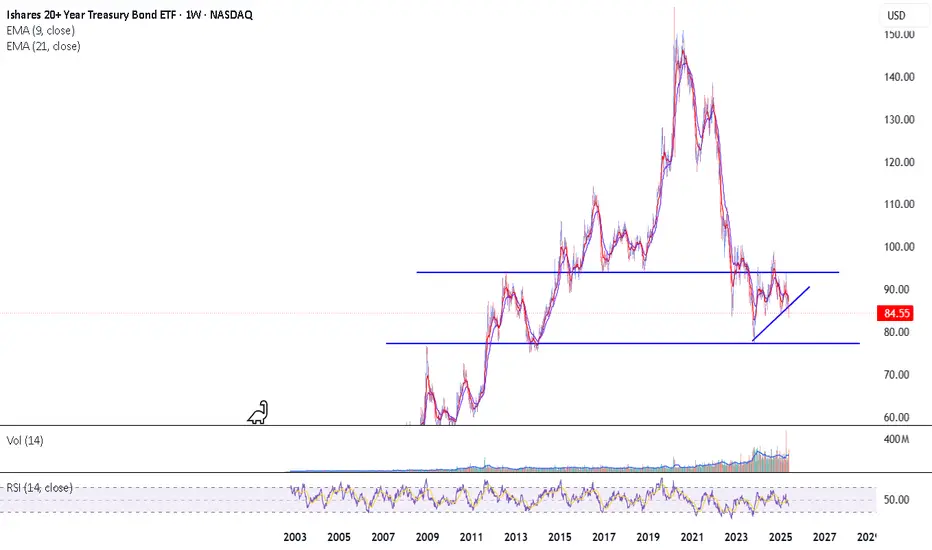
TLT is currently in the Wyckoff accumulation phaseBased on the provided weekly and daily charts for the iShares 20+ Year Treasury Bond ETF (TLT), here is a Wyckoff analysis and a potential trading strategy using a diagonal option spread.
### **Wyckoff Analysis of TLT**
**Weekly Chart:**
The weekly chart for TLT appears to be in the early stages of a potential **accumulation phase**. Here's a breakdown of the key price action in the context of Wyckoff principles:
* **Selling Climax (SC):** The sharp sell-off culminating in the low around $83.30 can be interpreted as a Selling Climax. This is where the downward momentum peaks as panicked investors sell heavily.
* **Automatic Rally (AR):** Following the SC, the price bounced to form a high. This rally is largely technical in nature as short-covering and bargain hunting come into the market. This helps to define the upper boundary of a potential trading range.
* **Secondary Test (ST):** The subsequent decline from the AR to retest the area of the SC low is a Secondary Test. Ideally, this test occurs on lower volume than the SC, which would indicate diminishing selling pressure. From the chart, it appears there was a retest of the lows.
Currently, the price action on the weekly chart suggests that TLT is in **Phase B** of accumulation. This phase is characterized by the "building of a cause" where the "smart money" is accumulating positions. Price action in Phase B can be volatile as it moves between the support established by the SC and the resistance of the AR.
**Daily Chart:**
The daily chart provides a more granular view and supports the accumulation thesis from the weekly chart. The recent price action on the daily chart shows a series of higher highs and higher lows, which can be interpreted as a **Sign of Strength (SOS)** within the larger accumulation structure. This suggests that demand is starting to overcome supply.
### **Trading TLT with a Bullish Diagonal Call Spread**
Given the analysis that TLT is in a potential accumulation phase, a bullish long-term outlook is appropriate. A bullish diagonal call spread is a suitable strategy to capitalize on a potential gradual price increase while also benefiting from time decay.
This strategy is also known as a "Poor Man's Covered Call" and involves:
* **Buying a longer-dated, in-the-money (ITM) or at-the-money (ATM) call option.** This acts as a surrogate for owning the underlying ETF.
* **Selling a shorter-dated, out-of-the-money (OTM) call option.** The premium received from selling this call reduces the cost of the long call and generates income.
**How to structure the trade:**
1. **Long Call Selection:**
* **Expiration:** Choose a longer-dated expiration, for instance, 4-6 months out, to give the accumulation and subsequent markup phase time to develop.
* **Strike Price:** Select a strike price that is in-the-money or close to the current price of TLT (around $87.39). An ITM call will have a higher delta, meaning it will move more in line with the price of TLT.
2. **Short Call Selection:**
* **Expiration:** Select a shorter-dated expiration, typically 30-45 days out. This allows for more frequent income generation as you can "roll" the short call to the next month as it expires.
* **Strike Price:** Choose a strike price that is out-of-the-money. A good starting point would be a strike near a resistance level. Looking at the daily chart, a potential near-term resistance level might be around the $90-$92 area.
**Example Trade (Illustrative Purposes Only):**
* **Buy to open:** 1 TLT call option with an expiration 6 months from now and a strike price of $85.
* **Sell to open:** 1 TLT call option with an expiration in 30 days and a strike price of $90.
**Trade Management:**
* **If TLT rallies towards the short call strike ($90):** You can choose to close the entire spread for a profit or roll the short call up and out to a higher strike and a later expiration to continue collecting premium.
* **If TLT trades sideways:** The short call will lose value due to time decay (theta), and you can potentially buy it back for a lower price than you sold it for, or let it expire worthless. You can then sell another short call for the following month.
* **If TLT declines:** The value of your long call will decrease, but this will be partially offset by the premium received from the short call. The risk is limited to the initial net debit paid to establish the position.
> **Disclaimer:** This information is for educational purposes only and should not be considered financial advice. Options trading involves significant risk and is not suitable for all investors. It is crucial to conduct your own thorough research and consult with a qualified financial advisor before making any investment decisions.
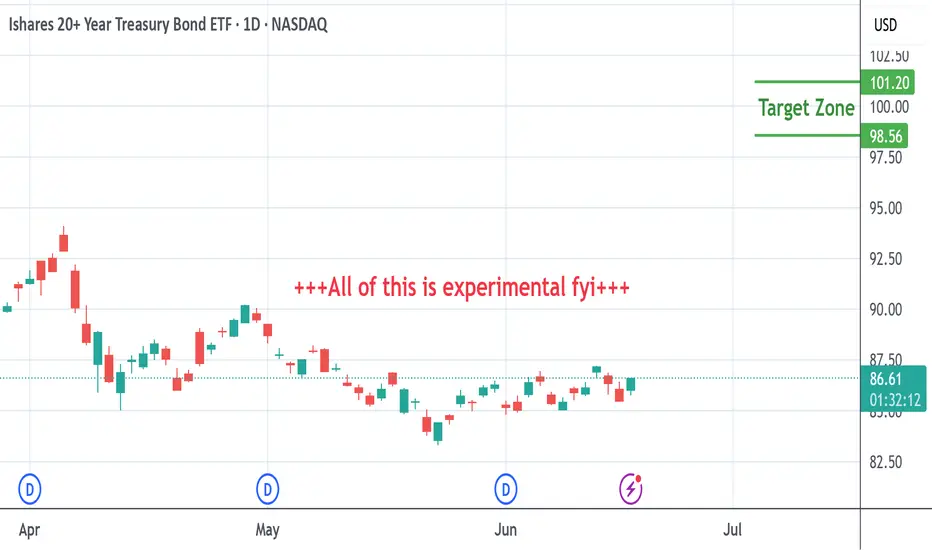
TLT long into Sept. 26th?I had TLT on my calendar (from the very EXPERIMENTAL dowsing work that I do) for yesterday and today from readings I did on 5/22 & 5/18.
Being that it was looking like a swing low in this date window, I checked this morning, & from the very experimental work that I do, I get that it's heading to around $100. I had a prior post suggesting a larger bottom in place, and this appears to have been accurate.
The date for exit (VERY EXPERIMENTAL & for journaling purposes) I get is Sept. 26th.
*** NOTE ***
I post things here as a method of journaling ideas. If it aligns with YOUR OWN WORK, great. I'm pretty sure everyone has their good and bad streaks no matter what method they use.
So, I had a rough patch after finding out my incredibly special companion kitty was dying. Did I know att this would affect my work? No! I tried to stay "normal" ( for me ;) ). Did I learn something? Of course, & in the future I will allow myself more downtime to come back to balance.
No one really knows what's going on in my life, but I guess this work is probably more subject than other methods to emotional or energetic disruptions. I always clear my energy, but in certain circumstances it may be better to just chill. I'm learning as I go. If you have any advice on making this work better, please lmk.
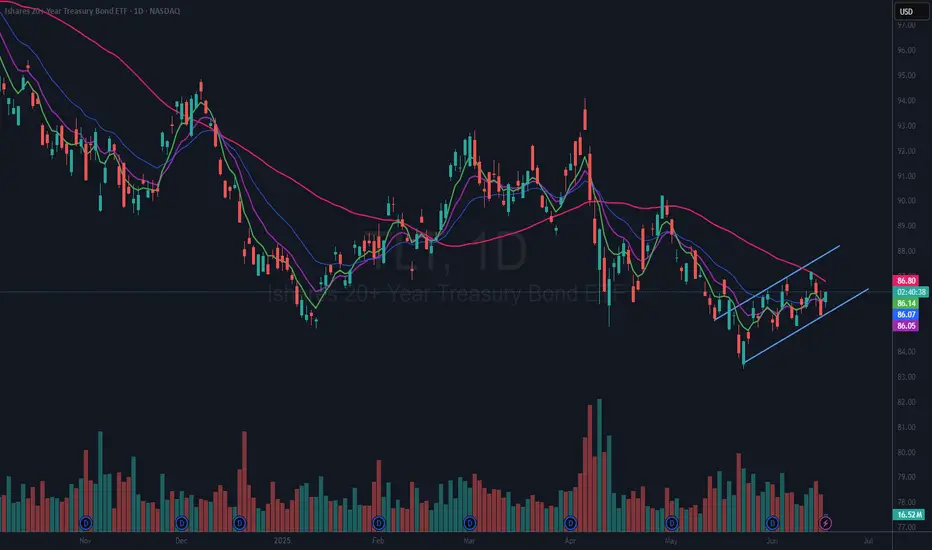
$TLT Rising Channel or Bear Flag?Is it time to invest in NASDAQ:TLT ? It looks positive to me. With inflation cooling down it looks like bond prices could increase, which means rates are lower. We do have a Fed Meeting coming up so there could be more volatility depending on the “Feds” messaging.
I am taking this long today with a ½ size position. I will place my stop just “below” yesterdays low of $85.46. I am going long because I see a series of higher lows and higher highs. And I have a well-defined risk level of about 1% to know if I am wrong.
If you like this idea, please make it your own. Make sure you follow your trading plan.
Trade Long on TLT: Opportunities Amid Weakness in Treasuries
Targets:
- T1 = $86.50
- T2 = $88.00
Stop Levels:
- S1 = $84.00
- S2 = $83.00
**Wisdom of Professional Traders:**
This analysis synthesizes insights from thousands of professional traders and market experts, leveraging collective intelligence to identify high-probability trade setups. The wisdom of crowds principle suggests that aggregated market perspectives from experienced professionals often outperform individual forecasts, reducing cognitive biases and highlighting consensus opportunities in TLT.
**Key Insights:**
TLT, which represents long-term U.S. Treasury bonds, is currently trading at discounted levels following recent declines. This weakness stems from macroeconomic concerns and tightening monetary policies. Traders are paying close attention to the Federal Reserve's stance on interest rates, as hawkish behavior continues to suppress bond prices. However, current oversold conditions paired with strong technical levels around $85.00 suggest a potential reversal. A move higher could be catalyzed by dovish signals from policymakers or slowing inflation data, which may ease investor fears about prolonged rate hikes.
Treasuries often act as safe havens during volatile market conditions, and seasoned investors see value in entering positions during times of weakness. Traders should also monitor global economic indicators, as international risk events could fuel additional demand for long-term U.S. bonds.
**Recent Performance:**
Over the past week, TLT has experienced bearish pressure, losing nearly $1.50 in value. The asset's decline mirrors broader fixed-income struggles, with junk bonds (JNK) showing parallel weakness. However, late-stage declines and deceleration in momentum suggest stabilization might soon occur. TLT has maintained its position near the critical $85.00 support zone, hinting at limited further downside, especially as bond yields stabilize.
**Expert Analysis:**
Technical analysts highlight that TLT's Relative Strength Index (RSI) is approaching oversold territory, reinforcing the likelihood of bullish momentum. Historical price action indicates that dips below $85.00 historically see swift recoveries, driven by renewed buying interest from institutional players. Additionally, macroeconomists suggest that reduced bond issuance paired with moderating inflation could support TLT prices in the medium term.
The current price range provides a favorable risk-to-reward ratio for those with an intermediate to long-term outlook. Tactical entries at these levels could yield gains if market dynamics shift in favor of easing rate pressures or economic uncertainties drive bond demand.
**News Impact:**
Recent news highlights sustained investor caution as markets digest hawkish rhetoric from the Federal Reserve and await key economic data such as CPI and employment figures. While TLT remains under pressure from elevated bond yields, geopolitical tensions and emerging-market volatility could bolster demand for U.S. Treasury bonds as a safe-haven play. Events such as unexpectedly weak inflation data or dovish commentary from policymakers could further aid TLT's recovery.
**Trading Recommendation:**
Based on the analysis, TLT presents a favorable long opportunity for traders looking to capitalize on oversold conditions and technical support around $85.00. The proposed targets of $86.50 and $88.00 provide attainable high-probability price points, while stop-loss levels at $84.00 and $83.00 ensure minimal risk exposure. Monitoring macroeconomic indicators and policy announcements will be crucial in confirming the bullish outlook. Entering long positions at current levels provides a compelling risk-to-reward setup, aligning with professional trader consensus.
TLT: Possible bottom very soonHello,
Fed waiting to reduce rates and when they actually do it will impact TLT and may mark the bottom for TLT.
Looking at this fractal, it is following this pattern near perfectly, which indicates the bottom very soon.
Happy trading NASDAQ:TLT
$TLT breaking down? $80 target?TLT looks to be breaking down out of a bear flag.
We've already had multiple touches of the lower trend line and now it looks like price has broken through.
I think the most likely target is $79-80, but I've included multiple supports just incase we see a larger move than I'm expecting.
I'm looking to buy those levels should they hit as I think we'll see a longer term bullish move afterwards.
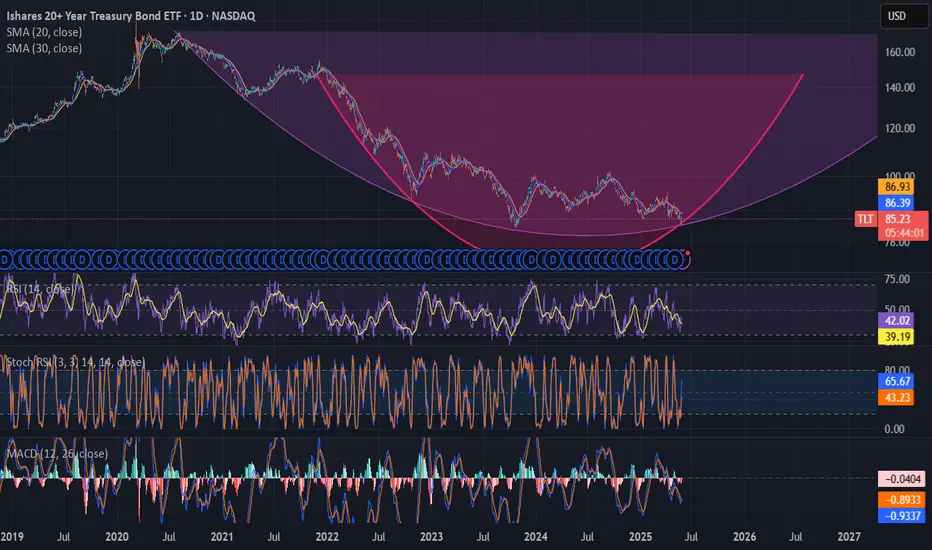
TLT is going on a TILT to the UPSIDEPerfect storm brewing. Everyone thinks TLT going down more. Rates should come down and send this flying to the upside. Chart arc has a double touchpoint on the long term and medium term. Its a FIESTA!
No refinance for u! $TLTContinuation of bearish behavior means you stuck with your 6-7% mortgage rate for awhile. But don't be sad maybe that will be considered a good rate in the future. TLT still looking or support check back around $77 to see what happens next!
Bond Market Crisis - Opportunity?Pay close attention to the bond market, particular to the 20 Year Treasury yield which is creeping back up. This is really bad news for the markets, yields could spike higher which could send the market tumbling. This cascade effect could provide an optimal entry into TLT - which is an inverse play on interest rates.
There is currently no reason for the Fed reserve to reduce interest rates. Inflation is creeping back up and the cost implications of tariffs are yet to truly felt in the inflation readings. Meanwhile, the US has lost its perfect credit rating and the debt burden continues to grow. The Fed will not reduce rates if inflation shows no sign of abating. Note that in the UK inflation is back up and I expect this to also be the case in the US.
My plan is to watch this play out and look for opportunity in TLT. I don’t want to get caught up bag holding stocks if there is a major bond crisis. As far as the chart is concerned, I expect a double bottom pattern and bullish confirmation with a break of the neckline.
None of this is financial advice, do what’s best for you.
TLT Is Yelling at UsYou typically see a migration to TLT when people are looking for a safe haven from troubled markets
I posted about TLT previously and thought we were about to see a rush to the trade because of potential market weakness
Well as we know this Bull market continued to show legs and subsequently TLT has been grounded on the launching pad
The market is yet again showing classic signs of topping
Are we saying that the market is about to crash? NO..not yet
What we are saying is that liquidity is leaving the equities markets in droves and TLT will most likely be a place where that liquidity finds a home
So pay close attention to TLT over the next 6 months because its going to tell you everything you need to know about this bull market

TLT Long Here or CloseI expect TLT to rally this summer since rate cuts are more likely then not
TP1 91
TP2 96