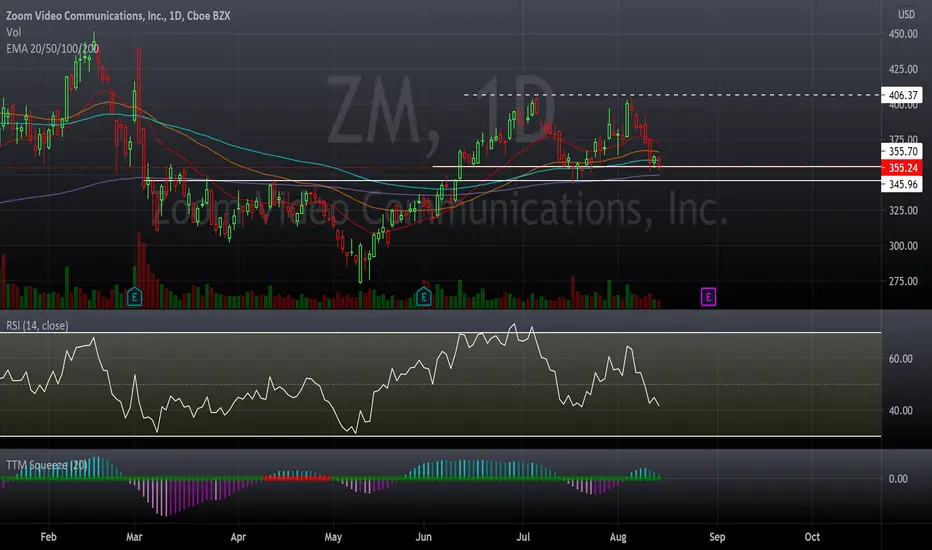
SWING UPDATE: ZMZM in life support rn, puts printing also market it complete garbage rn. Break below this level and I see 310s.
ZM trade ideas
Zoom Video Communications, Inc.Friday, 20 August 2021
6:04 AM (WIB)
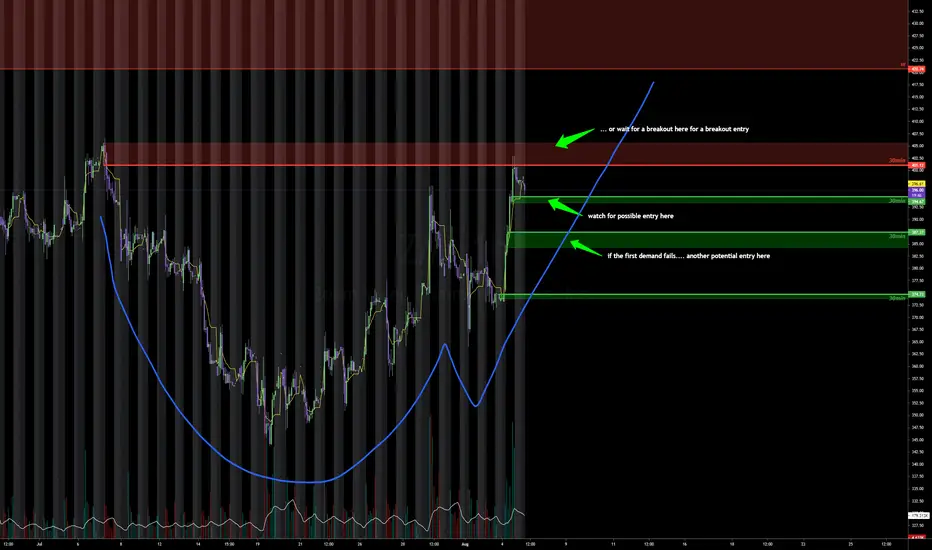
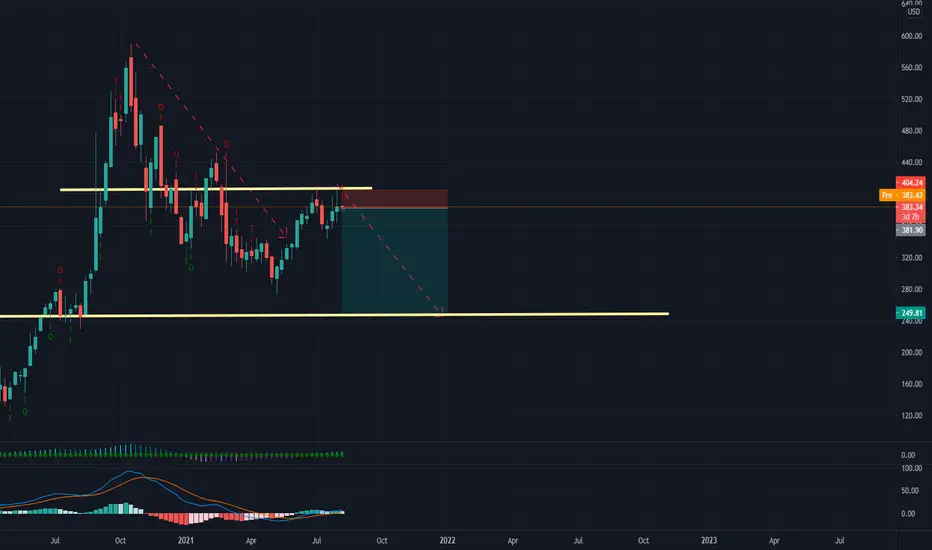
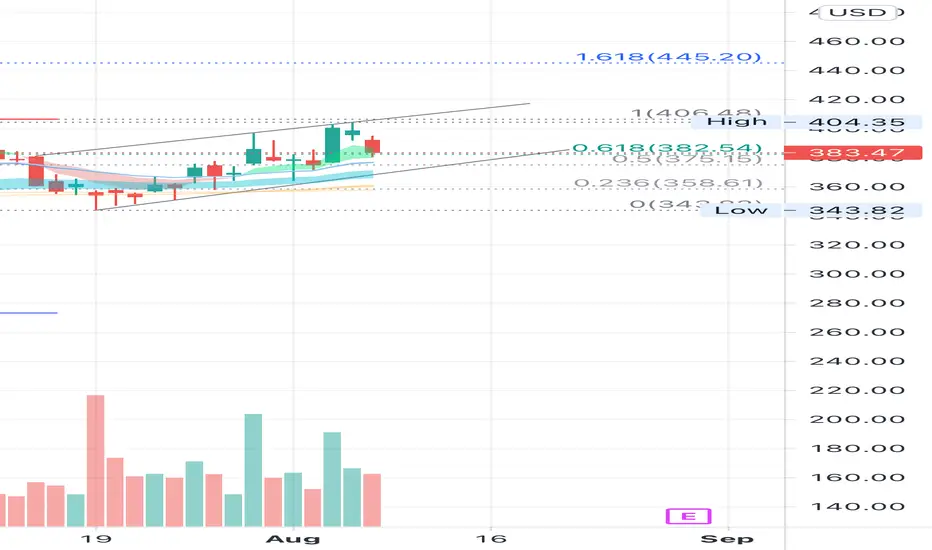
Zoom will fall from 0.382 F into the base ground support area. There is still about 16% drop.
After that Zoom will start to move upside with possibility 80% of ROI from ground support.
Keep watch intense and keep notes.
Best regards,
RyodaBrainless
"Live to Ride and Ride to Live"

Zoom Analysis 18.08.2021Hello Traders, here is a full analysis for this asset. The entry will be taken only, if all rules of your trading plan are satisfied.
Therefore I suggest you keep this pair on your watchlist and see if all of your rules are satisfied.
Leave your thoughts in the comment section, I will reply to every single one of them.
P.S. Tell me which asset you want me to break down next and I will cover it in my next analysis
_____________________________________________________________________________________________________________________________________________________________________

Normal Analysis.Just a Normal Analysis I did. Doesn't have the highest probability but has decent chance.
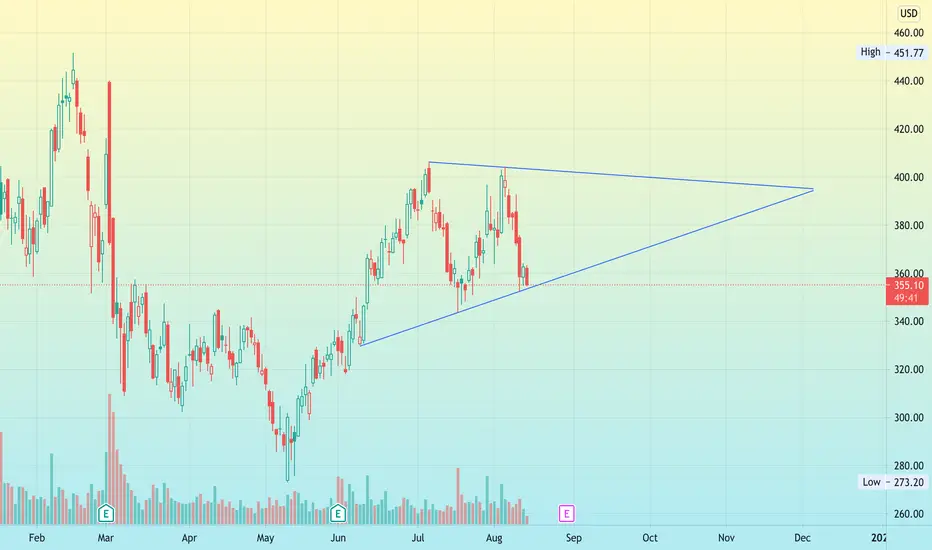
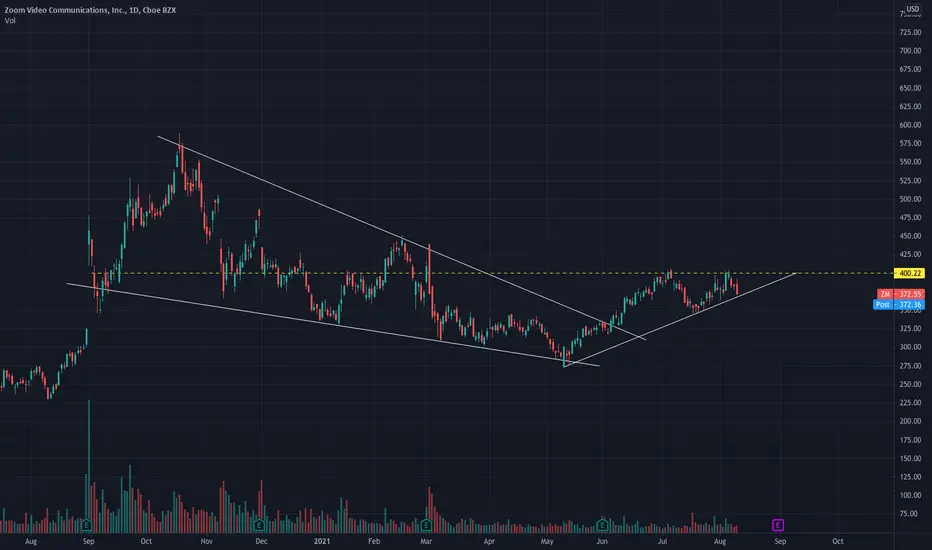
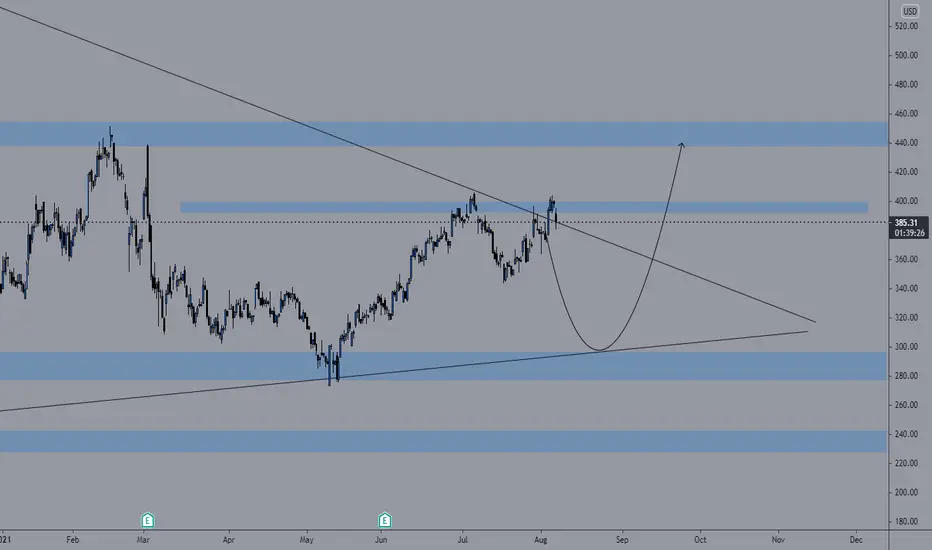
Zoom Trading in a Symmetrical TriangleZoom is Trading in a symmetrical triangle currently. It just bounced at a support level and is likely on its way back up to resistance. Watch out for earnings later this month as this could cause a false breakout in either direction. Short term long swing trade currently...
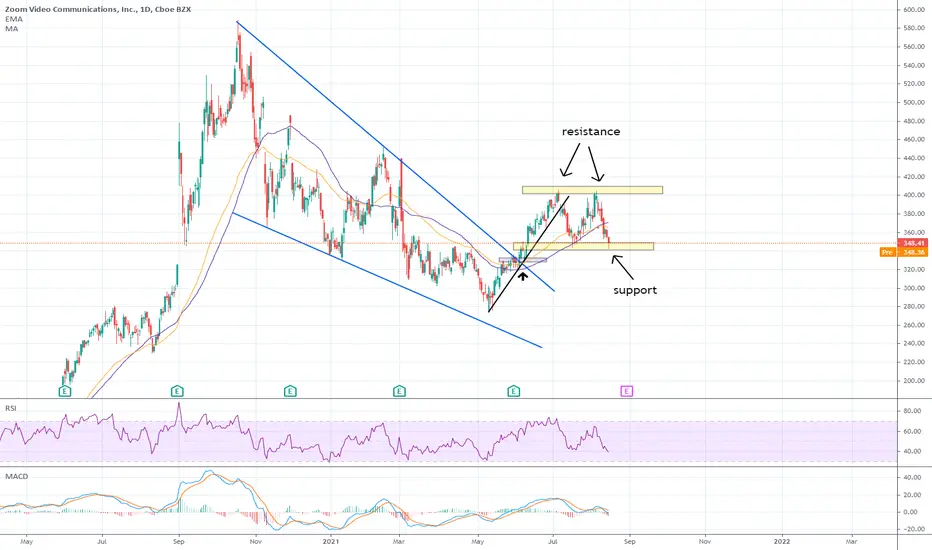
Zoom at support zoneZoom is moving between support zone and resistance zone.
We need to wait where Zoom will break out.
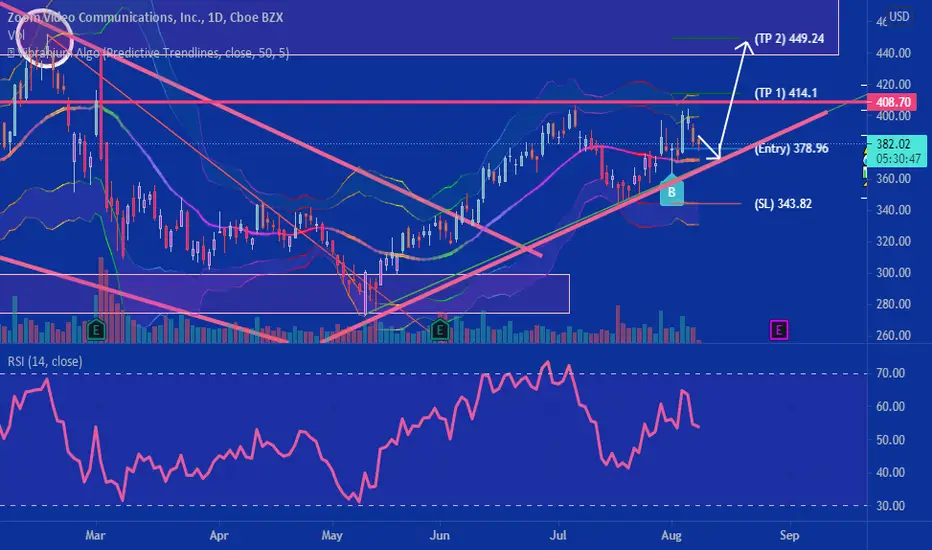
ZOOM VIDEO FLAG AND POLE Hello All
Hope the last trading week was in the green for all of you.
Back with a flag and pole on a daily and weekly time frame on ZM (this chart is on a daily).
Good entry point if the daily takes support of the trend line and closes above the previous low.
Stop loss just below the support trend line of the flag ( see red horizontal line ) .
My entry is at the yellow horizontal line.
Risk management rules fit well to a 2% rule if you start with a small to medium position for now.
Can always pyramid on more while the stock is on its way up after a breakout of the resistence trend line of the flag with zero risk. ( stop loss = entry point ) or even add a trailing safe zone stop loss for profit taking.
The target beautifully meets the previous resistence as you can see in the picture ( marked green horizontal line ).
If you like the idea and would want more of such entries and exit ideas , please leave a like and a comment.
Your support is greatly appreciated.
Happy Trading
SWING IDEA #24: ZMZM back at our old entry, still has room to go down down to $344-$346 with buying momentum dying out. Not entering just on my watch. Bearish under $340.
Not finacial advice just my opinion.
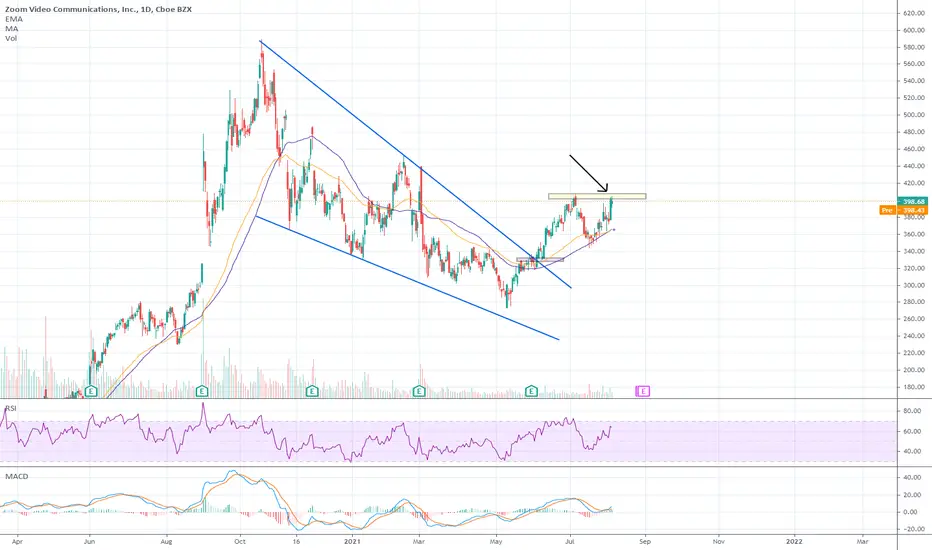
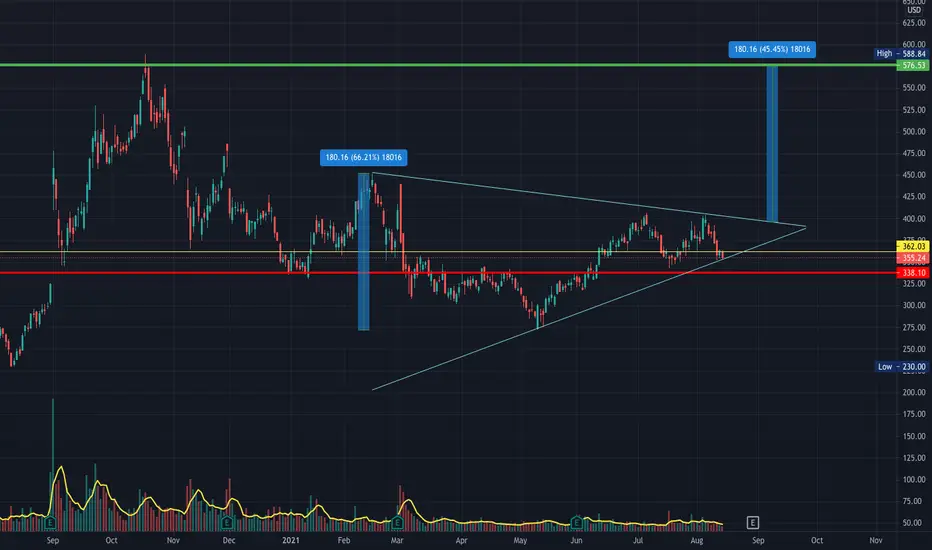
ZM: Next Target $405 And Higher...On the daily chart , ZOOM looks very bullish . After the price was corrected we can clearly see a break out from a falling wedge pattern. Anyway, this is only the daily chart development and we have also to anticipate potential corrections along with the upward movement. A potential scenario that I am looking at, is that the price may complete a type of bullish triangle before moving higher again. The second scenario is that the price may retest the low again up to the previous major support zone near $283.
If the price break above $406 without completed any of these two scenarios we may see it move higher directed to our targets of $444 and $570.
Thank you and Good Luck!

Candlestick Analysis Only Based on this candlestick analysis will ZM return to a higher high? OR is a down trend about to start?
You are the analyst
Comment your thoughts below
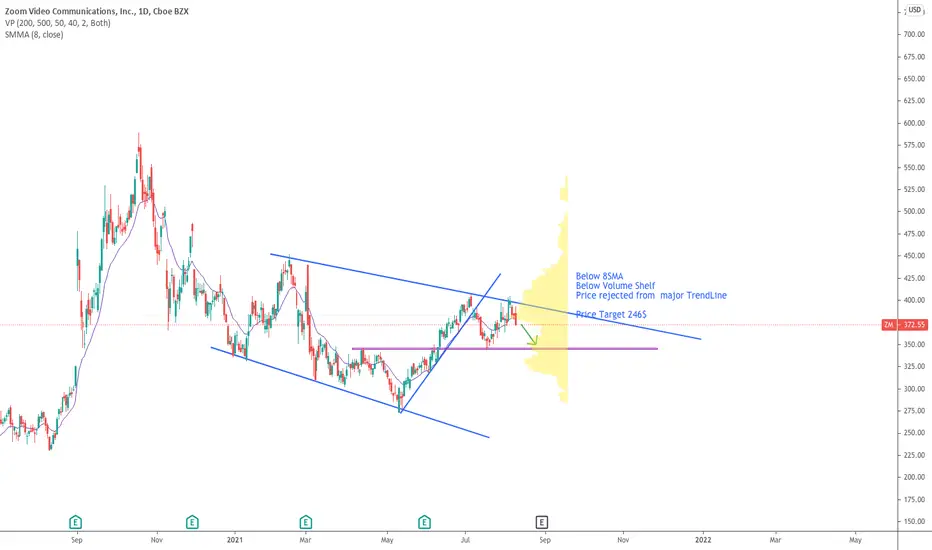
Short $ZM Technical Setup $QQQ $SPX $SPYBelow 8SMA
Below Volume Shelf
Price rejected from major TrendLine
Price Target 246$
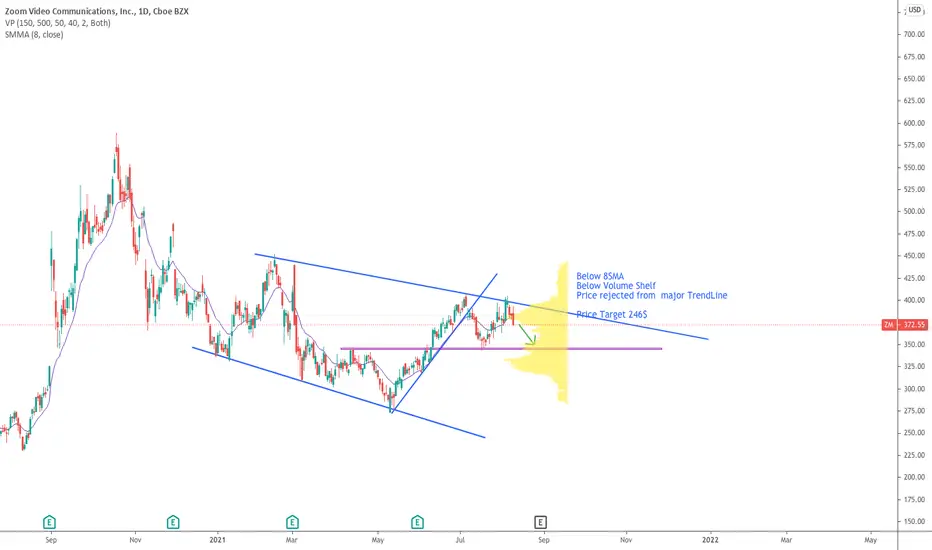
Short $ZM Technical Setup $QQQ, $SPX, $SPYShort $ZM Technical Setup $QQQ, $SPX, $SPY
Below 8SMA
Below Volume Shelf
Price rejected from major TrendLine
Price Target 246$
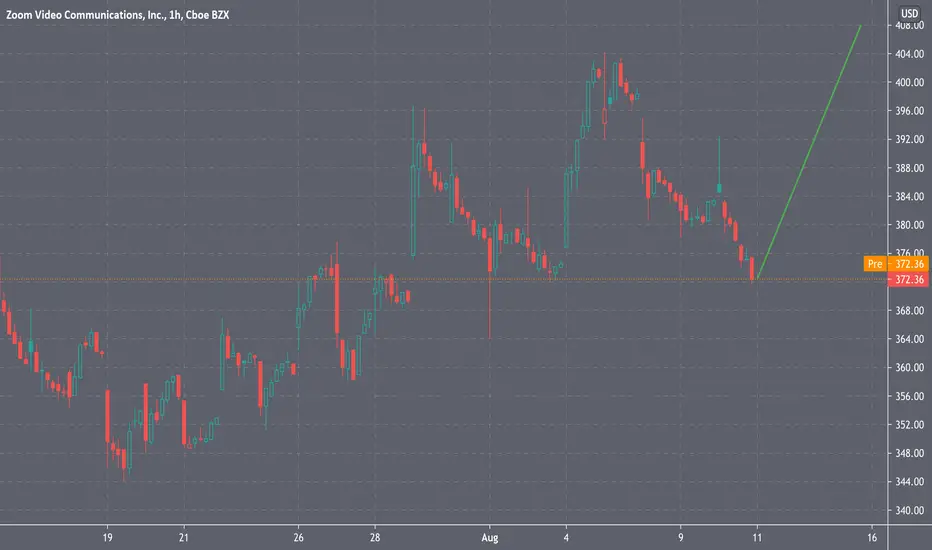
ZoomI like ZM here close to trend line support $370. Good r/r trade for a target of $400. Earnings report on Aug 31. Stock responds to any negative covid news or lockdown news.
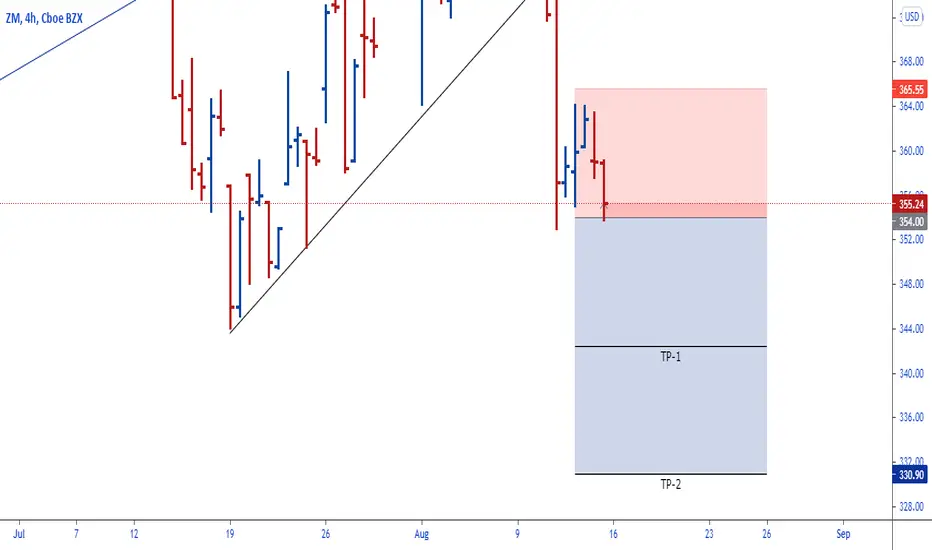
Inside bar on ZM weekly Inside bar on ZM weekly candle (bearish below 378)
Short below 378
Price Targets:
1)375
2)370
3)365.. Bounce here with support below this butters..into $360
could see a pop here any day nownice trendline support here for ZM, could bounce off it a few more times before the next leg up. if we go under 360 it will break support and turn bearish. for now lets target 450, stop loss 360! goodluck, like and follow for more <3
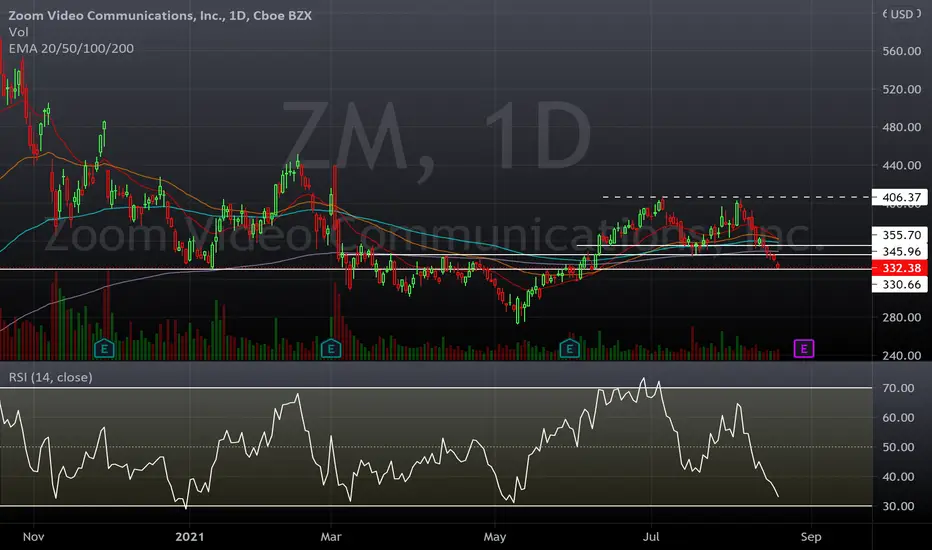
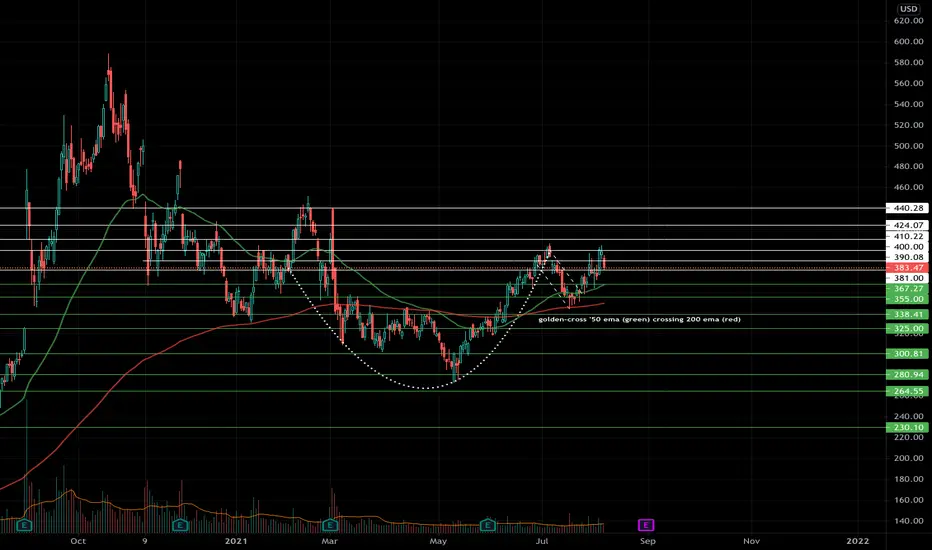
ZMZM failed at 400 last week and back-tested 390, 380. If ZM holds at the 380 level, I wouldn't consider buying calls until it breaks 400-410.
Around 390 it's best as a quick day trade, for now it is just in a range and an average trade.
Once it gets a strong close around or at the 410 level, from there it could test 424, 440.
IT IS IMPORTANT TO NOTE that on the daily chart ZM formed a golden-cross, when the 50 EMA crosses over the 200 EMA, which is a bullish indicator in itself.
ZM in ascending channelLooks like ZM found itself a channel. 400 breakout failed last week. It will probably retest the lower trend line around 369. Long if it holds the support.
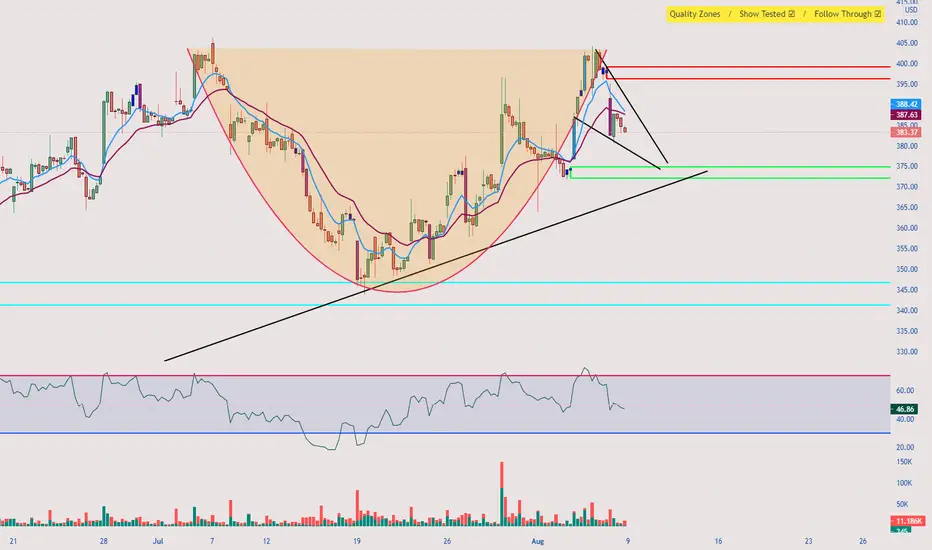
$ZM - CUP & Handle formation$ZM - CUP & Handle formation , watch for bounce at 375 & breakout for 400 calls
ZM looks amazing for augustZM stop loss under 375 otherwise riding it long to 450+, over 404 not a lot of resistance, needs to get momentum next week
ZM Analysis Short I am expecting ZM to go short to my support zone then look for a buy at my support zone
ready to break the resistance?Zoom is doing good after the breakout.
There is some resistance now, can we break through for a next wave up?