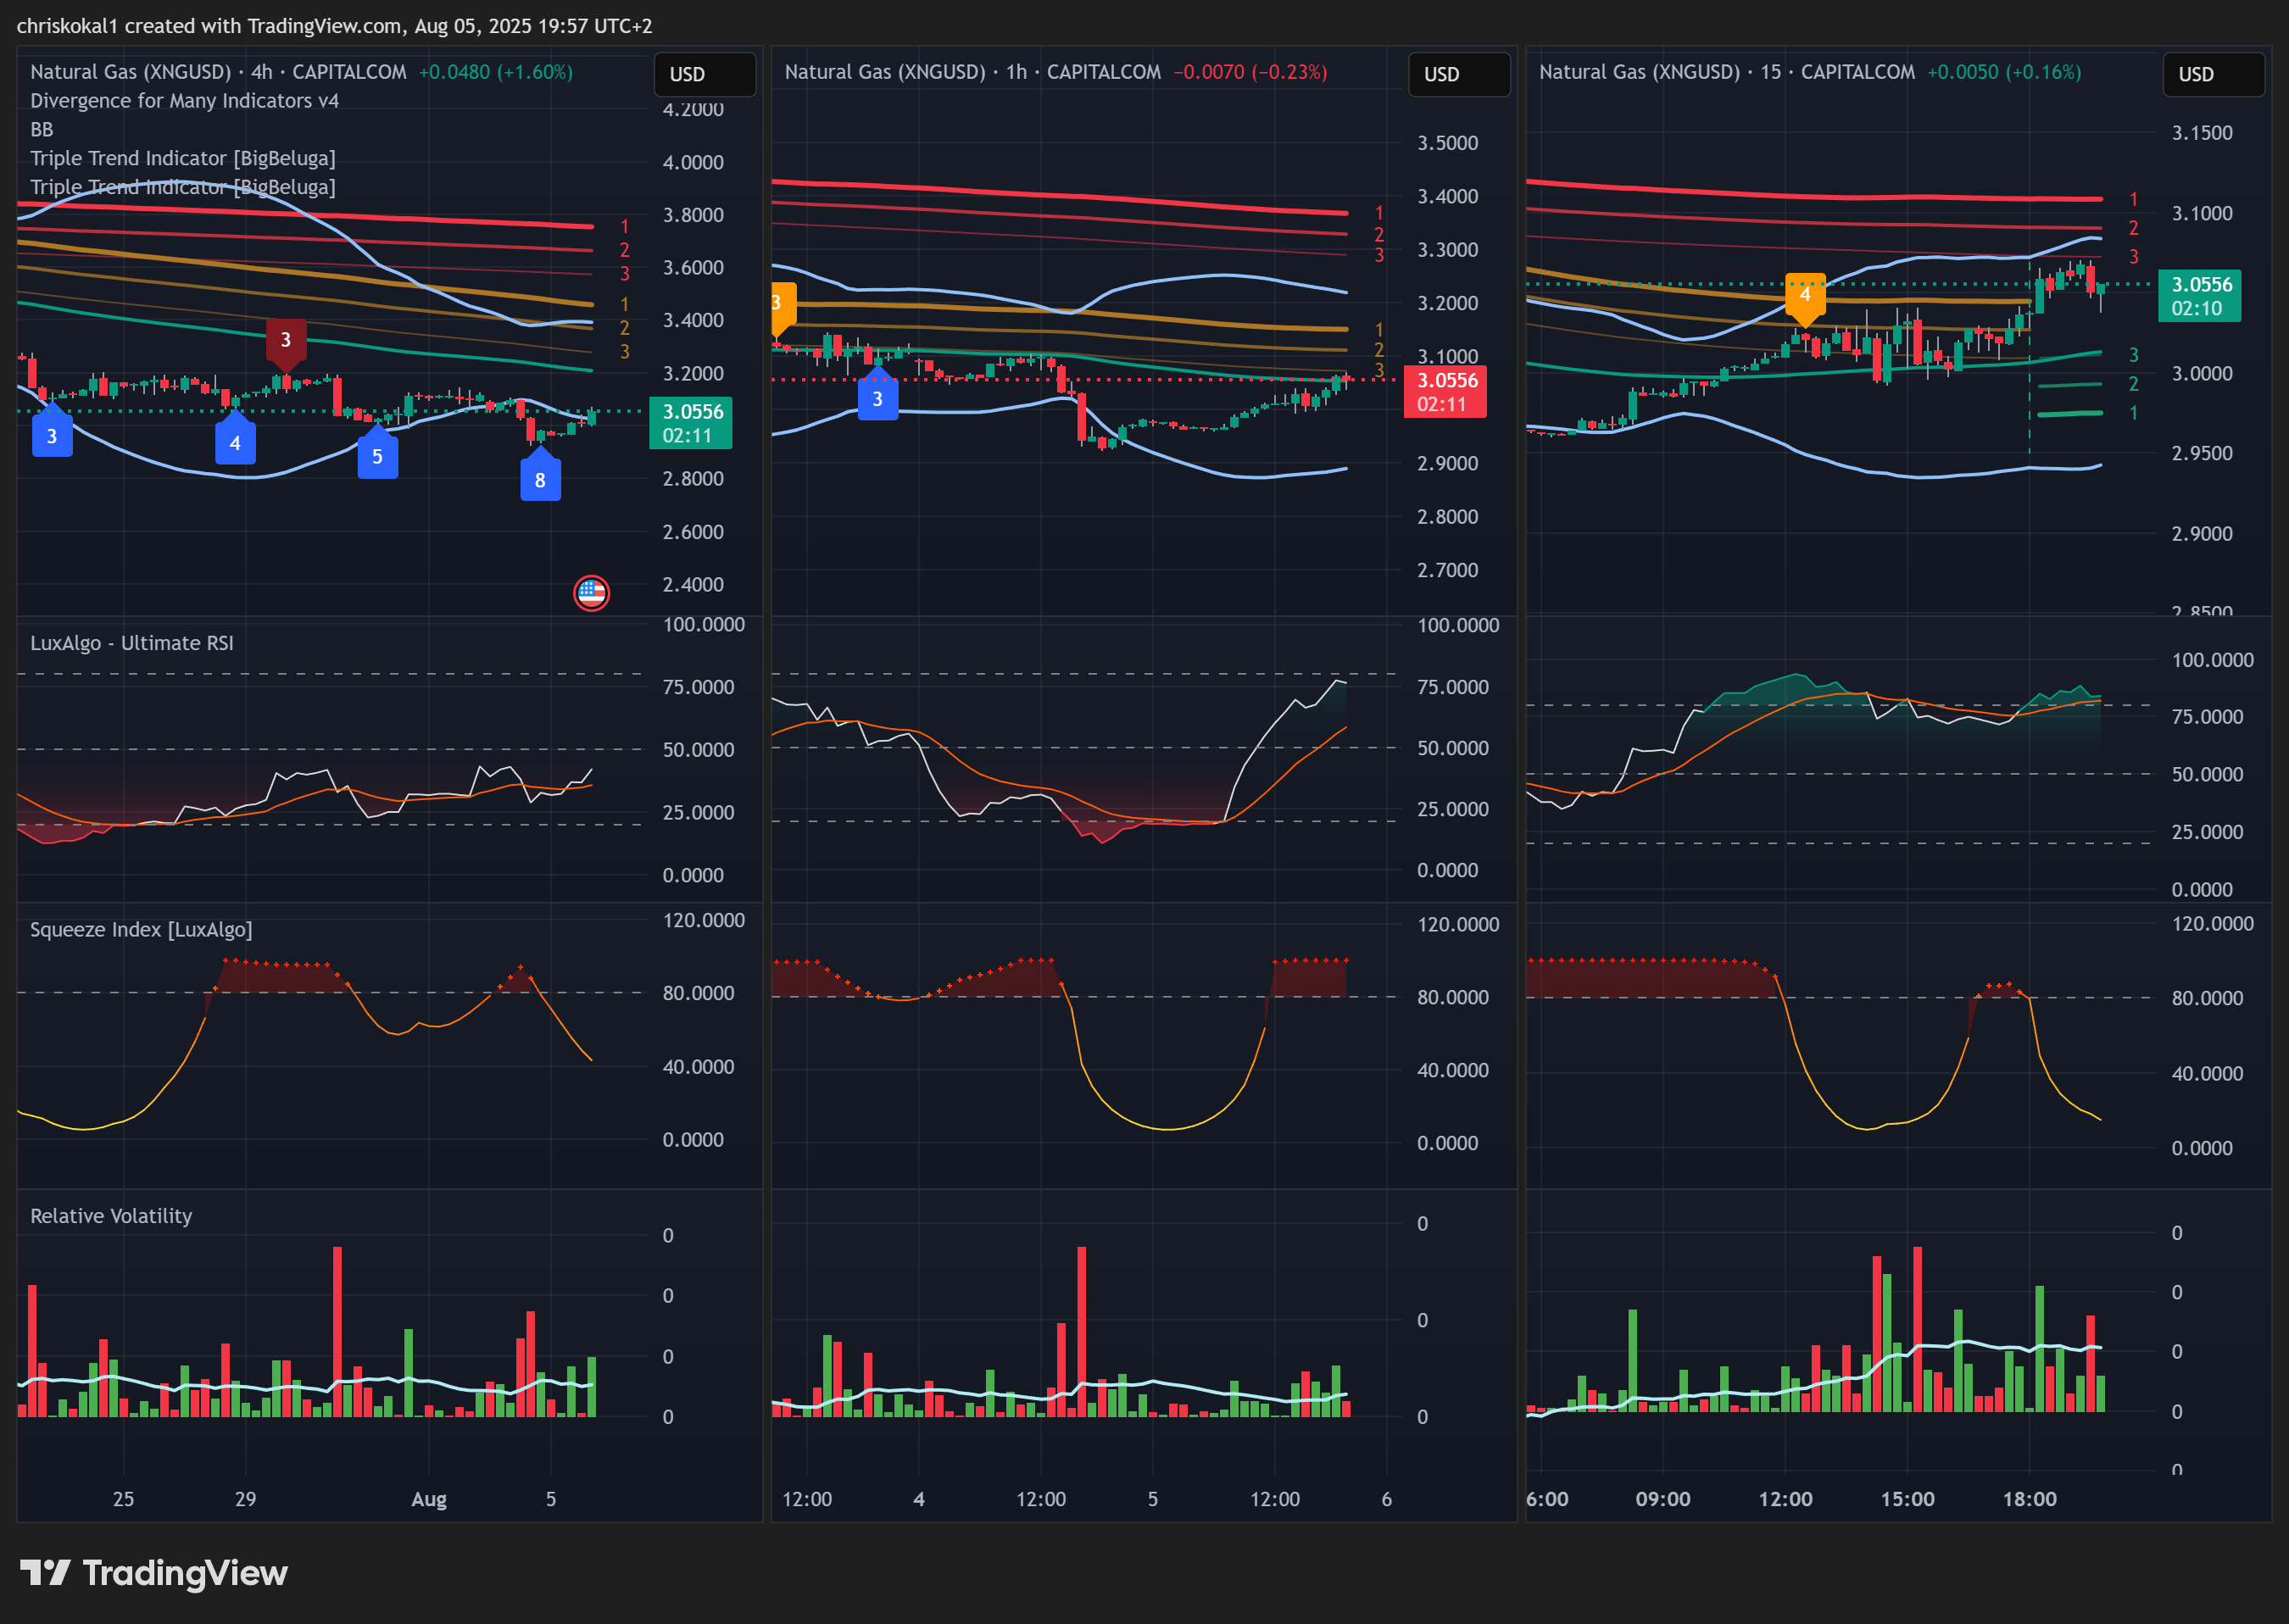
Triple trend indicator [BigBeluga] applied twice using WMA (length 200, 800) to capture fast vs slow technical trend.
Ultimate RSI [LuxAlgo] for OB/OS zone detection and momentum/ market sentiment)
Squeeze Index [LuxAlgo] to identify times of low volatility vs high volatily (the idea being that the movement occurring during low volatility is BS manipulation scam to throw dump their crap on retail).
BB 50 length RMA to be used together with the squeeze indicator and the ultimate rsi in confirming overextended price (outside of BB) or squeeze (when BB are moving parallel).
Based on the above setup I'm using the 4h to determine overall market trend, 1h to determine possible trend for the day and then 15m for execution.
On 4h we have downtrend, with price overextended from BB and market sentiment upwards with squeeze expanding indicating likely further upwards momentum. BUT trend is down with dynamic resistance at 3.20 (50 RMA), followed by the wma 200 and 800 bands acting as dynamic resistance at 3.35, 3.46, 3.65, 3.75.
On 1h we have downtrend, with price pulling back from the overextension (previous swing low 2.92), momentum is up and squeeze is up. This based on the setup indicates manipulation move upwards with price crossing the 50 RMA which now is broken dynamic resistance/acting support (if this thing gets clearly rejected, more downtrend is likely to follow) with dynamic resistance at 3.10, 3.15, 3.32, 3.37.
On 15m we have price overextended into a recently made uptrend with support at 3.01-2.97 and dynamic resistance at 3.09, 3.10. Momentum is up (overbought) and squeeze is exhausted.
Given the above, only short term trend is bullish and everything else appears bearish, so I will be using the 1h to time a short scalp. I'm looking for squeeze to remain active at 1h with ultimate rsi indicating bearish divergence with price near the resistance area of the fast band 3.11-3.14. If we get a bearish engulfing candle at 1h sometime tomorrow during peak volume hours - this will be my queue to enter short with SL 3.22 (top of BB) and TP 2.89 bottom of BB. An outright dump and breakdown of the recent dynamic support 2.97 would also indicate short entry for downtrend continuation.
If price keeps pushing higher making higher highs as the squeeze is broken then this will be most likely a pump invalidating the short setup and in order to enter long I will have to wait for a new squeeze to appear at 1h and check market conditions (pullback entry).
It's been a tough week getting caught on longs at 3.12 only to see it fake out and break below, but here we are and since there's no 100% accurate analysis - the most important aspect is risk management, SL/TP and limit pot exposure.
Good luck everyone!
PS: quick update, honourable mention Relative Volatility by veryfid to compare if the actual candle has enough volume/mass compared to the previous ones and Divergence for Many Indicators v4 by LonesoneTheBlue to have a quick evaluation of divergencies across 10 different and unique indicators (source for pivot points set to high/low).