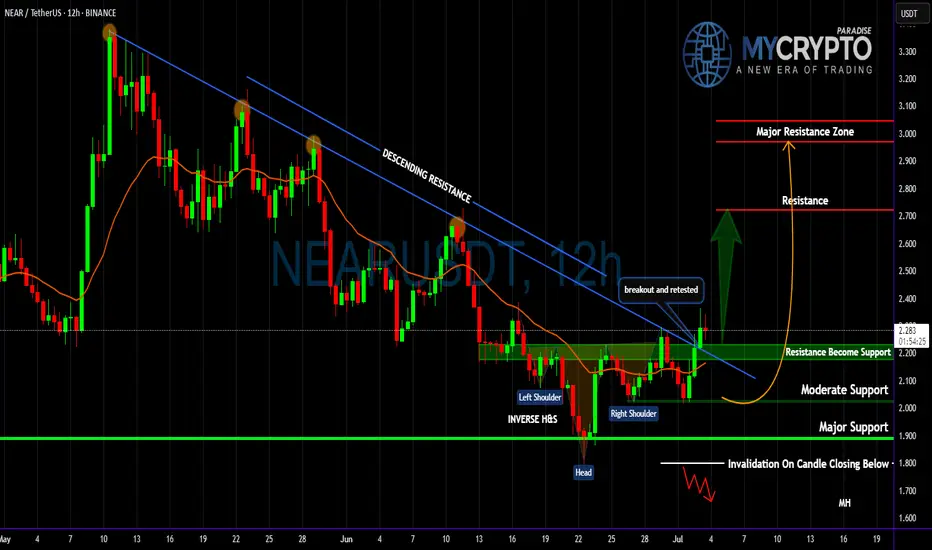
NEAR Breakout Confirmed—But Is This Just a Bull Trap?Yello Paradisers! Did you see that breakout on #NEARUSDT? After weeks of consistent lower highs and a clearly defined descending resistance, price action has finally snapped that bearish structure and completed a textbook inverse Head and Shoulders formation on the 12H chart. This kind of pattern do
Related pairs
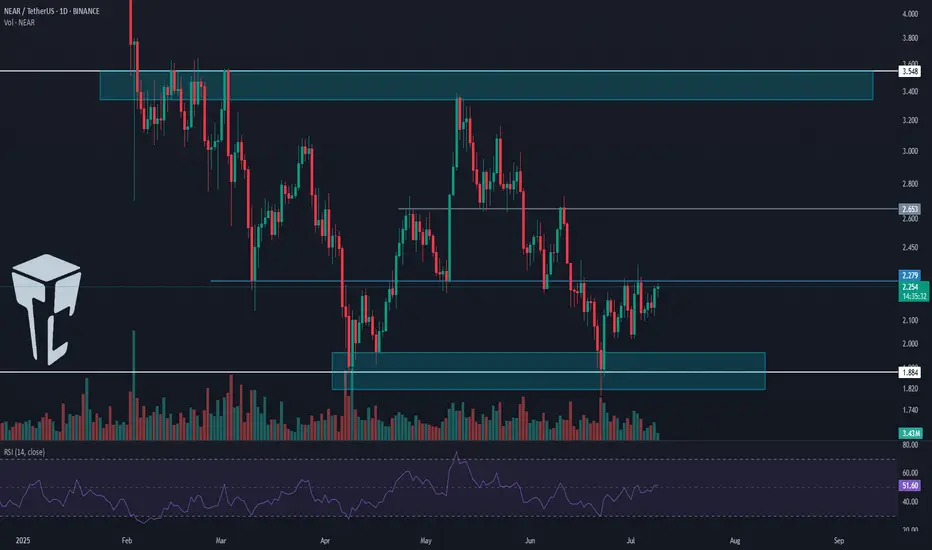
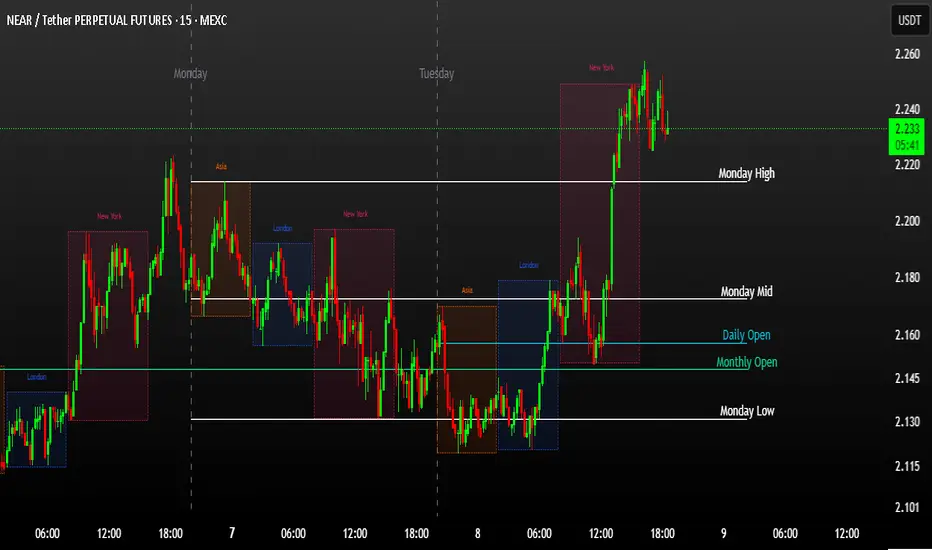
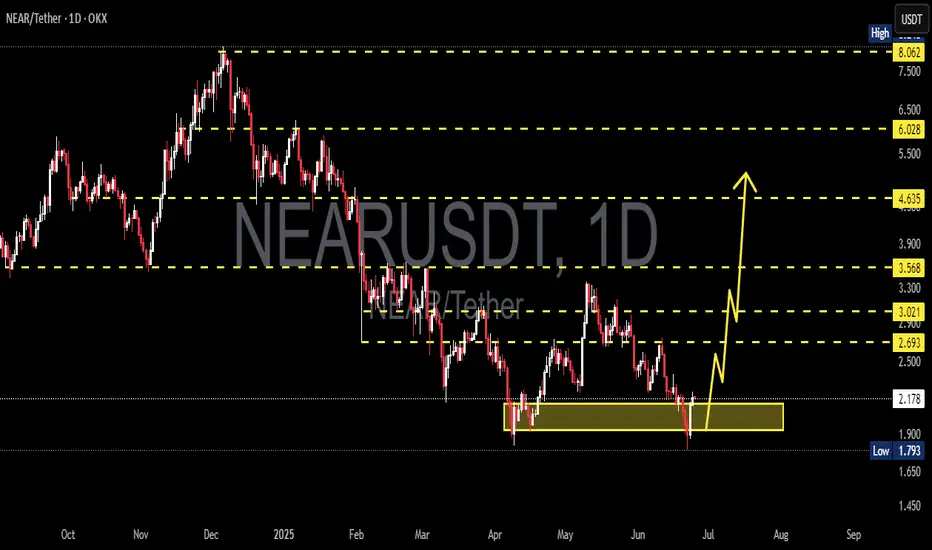
TradeCityPro | NEAR Faces Resistance in Lower Range Zone👋 Welcome to TradeCity Pro!
In this analysis, I’m going to review NEAR, one of the AI and Layer1 crypto projects, currently ranked 35 on CoinMarketCap with a market cap of 2.77 billion dollars.
📅 Daily Timeframe
On the daily chart, NEAR has formed a large ranging box between the 1.884 and 3.548 lev
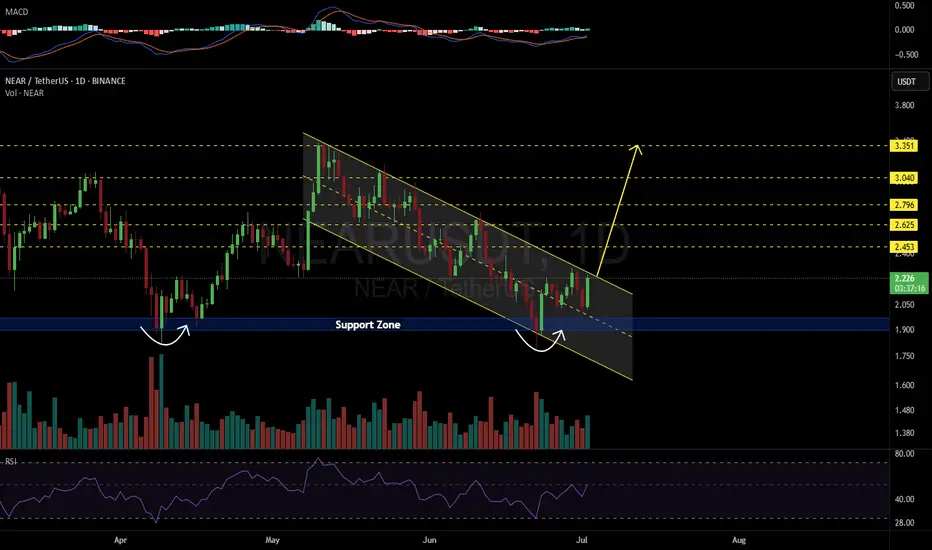
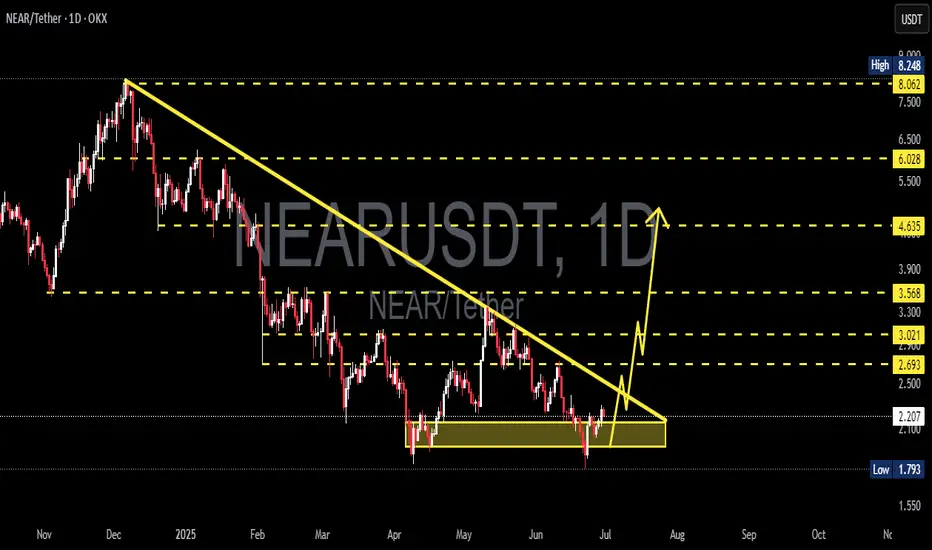
NEARUSDT 1D#NEAR is trading inside a descending channel on the daily chart and has recently bounced off a strong support zone.
It’s now on the verge of breaking above the channel resistance.
If a breakout occurs, the next targets are:
🎯 $2.453
🎯 $2.625
🎯 $2.796
🎯 $3.040
🎯 $3.351
⚠️ As always, use a tight st
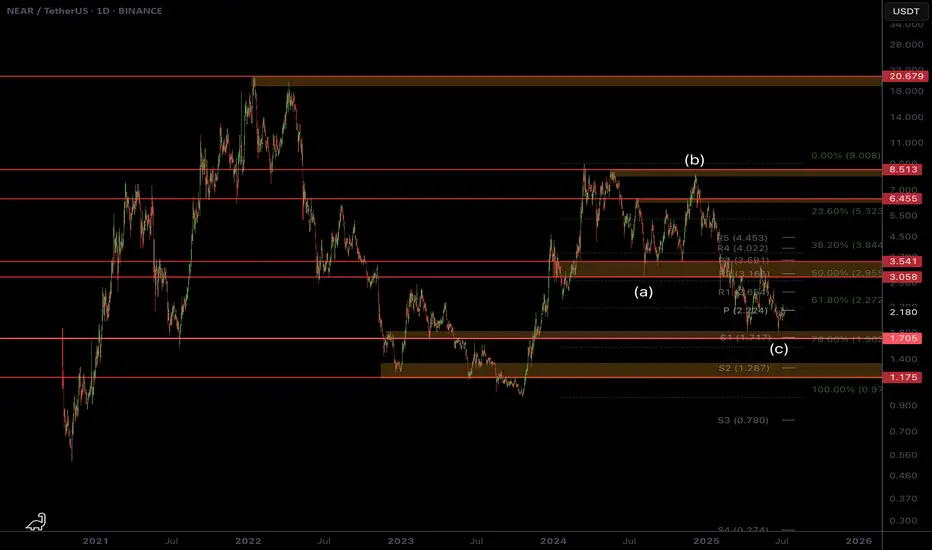
$NEAR Disappointing so far...CBOE:NEAR is disappointing me as it continues towards the lows
Testing the .786 alt-coin golden pocket High Volume Node so should see a decent reaction from here as it appears a an ABC correction is complete after an Elliot wave motif wave.
Safe trading
near chart analysisbreif discuss the chart of near upcoming potential might be pump from here heavliy
$NEAR Approaching Breakout from 54D Trendline!CBOE:NEAR
In the LTF, CBOE:NEAR is sitting at the 0.5 Fib retracement level.
Which is a pretty good level to buy.
We have a 54D long descending trendline resistance, which we need to break out of.
IMO, we will break this trendline soon, so keep an eye on it.
We have strong support at the $1.

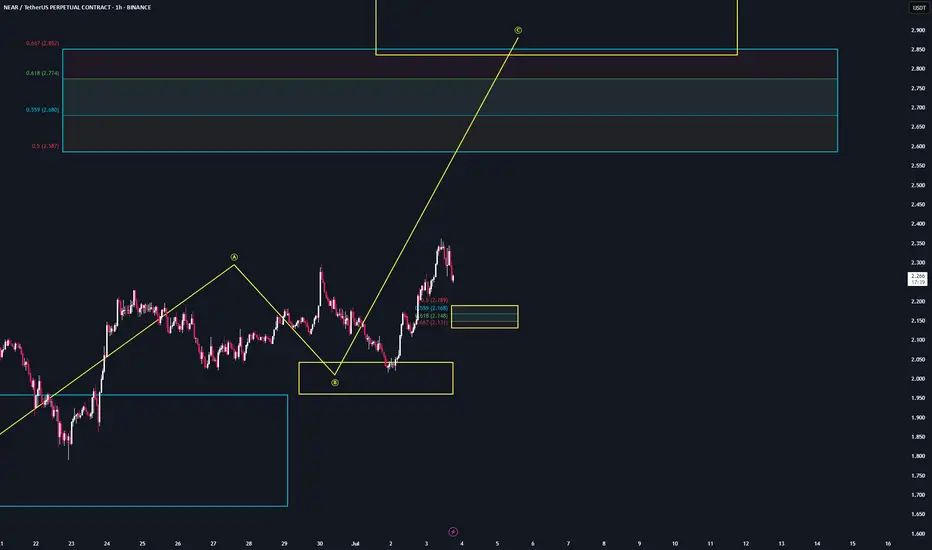
NEAR | Trade Setup📌 After the reaction from the bearish target zones (blue), we've now activated a bullish sequence (yellow) in $Near.
📊 Valid entries are currently forming during a potential B-C correction.
Trademanagement:
I'm placing long orders at each level.
Once the trade reaches a 2 R/R, I’ll move the stop-
NEARUSDT Breakout Watch Descending Triangle Reversal in Progress🧠 Pattern and Structure Analysis
The NEAR/USDT pair is currently displaying a long-term Descending Triangle pattern that has been developing for over 6 months. While descending triangles are typically bearish continuation patterns, a breakout to the upside often signals a strong trend reversal.
De
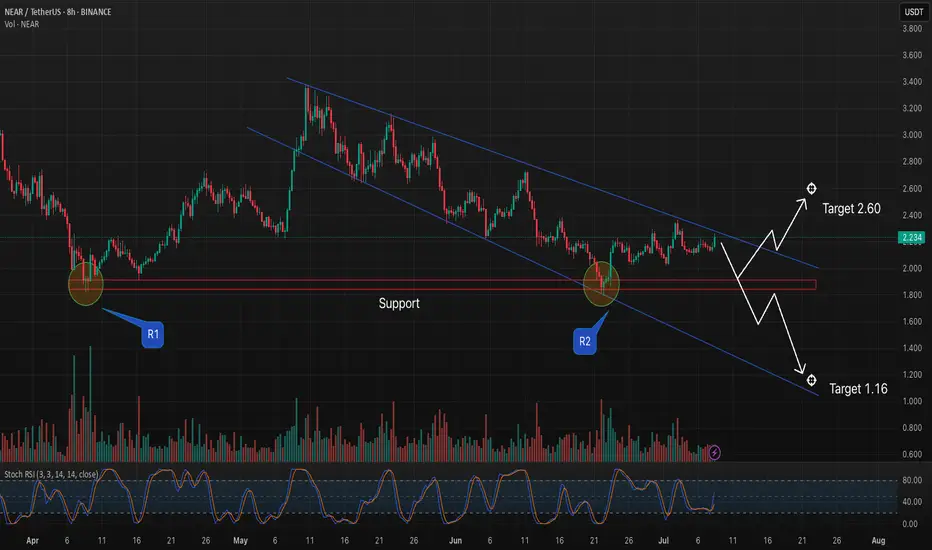
NEARUS 8H – Testing Key Resistance Inside Falling Channel🔍 Chart Overview:
NEAR has been trading inside a well-defined falling channel since mid-May. Price has consistently respected both the upper and lower trendlines, confirming this as a dominant structure.
🔵 Key Zones:
Support Zone (~$1.85–$1.95): Multiple bounce reactions (R1 in April & R2 in June)
NEARUSDT 1D AnalysisNEAR ~ 1D Analysis
#NEAR Buy back on retest of this support block with short term target of at least 15%+ from here.
See all ideas
Summarizing what the indicators are suggesting.
Oscillators
Neutral
SellBuy
Strong sellStrong buy
Strong sellSellNeutralBuyStrong buy
Oscillators
Neutral
SellBuy
Strong sellStrong buy
Strong sellSellNeutralBuyStrong buy
Summary
Neutral
SellBuy
Strong sellStrong buy
Strong sellSellNeutralBuyStrong buy
Summary
Neutral
SellBuy
Strong sellStrong buy
Strong sellSellNeutralBuyStrong buy
Summary
Neutral
SellBuy
Strong sellStrong buy
Strong sellSellNeutralBuyStrong buy
Moving Averages
Neutral
SellBuy
Strong sellStrong buy
Strong sellSellNeutralBuyStrong buy
Moving Averages
Neutral
SellBuy
Strong sellStrong buy
Strong sellSellNeutralBuyStrong buy
Displays a symbol's price movements over previous years to identify recurring trends.
Curated watchlists where NEARUSDT.3L is featured.

Gen 3 crypto: A new day dawns…
25 No. of Symbols

Smart contracts: Make the smart decision
36 No. of Symbols
See all sparks
Frequently Asked Questions
The current price of NEAR 3x Long / Tether (NEAR) is 3.28880000 USDT — it has risen 10.70% in the past 24 hours. Try placing this info into the context by checking out what coins are also gaining and losing at the moment and seeing NEAR price chart.
NEAR 3x Long / Tether price has risen by 6.22% over the last week, its month performance shows a −42.52% decrease, and as for the last year, NEAR 3x Long / Tether has increased by 12.47 K%. See more dynamics on NEAR price chart.
Keep track of coins' changes with our Crypto Coins Heatmap.
Keep track of coins' changes with our Crypto Coins Heatmap.
NEAR 3x Long / Tether (NEAR) reached its highest price on Nov 12, 2021 — it amounted to 16.03460000 USDT. Find more insights on the NEAR price chart.
See the list of crypto gainers and choose what best fits your strategy.
See the list of crypto gainers and choose what best fits your strategy.
NEAR 3x Long / Tether (NEAR) reached the lowest price of 0.00001270 USDT on Dec 30, 2022. View more NEAR 3x Long / Tether dynamics on the price chart.
See the list of crypto losers to find unexpected opportunities.
See the list of crypto losers to find unexpected opportunities.
The safest choice when buying NEAR is to go to a well-known crypto exchange. Some of the popular names are Binance, Coinbase, Kraken. But you'll have to find a reliable broker and create an account first. You can trade NEAR right from TradingView charts — just choose a broker and connect to your account.
Crypto markets are famous for their volatility, so one should study all the available stats before adding crypto assets to their portfolio. Very often it's technical analysis that comes in handy. We prepared technical ratings for NEAR 3x Long / Tether (NEAR): today its technical analysis shows the strong buy signal, and according to the 1 week rating NEAR shows the strong buy signal. And you'd better dig deeper and study 1 month rating too — it's strong buy. Find inspiration in NEAR 3x Long / Tether trading ideas and keep track of what's moving crypto markets with our crypto news feed.
NEAR 3x Long / Tether (NEAR) is just as reliable as any other crypto asset — this corner of the world market is highly volatile. Today, for instance, NEAR 3x Long / Tether is estimated as 11.20 M% volatile. The only thing it means is that you must prepare and examine all available information before making a decision. And if you're not sure about NEAR 3x Long / Tether, you can find more inspiration in our curated watchlists.
You can discuss NEAR 3x Long / Tether (NEAR) with other users in our public chats, Minds or in the comments to Ideas.