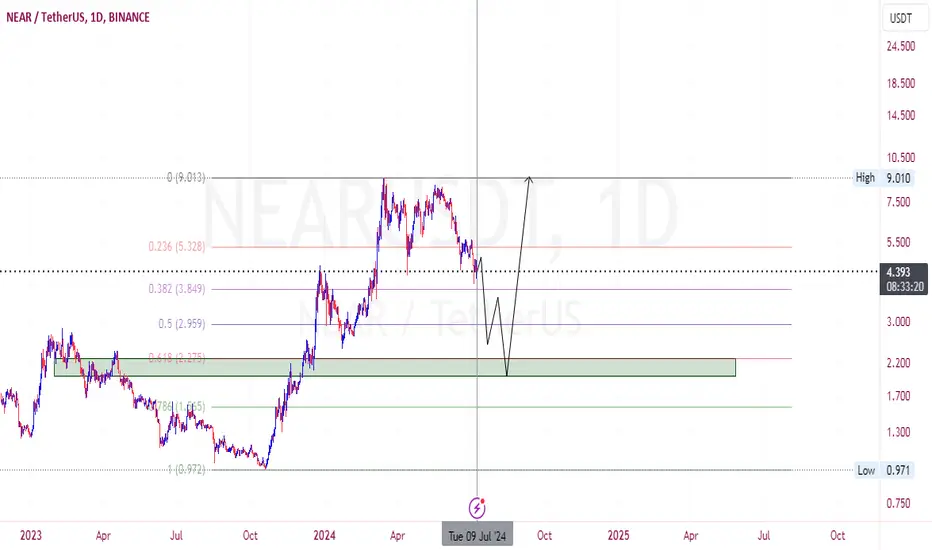
NEARUSDT LONG MONTHLY TIMEFRAME-Great reaction on the sweep of the range low with monthly and weekly 10 and 21 emas still holding and didn't cross bullish
- You can place stop below last low but I'm taking the conservative approach and will only liquidate if there is weekly close below monthly demand and 0.3 fib main support.
- Target is new all time high
- Trade can take a long time since it's the monthly time frame, from here till the monthly demand and 0.3 is the buy area
NEARUSDT.3L trade ideas

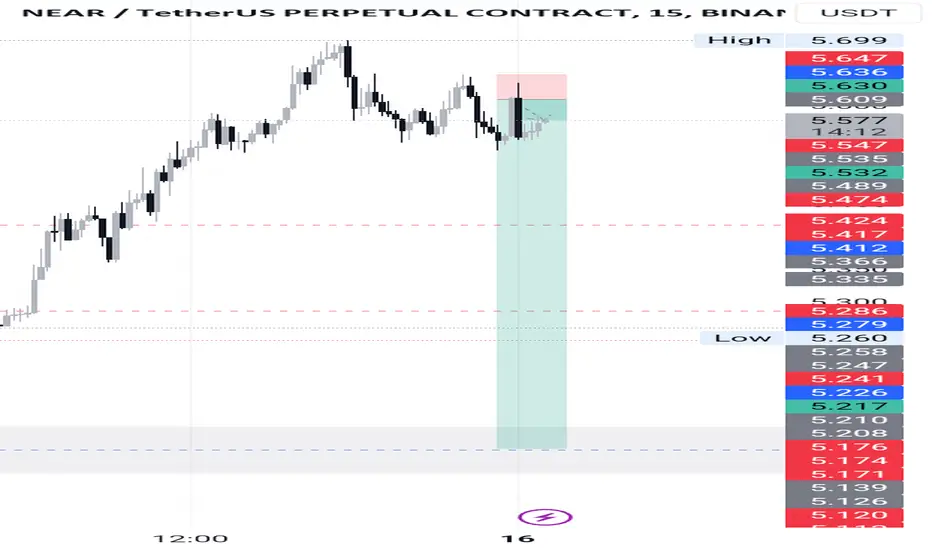
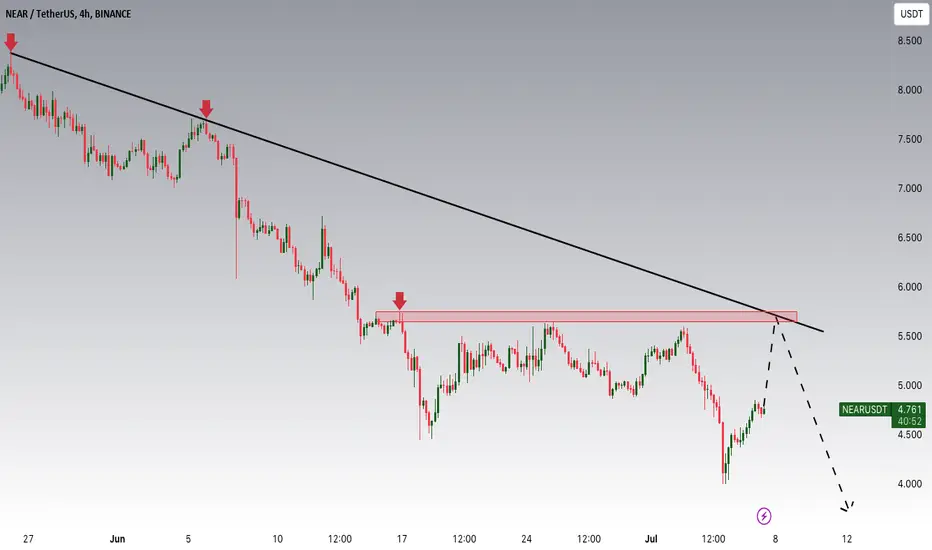
Near - 4$ bounce play4$ would give a nice entry for a proper bounce trade. Could take a few more days to get there, maybe next week, but I will patiently wait for this setup. Not sure how high its going to bounce, might take profits after 50%, it could go a bit higher but I will leave the rest for the gamblers and FOMO plebs. ;-)
Stay safe!

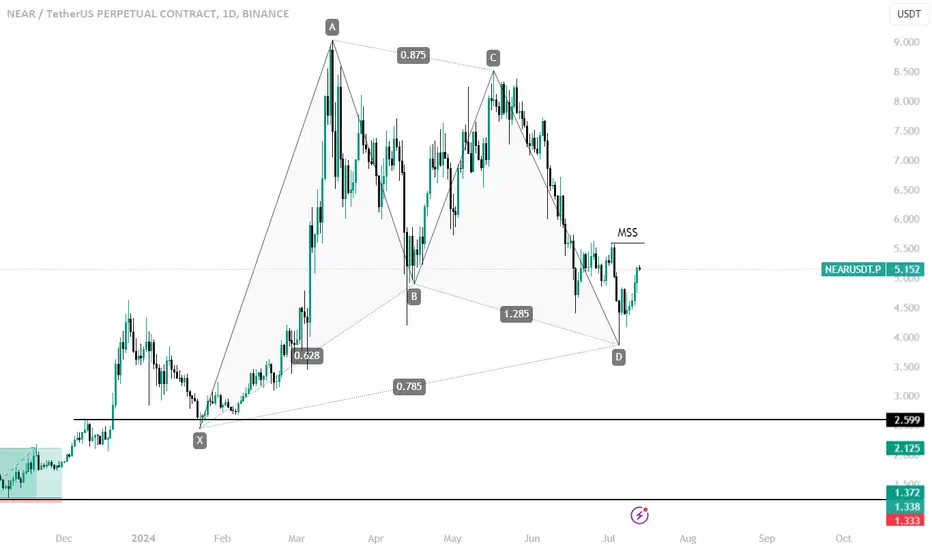
Potential Short Position NEAR/USDT on the daily timeframe highlights the Wyckoff phases A, B, and C, indicating a potential short position setup. In Phase A, there is a break of structure (BOS) followed by a sign of weakness (SOW), suggesting initial bearish pressure. Phase B shows multiple tests of resistance and support levels, forming lower highs (CHoCH) and lower lows, signaling further consolidation and distribution.
In Phase C, the final sign of weakness (LPSY) is evident as the upward trendline is broken, leading to a sharp decline in price towards lower support levels. The target price is set at 4.459 USDT, with a risk/reward ratio of 3.4. Key price levels include 6.029 USDT and 4.813 USDT, with a strong support zone around 2.670 USDT, making this a compelling short position opportunity.

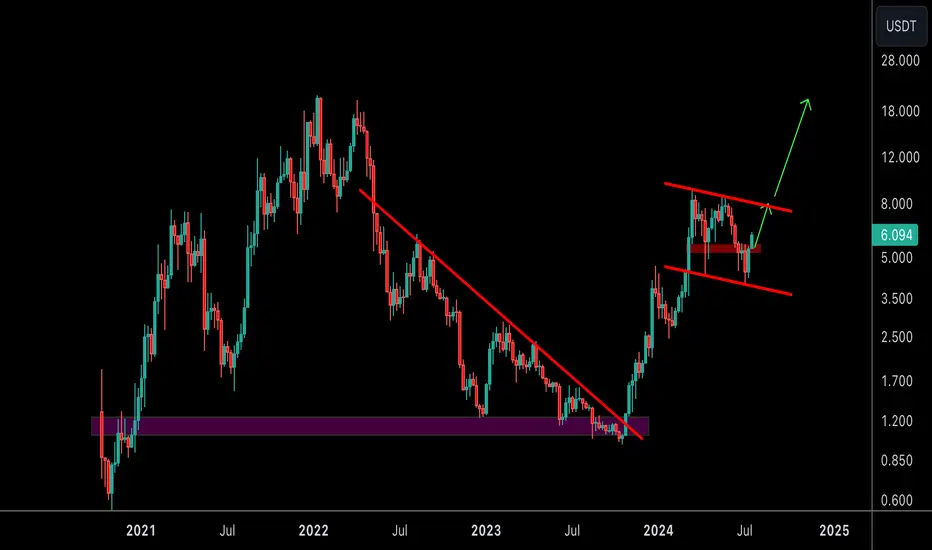
NEAR bullflag on weekly TFNEAR / USDT
Near was a strong coin in bullmarket months
Currently its showing strength with bullflag in weekly TF suggesting more bullish potential in coming weeks
Best of wishes
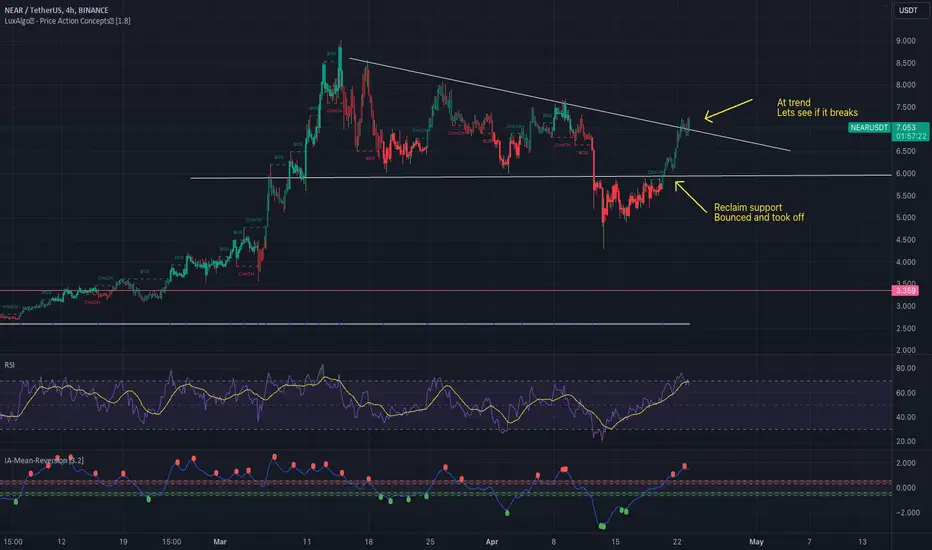
Is NEARUSDT About to Skyrocket? Critical Levels You Can't Miss!Yello, Paradisers! Have you been keeping an eye on #NEARUSDT lately? If not, now's the time to pay attention.
💎#NEARUSDT is currently trading within a demand zone, raising the high probability of a bullish move. The token has been following a descending resistance trajectory for a while. Now, it's showing strong momentum within this demand zone. If #NEARPROTOCOL continues to sustain this momentum, it may target the key resistance level at $5.624.
💎If #NEARUSD reaches $5.624, we could see a potential rejection at this resistance level. In this scenario, we'll wait for the price to retest the descending resistance. A successful retest would confirm a strong bullish move. Sustained upward momentum could lead to a breakthrough above $5.624, marking a significant bullish shift.
💎However, what if AMEX:NEAR loses momentum and drops below the previous low? This would invalidate the bullish outlook, potentially leading to a significant price drop.
Stick to your strategy and keep mastering your willpower. Be the 20% that outperforms the rest!
MyCryptoParadise
iFeel the success🌴

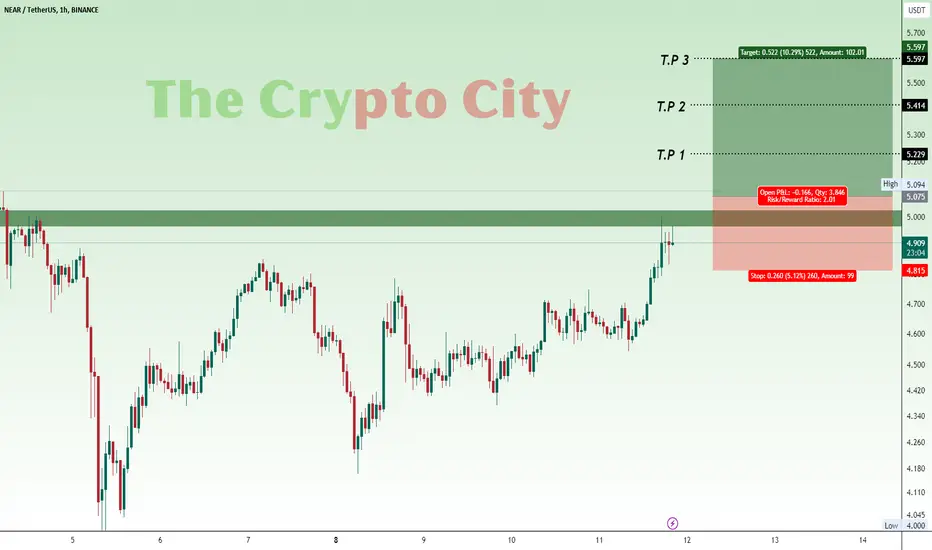
NEAR USDTNEAR/USDT Setup. After a confirmed breakout from the marked zone in green, we could take an entry at 5.075
Remember stop loss is your friend. Everything is on the chart.
Entry 5.075
S.L 4.815
T.P 1 5.229
T.P 2 5.414
T.P 3 5.597
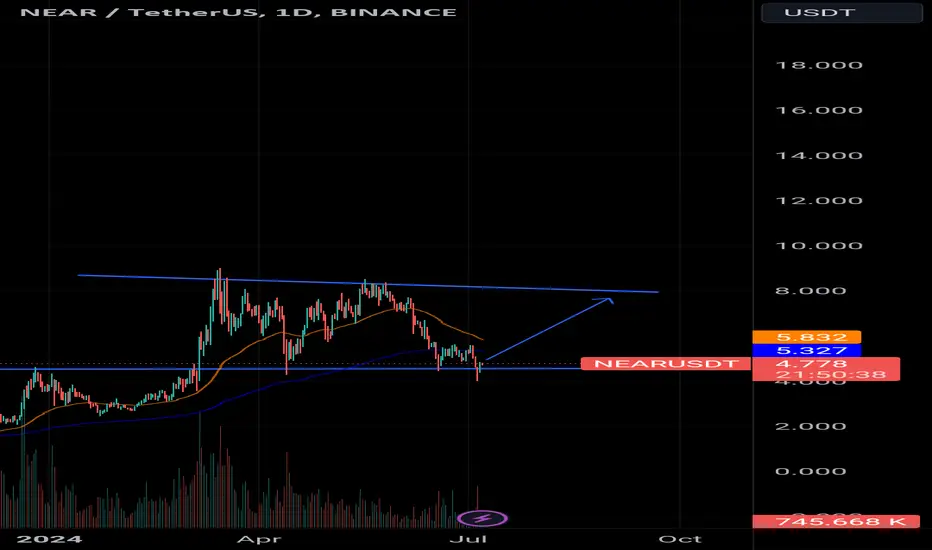
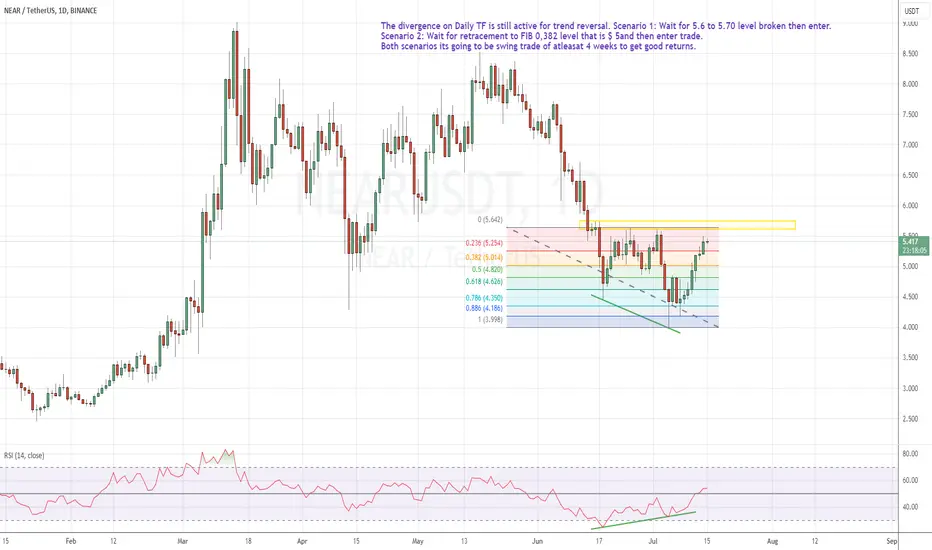
Near/USDT Reversal ContinueNear Protocol looks to be bottomed out and now reversing from low of 4 in the first week of July now its at 5.43. Its going to be a swing trade and may go up to recent high of 9$ that was in March this year. But huge potential considering BTC is also reversing so are all crypto currencies.

NEARUSDT TREND REVERSALNear Protocol looks to be bottomed out and now reversing from low of 4 in the first week of July now its at 5.43. Its going to be a swing trade and may go up to recent high of 9$ that was in March this year. But huge potential considering BTC is also reversing so are all crypto currencies.

Unlocking Hidden Potential: NEAR Technical AnalysisNEAR Technical Analysis
The price has been following a descending trend line(Red) and recently found a major support zone(Yellow) at $4.18 – $4.295. The dotted line at 4.441 is also acting as a good support. After touching this support, the price has bounced back and is currently testing the trend line.
The key resistance zone(Green) is identified around the $5.586 – $5.743, which has acted as a strong resistance zone in the past. The price has struggled to break above this zone multiple times, suggesting it is a significant level to watch.
Potential scenarios
Bullish Scenario
If the price breaks above the descending trend line it could move towards the resistance zone in Green at $5.586 – $5.743.This green zone is major resistance to moving the price upwards. After a breakout from this zone, the price could move toward the next resistance zone in Blue at $6.675 – $6.897.A breakout above this level could indicate a reversal of the downtrend and a possible continuation to higher levels.
Consolidation Scenario
If the price gets rejected at the descending trend line or the resistance zone in Green, it might consolidate between $4.441 and the Green zone. This consolidation phase could last until the market decides on the next significant move. Price could also take support at the Yellow zone and from there it will bounce back according to our analysis.
Bearish Scenario
If the price fails to sustain above the current support level of $4.441, it could lead to a further decline towards the yellow zone at $4.148 – $4.295. If this Yellow zone fails to hold the price then, this would indicate a continuation of the bearish trend.
Volume is also a critical factor to monitor. Increased volume on a breakout above the resistance levels could confirm the bullish scenario, while low volume might indicate a lack of conviction among traders.
NEAR/USDT is at a critical juncture, with key resistance and support levels that will likely dictate the next major move. Traders should watch these levels closely and consider volume trends to gauge market sentiment.

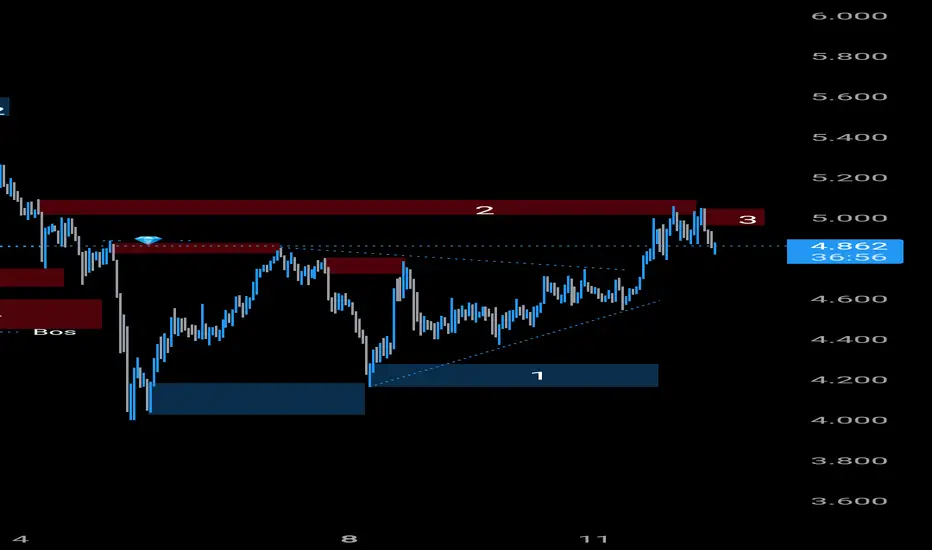
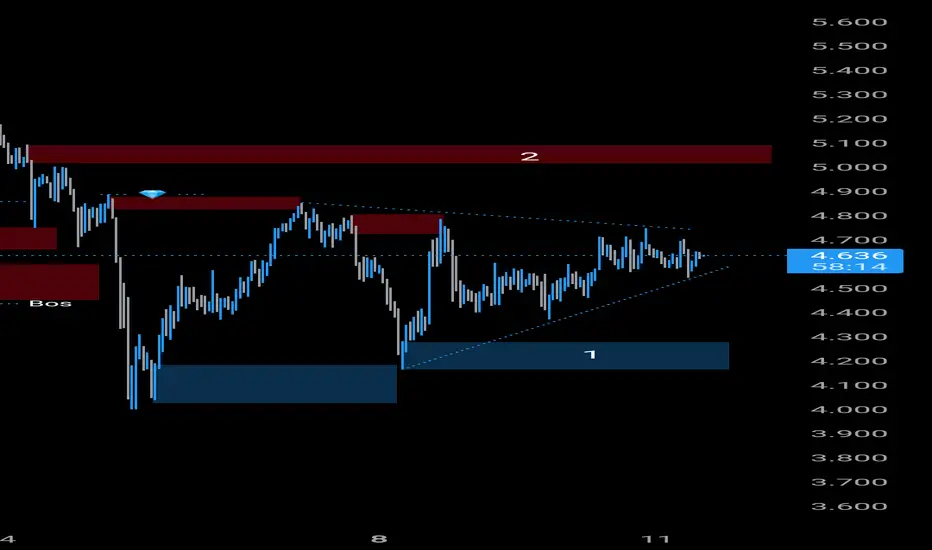
NEARNEAR breakout symmetric triangle up side and moved up. Mitigated this orderblock (2) and moved down. Order block (3) is next resistance zone. If this zone was fail, NEAR moving up.
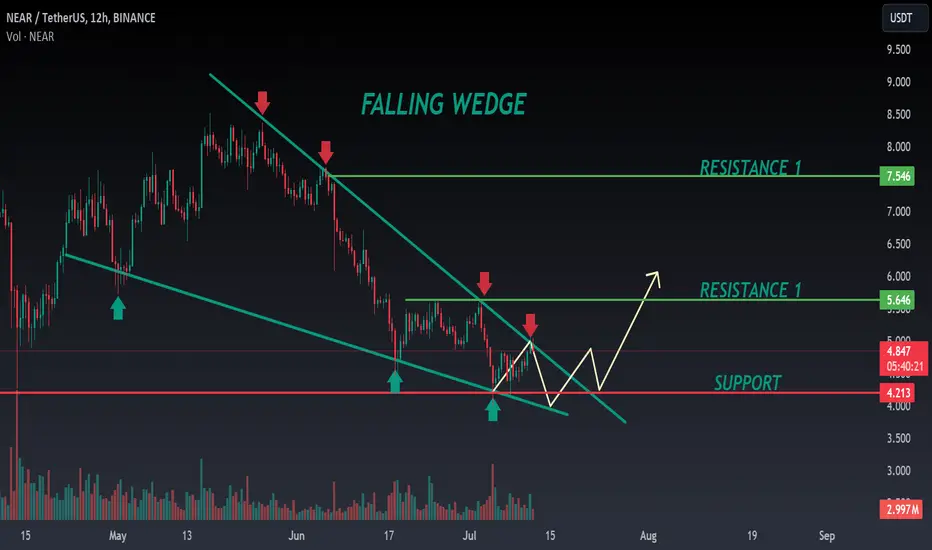
NEAR ANALYSIS🔮 #NEAR Analysis 🚀🚀
In 12hr timeframe, falling wedge pattern is forming ✅
Right now, #NEAR is around its descending trendline zone 🚀 🚀 if #NEAR breaks the pattern then we will be target for 50% in few weeks but before that there may be a small dump of 5-10% 💸 💯🚀
💸Current Price -- $4.836
📈Target Price -- $7.546
⁉️ What to do?
- We have marked crucial levels in the chart . We can trade according to the chart and make some profits. 🚀💸
#NEAR #Cryptocurrency #DYOR

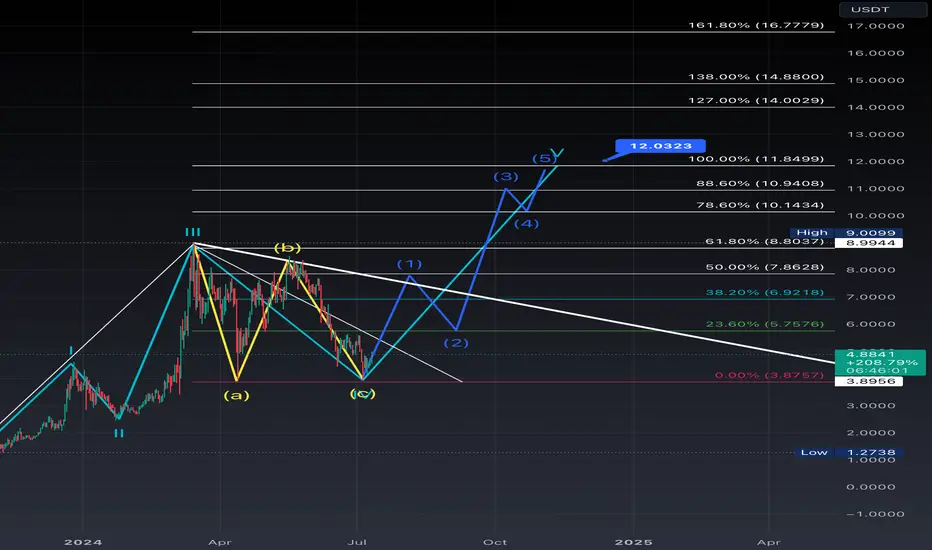
Near correction is completed well, Next targets 11$-20$I think the correction w.4 is completed, and the next bullish w.5 is going to be an extended wave due to the previous correction.
Main target, 11$-20$ previous resistance
NEAR1h time frame
Near is framing symetric triangle.
Recently broke out .
Good opportunity to long with stopp loss
#nfa #dyor
Sl🚨 is very important part of trading.
Thank you.

NEAR NEAR still bearish. But created symmetric Triangle pattern. If NEAR breakout up side, next orderblock (2) is resistance zone. Or breakout down side, Next orderblock (1) is support zone.
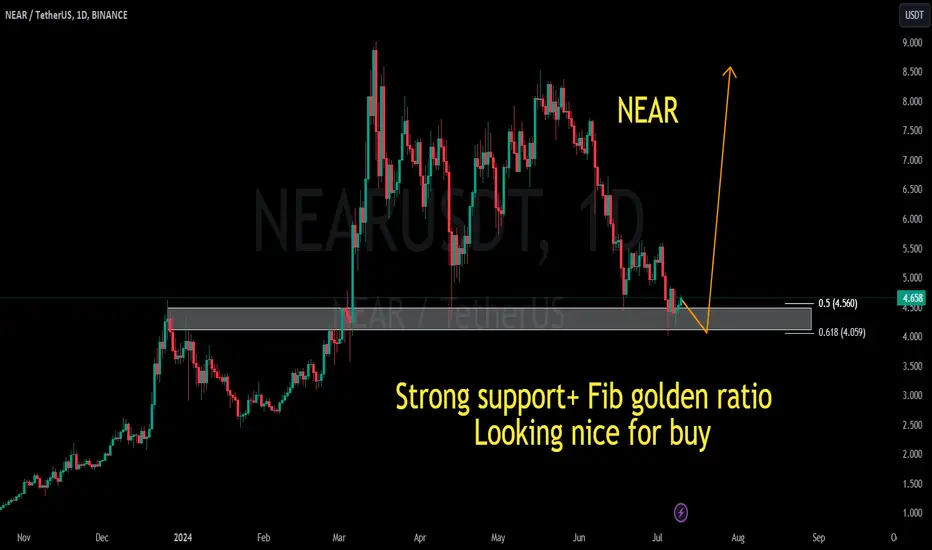
NEARUSDTNEARUSDT is at strong daily support level.
50% fib retracement putting strong confluence for buying.
Where is the right price to buy $NEAR?Considering the correction process that we have in mind for altcoins, we expect that AMEX:NEAR can reach the price range of 2$ or slightly below it again.
It seems that the price of 2$ can be a good place to buy, although there is a possibility that if there is a fear in the market that causes the prices to fall, the price will go lower due to excitement and fear selling. but 2$ seems a reasonable price.
I hope to have enough cash for when the price hits $2$.
NEAR is approaching an important resistanceHey Traders, in today's trading session we are monitoring NEARUSDT for a selling opportunity around 5.600 zone, NEARUSDT is trading in a downtrend and currently is in a correction phase in which it is approaching the trend at 5.600 support and resistance area.
Trade safe, Joe.
#NEAR/USDT Price hits critical support zone at $4.40 and bounci#NEAR/USDT
Price hits critical support zone at $4.40 and bouncing🧐
Now token may rise to $8.00, watch for trend confirmation📝