Bullish on NEAR/USDT𝗕𝘂𝗹𝗹𝗶𝘀𝗵 𝗦𝗰𝗲𝗻𝗮𝗿𝗶𝗼 📈
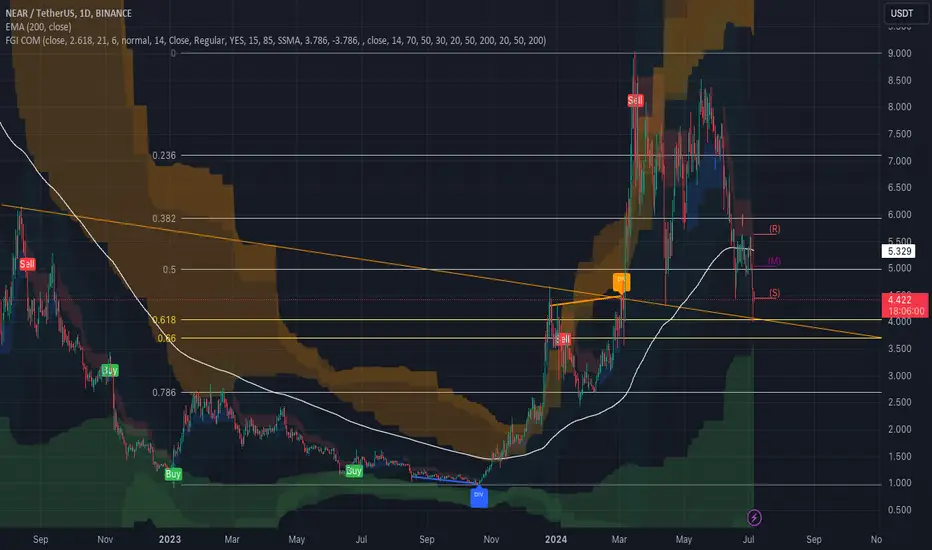
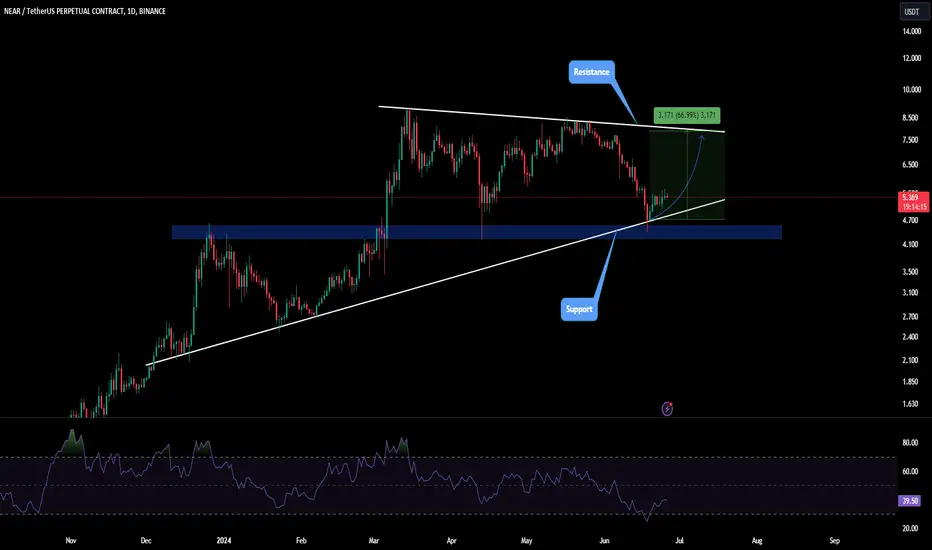
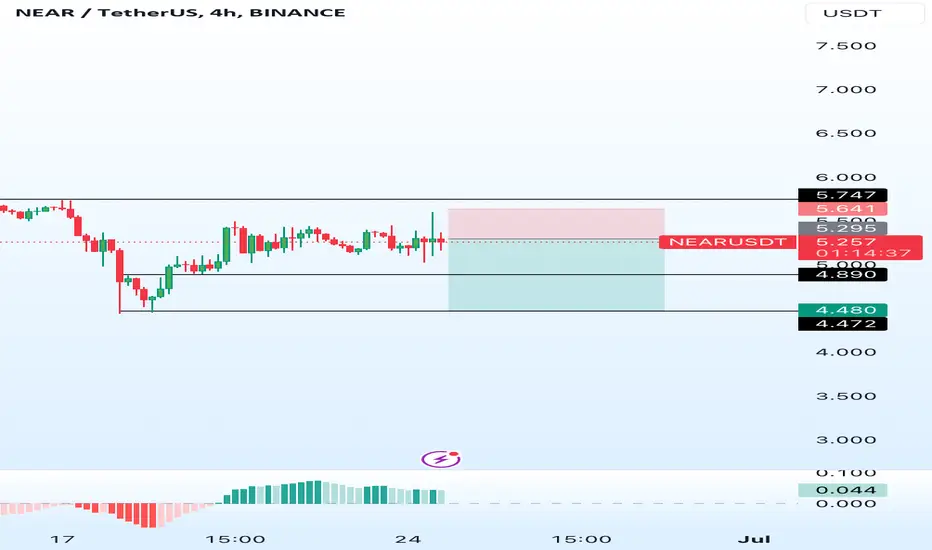
If the price breaks above the 200 EMA at $5.329 and clears the immediate resistance levels, we could see a move towards the $6.00 and $7.00 levels. Sustained buying pressure and positive market sentiment could push the price towards the upper Fibonacci levels.
𝗕𝗲𝗮𝗿𝗶𝘀𝗵 𝗦𝗰𝗲𝗻𝗮𝗿𝗶𝗼 📉
If the price fails to break above the 200 EMA and descends below the support at $4.428, it could test lower support levels around $3.50 and $3.00. Continued bearish sentiment and negative news could drive the price lower.
𝗖𝗼𝗻𝗰𝗹𝘂𝘀𝗶𝗼𝗻 📊
BINANCE:NEARUSDT
While the #NEAR USDT chart shows mixed signals, the bullish divergence and recent "Buy" signal provide a positive outlook. A confi SEED_ALEXDRAYM_SHORTINTEREST2:RMED breakout above the 200 EMA and the descending trendline would solidify the bullish case, targeting higher resistance levels.
NEARUSDT.3L trade ideas
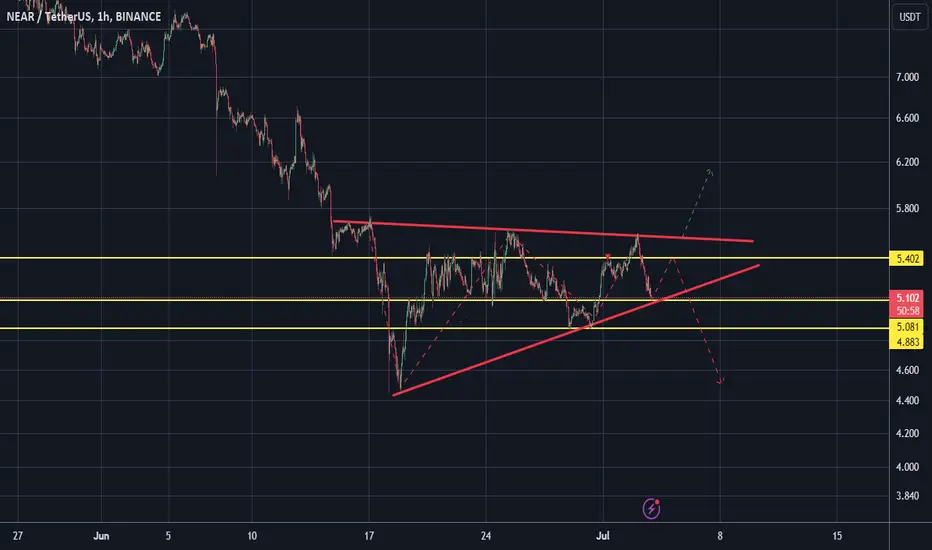
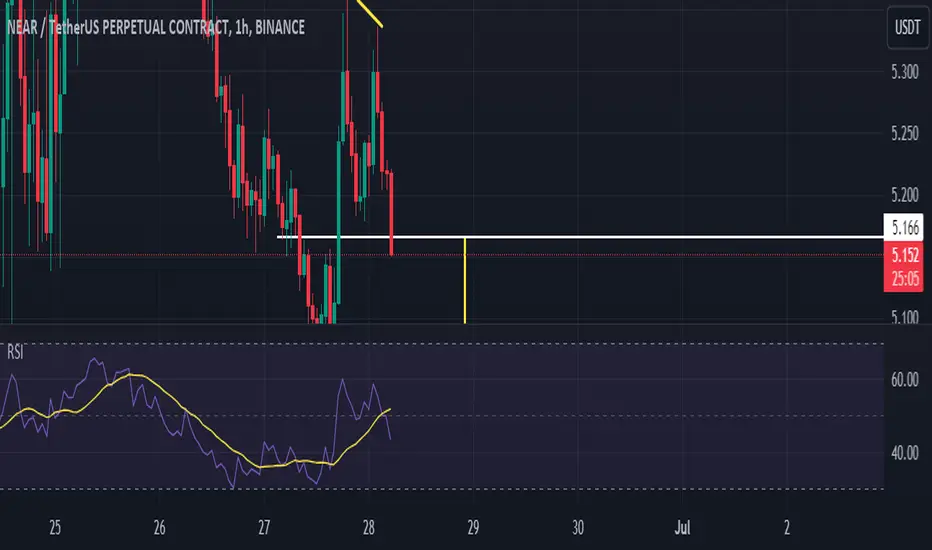
Near/Usdt 1Hwait for break and open position
60% break down Because price on the down trend
40% break Up
Update on daily trading plan BTC SOL TON NEARPlease view my Updated on daily trading plan for BTC SOL TON and NEAR

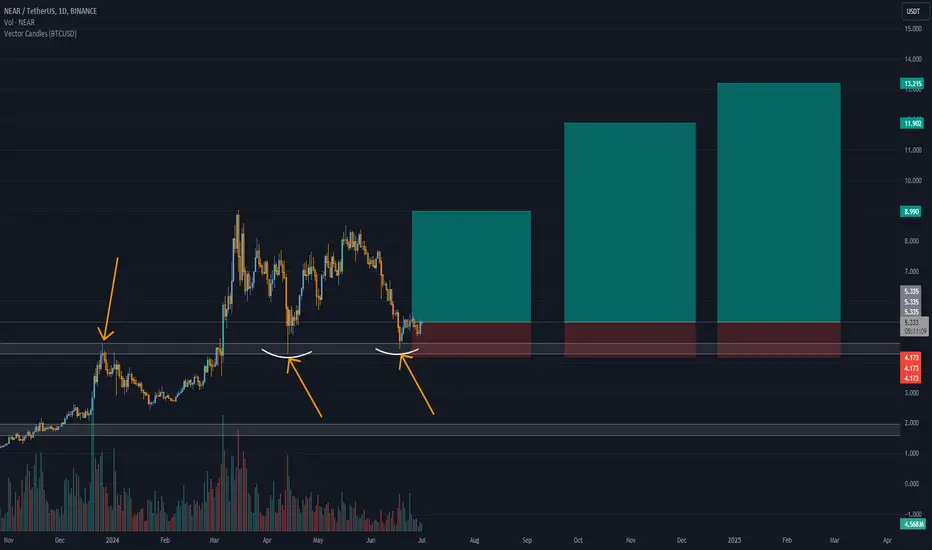
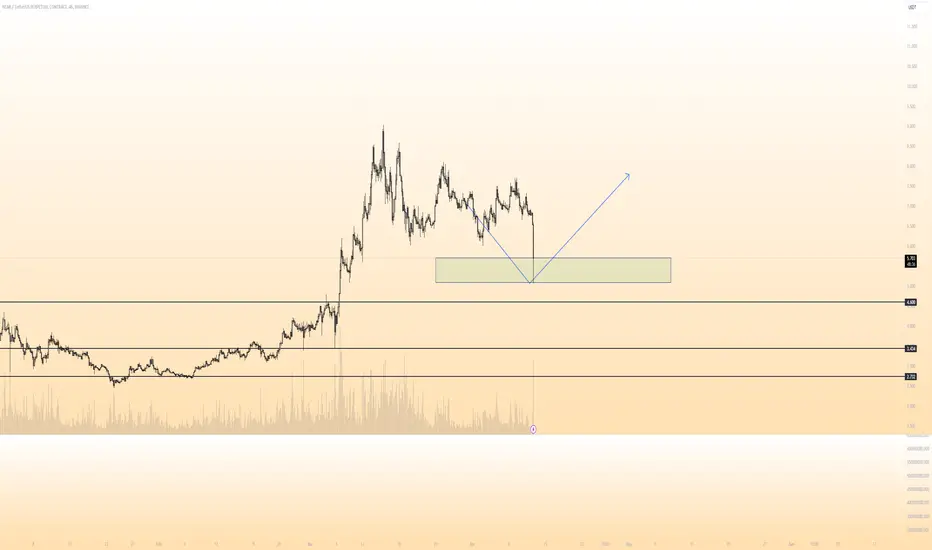
NEAR/USDT Trading ScenarioAfter reaching a local high of $8.981, NEAR corrected to $4.453, resulting in a decline of over 50%. Subsequently, the asset attempted to recover but failed to reach the previous local high and once again headed downward, retesting the $4.453 level and breaking below the 200-day moving average. Currently, the asset is trading near the newly formed resistance level and the 200-day moving average, with support provided by the volume profile.
Under current conditions and within the summer market context, a continuation of the downward movement can be expected with the aim of liquidity accumulation.
This situation appears quite attractive for opening a position in this asset and holding it until new significant sell signals emerge.


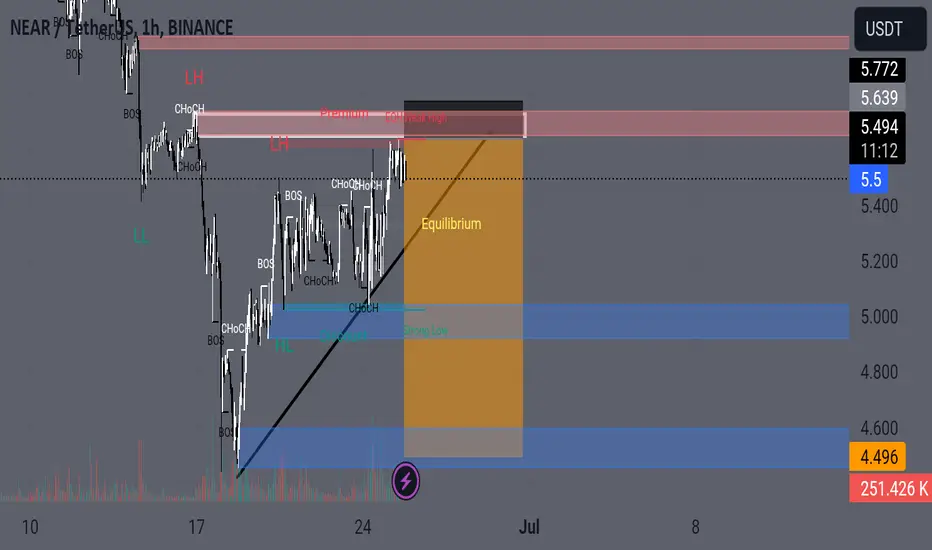
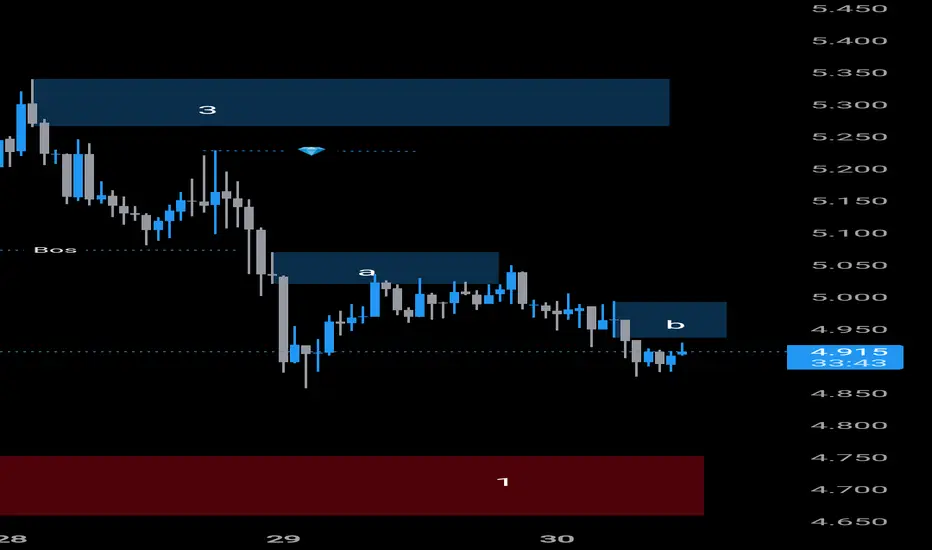
NEARNEAR mitigated this orderblock (a) and moved down. Because NEAR has bearish. So more down possible.
This order block (b) was resistance zone. So NEAR mitigate this zone and moving down.
Order block (1) was next support zone.
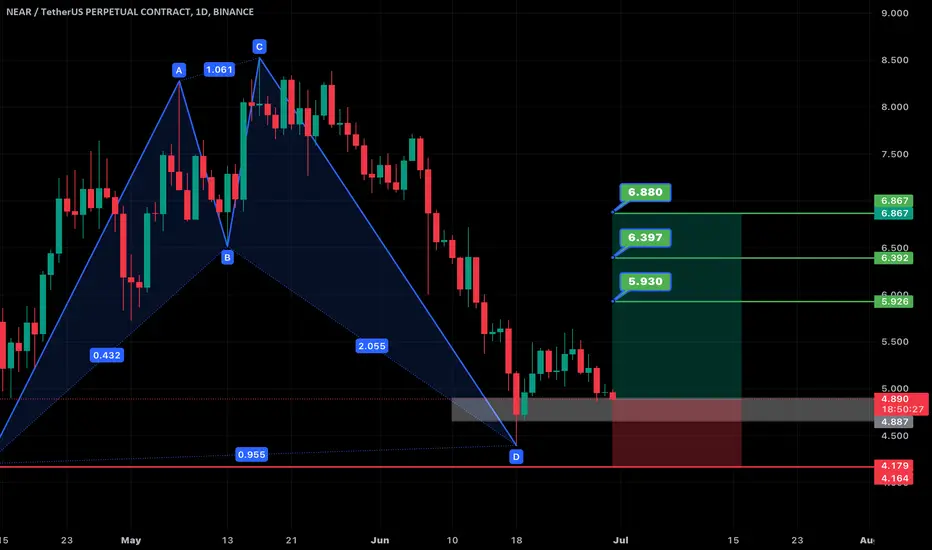
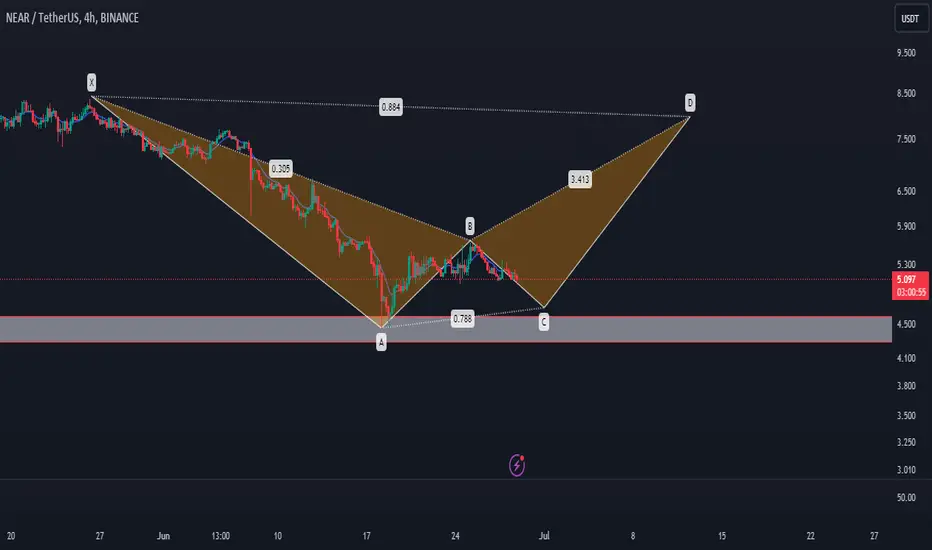
NEARA Harmonic Reversal Pattern suggests that the price is expected to begin reversing, targeting the levels specified on the chart.
NEARThere is a good point for recruiting a position, I have been gaining a position for 2 weeks with a ladder, I am making the final purchase, and I will wait for the goals indicated on the chart!
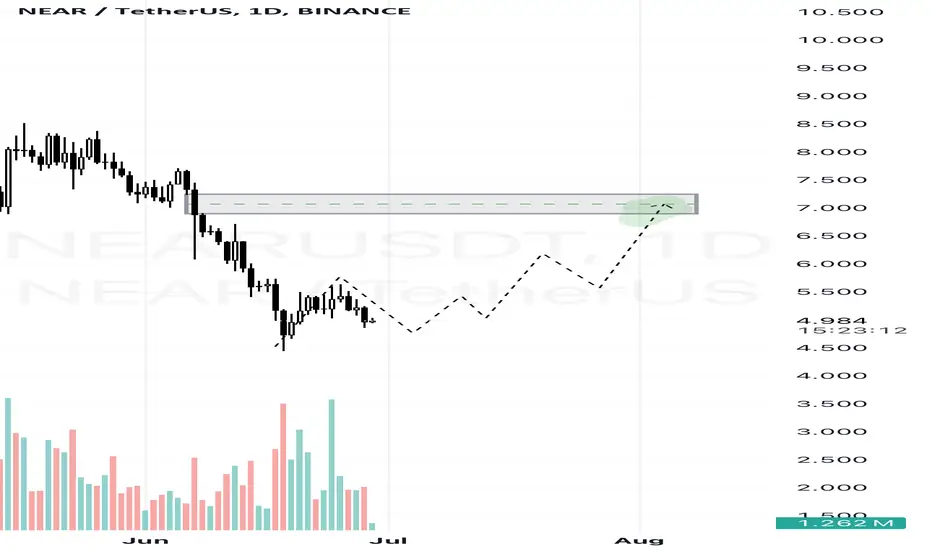
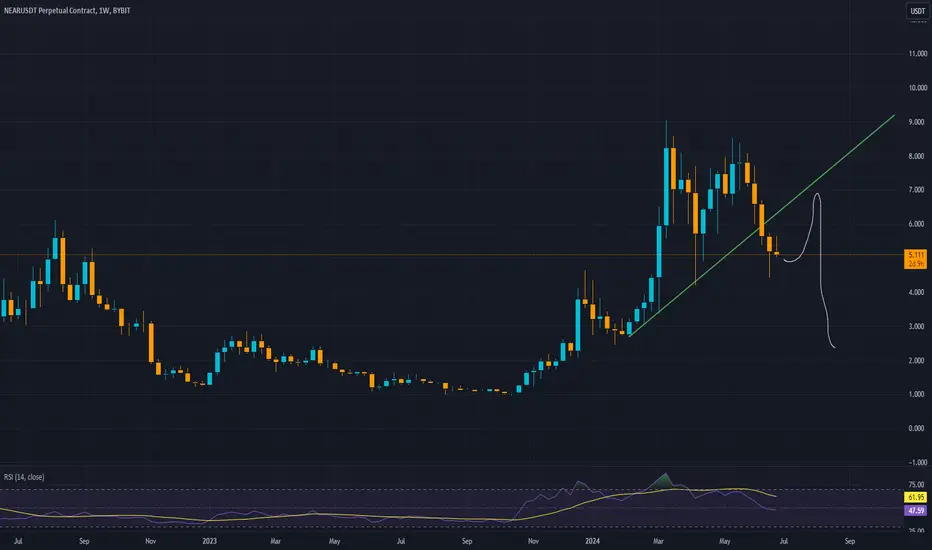
NEAR ready to bounceI was expecting this drop at the beginning of the month but market always finds a way to surprise us in every way I guess.
Now we have a good price region to add into NEAR spot positions.
NEAR Big Dump IncomingDouble top is probably the main factor of NEAR can mega dump because ALT is slowing down buying presure
NEARUSDT : possible harmonics pattern on 4HBINANCE:NEARUSDT
Near possible retracement towards 4.7, from where we can see possible reversal towards 7.96
Weekly and daily trendline and Fibonacci analysis for 4HThere are strong resistance lines in higher timeframes that create a good risk-reward for a long position with the potential for price growth in the 4-hour timeframe
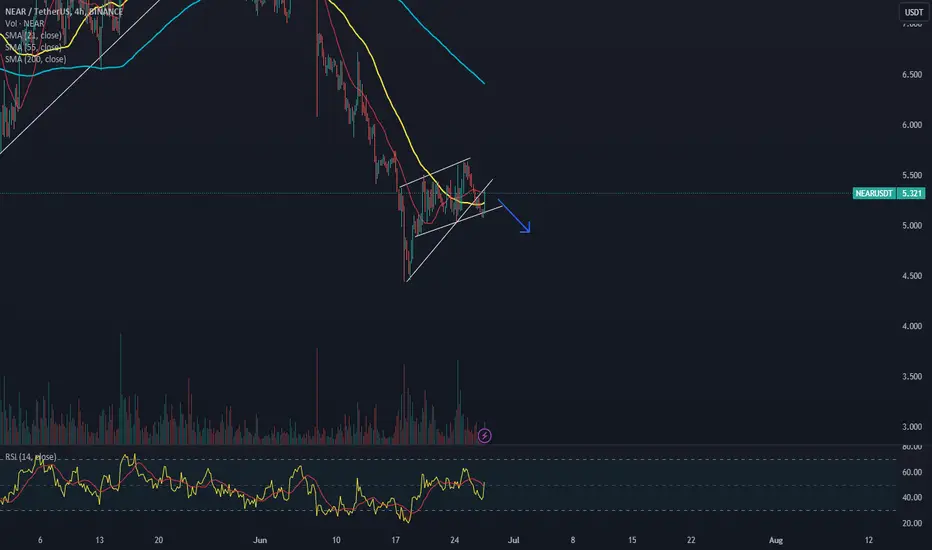
Near is likely to continue its way to downside Near made a retest to the wedge and I guess it will continue to downsite.. NFA
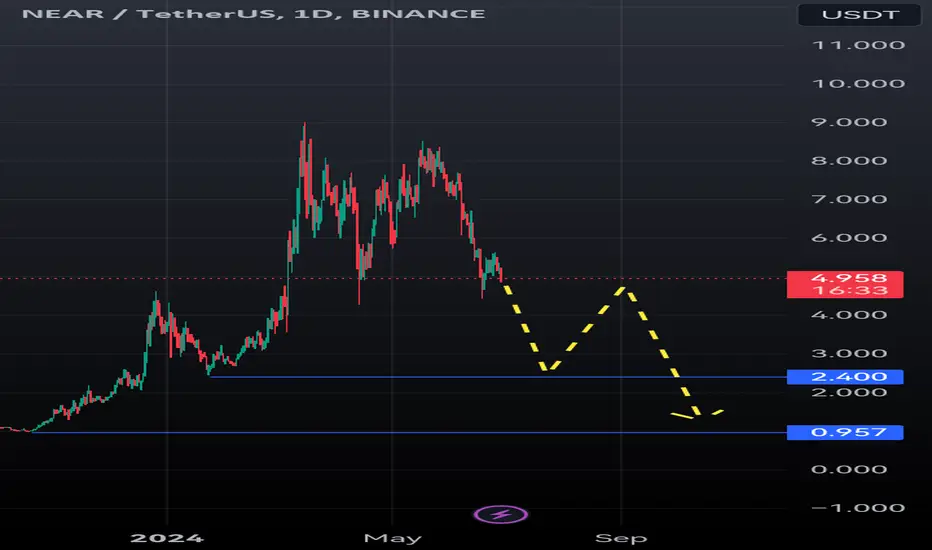
NEAR May Resume The Downtrend AgainNEAR May Resume The Downtrend Again
Price is moving in a bearish trend for a long time.
After NEAR completed a bearish it looks like it can resume the bearish trend again as a minimum in the short term.
The price may stop near our targets but can also move down further.
The first resistance zone is expected near 4.9 and the second zone is 4.6
Let's see how the price develops during the coming days.
You may find more details in the chart!
Thank you and Good Luck!
❤️PS: Please support with a like or comment if you find this analysis useful for your trading day❤️

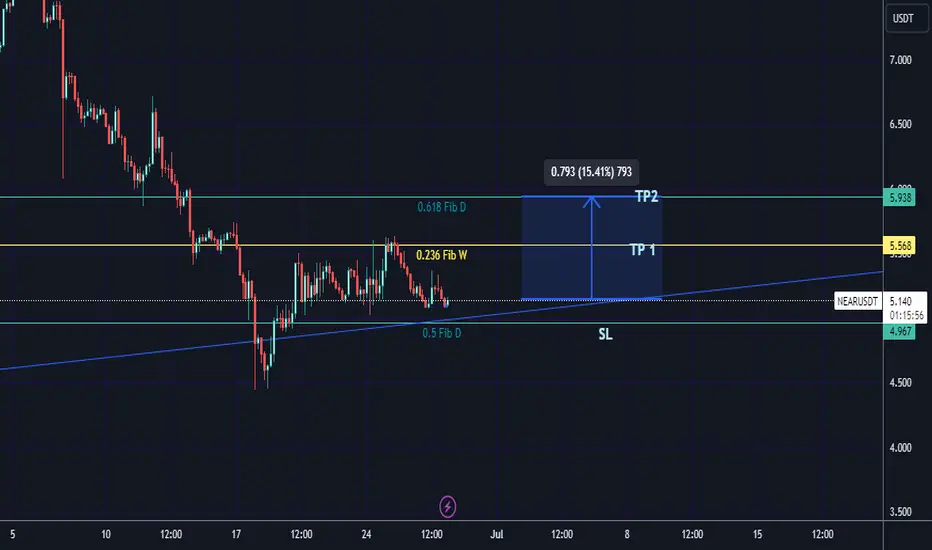
NEARPretty solid trade here.
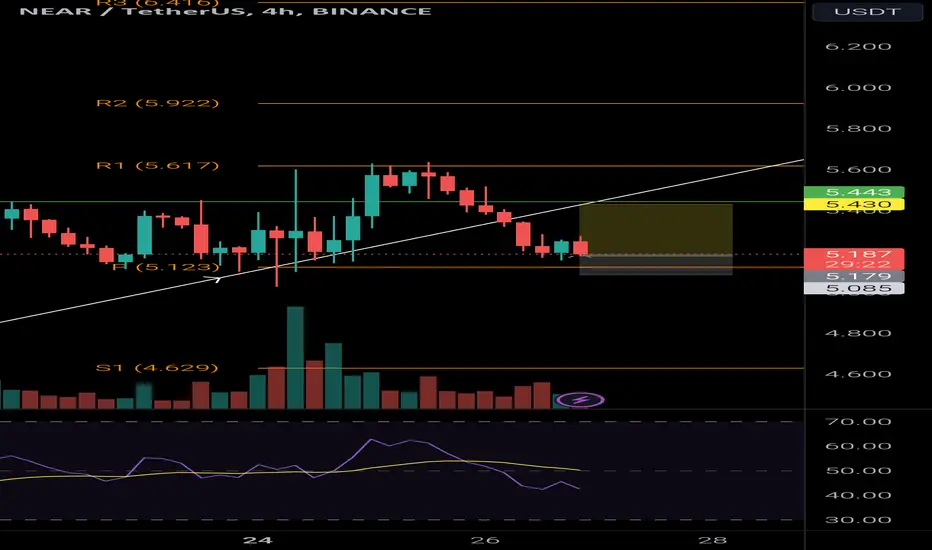
Rejection and back into consolidation zone.
I don't expect that support level to break, it'll be used by holders to accumulate more.
2:1 risk on this for spot, no leverage.
Stop is at the bottom and TP is at top.
I'd close this close to TP if bitcoin continues acting like a spoilt child.
Market conditions are rough.
Glhf!
NEAR 2 week higher low attempt. Stronger chart.NEAR , backtest of the VA that held during the entire BTC drop for 15 OS for a 4h HL.
one of the stronger technical charts for a SWING now in my opinion.
Adding back some of what I sold yesterday ,
I got stopped out overnight out of half 2 nights ago.
rejected from D EMA 12.
but it shows there is enough opportunity with longterm W consolidation to establish SWING positions

NEAR Protocol Update in Daily TimeframeNEAR Protocol is showing a bounce-back from the $4.2 to $4.5 support range. NEAR needs to hold this support level to continue the rally toward $8.
A breakdown and close below this support range will likely invalidate the rally and lead to a further decline in the price action.
Note: Do your own research before investing.
Short near/usdt I can short near usdt because of my analysis tell me everyone if I am right or wrong .....