Near#Nearusdt
After a downward trend, a reversal pattern has been formed... it is expected that after the break of this pattern, the price will move upwards... a strong positive movement
NEARUSDT.3L trade ideas

$NEAR is a breaking out - a laggard play Breaking out the flag rather late - but this gives a second shot to people that misses the bull run of other coin recently.
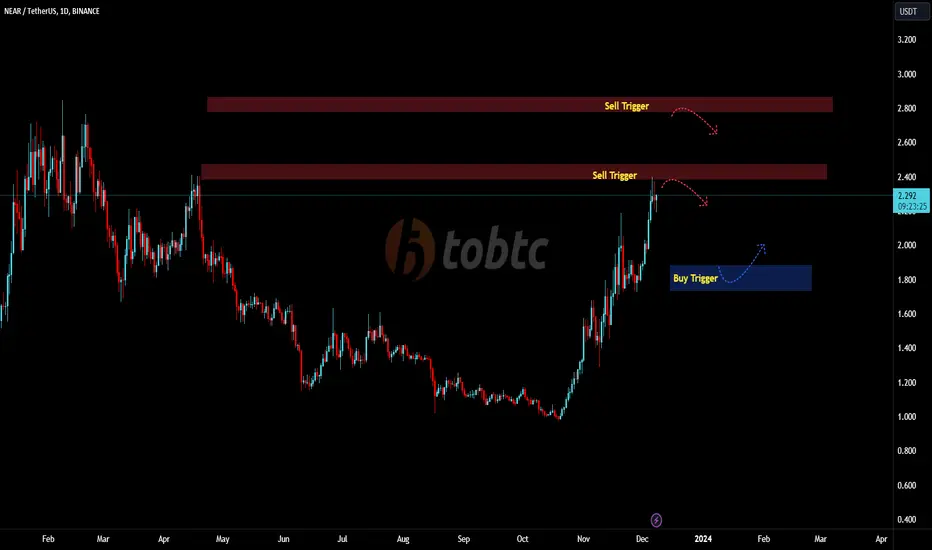
#NearUSDT #LQR #TOBTC #LaqiraProtocolWe are in the daily resistance in this area looking for reasons to enter a sell position This analysis is a personal viewpoint and is not an offer to buy or sell
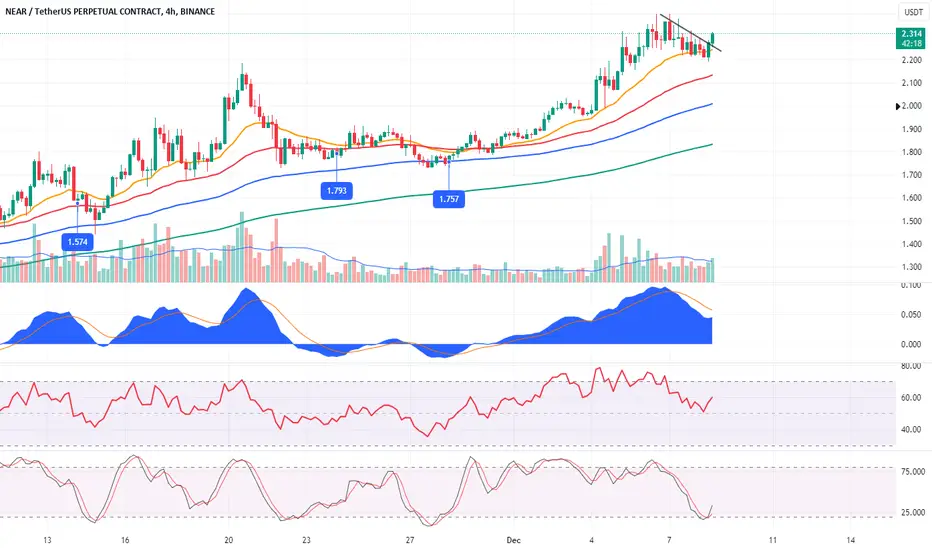
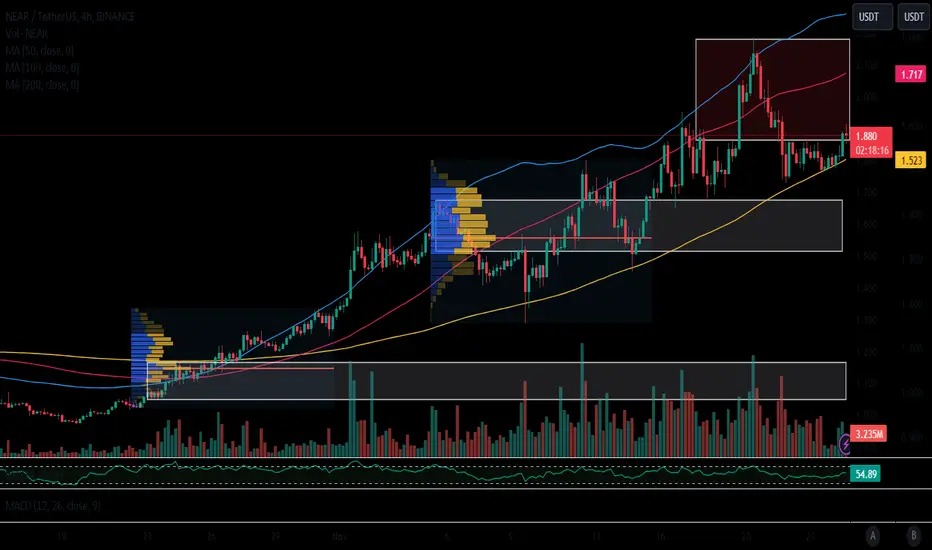
NEAR/USDT ↘️ Short Trade Setup ↘️Hello Everyone 🙋🏽♂️
Ascending channel + rsi overbought
🟠 EP 2.263
🔴 SL 2.445
🟢 TP1 2.065 ⚠️( Close 33% of the trade and Set the SL on EP )⚠️
🟢 TP2 1.896 ⚠️ ( Close 33% of the trade )⚠️
🟢 TP3 1.717 🔥 ( Final result)🔥
We are not responsible of any losses for anyone, our trades are profitable more for long terms and we take losses as everyone,
manage your lot size as well and your SL and TP and my opinion is 0.01 lot for each 500 $.
Don't forget to hit the like bottom and write a comment to support us.
Follow us for more 🙋🏻♂️
Best Regard / EMA Trading .
Disclaimer:
----------------
It's not a financial advise, As everyone we take losses sometime but for long term trading we are profitable traders, so manage your account well with SL and TP and your lot size to keep your account safe and stay in the market

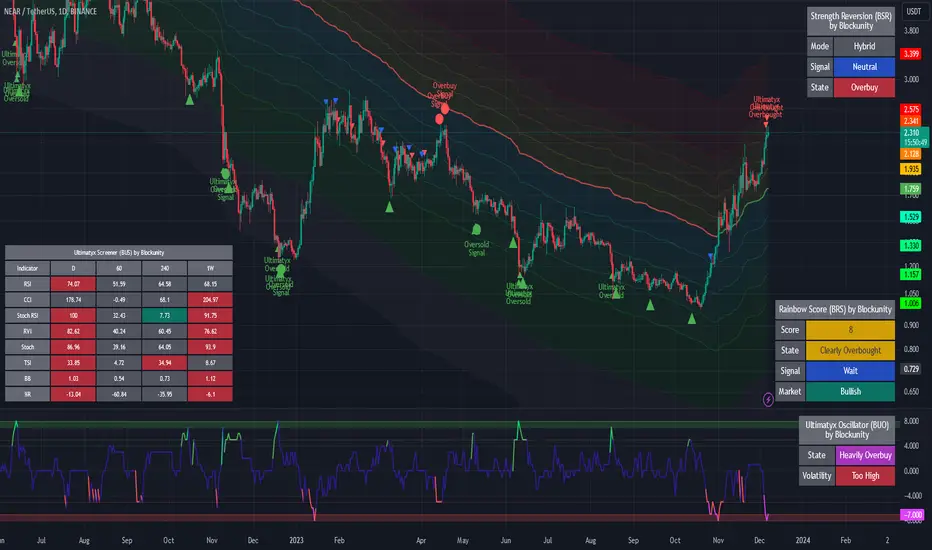
NEAR/USDT approaching a local top?NEARUSDT analysis using the Unyx Data
Today we take a look at NEAR and its current state in the market:
- BRS: As usual let's get a feeling for the current temperature of NEARs price. We see that it is creeping up towards the over-heated zones 9 and 10 of the Rainbow Score, indicating that we should be ready to take some profits in the coming days.
- BSR: the Strength Reversion showed some sell signals in April (indicated by the red dots) as well as some buy signals in May (green dots). Currently the BSR hasn't triggered any sell signals, but as it is in an Overbuy state, this should happen any time soon.
- BUX: let's finally see what the BUX has to say. First let's take a look at the Oscillator (BUO). It clearly shows a change of trend as it is now moving more on the lower half of the oscillator, indicating that its indicators are mostly overbought. Taking a look at the screener (BUS) we see that in the Daily timeframe, all indicators expect the CCI are overbought. Looking at the smaller timeframes (1h and 4h), the overbought trend isn't much visible, but this will probably change over the day as the European and American markets wake up. On the weekly timeframe again, most of the indicators show an overbought state.
So clearly, NEAR isn't a buy right now, but if you have some in your bags it will soon be a good moment to take some profits. If you bought at the end of the summer, you should be in a profit of around 130%, depending on your average entry price.
Do you have some NEAR in your portfolio? If so, what is your next target price? Let us know!
Long-Term Price Analysis for NEAR Coin!#NEAR
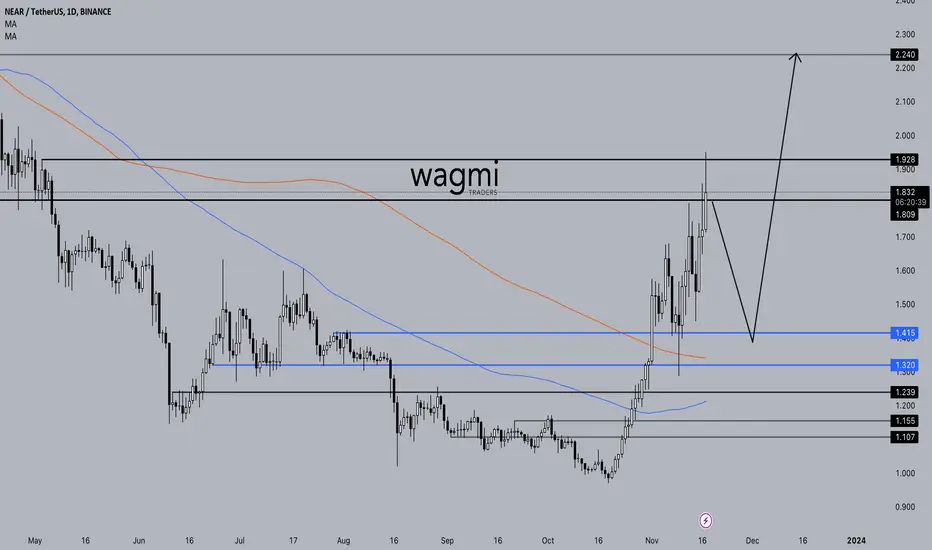
The range we have been waiting for long-term spot buying for NEAR coin is between $1.415 and $1.32. When NEAR coin reaches the zone indicated as blue lines in the analysis, it will have completed a retest move to the trend support.
If NEAR coin initiates an upward movement from the $1.415 - $1.32 range, our target for the upward trend is the $2.20 region.
Our initial purchase for NEAR coin will be at the $1.415 level, and we are placing our second buy order at the $1.32 level.
NFA.
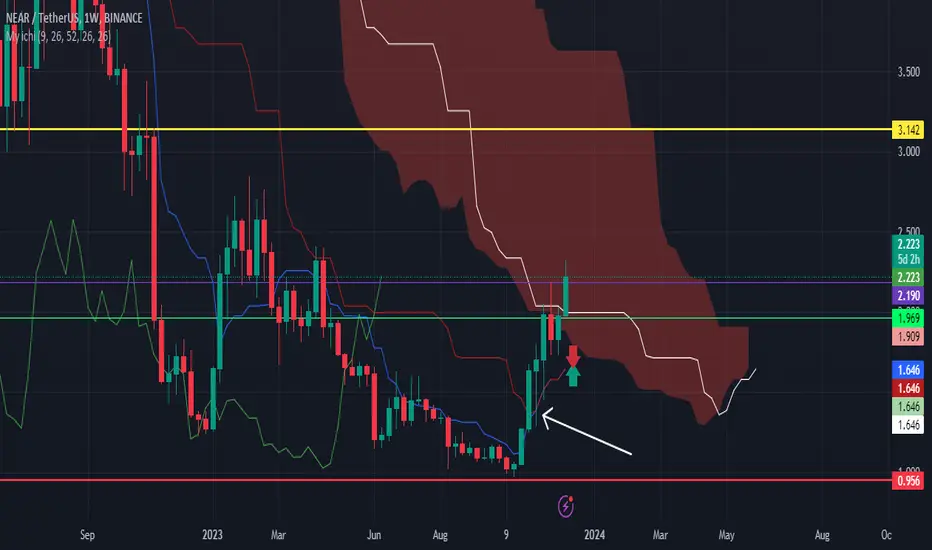
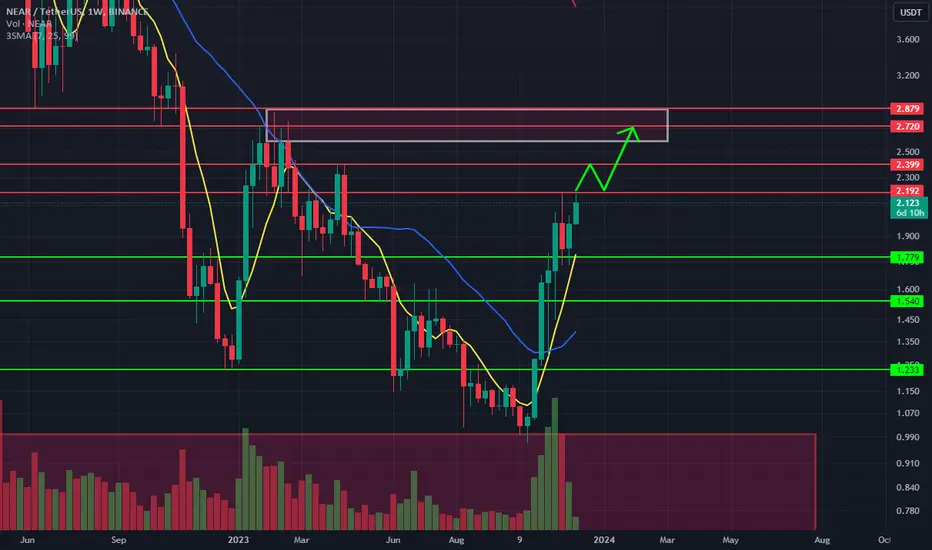
NEARUSDTNEAR analysis of the weekly time form
The price is now 2.14, and the upcoming resistances are 2.19, 2.39, and 2.72 respectively.
NEAR: UP or DOWN ?
Near had a significant price correction recently and currently it is trying to establish it support level
We can expect this price uncertainty to continue for a while as shown in the above chart.
With the current bullish market sentiment we can expect NEAR price to bounce back.
Im expecting price to move up once it settles in the support zone.
We will keep you posted about our trade entries. Stay tuned
Like and share your thoughts in the comments.
Cheers!
GreenCrypto
NEARUSDT.Pthat is possible
What do you think of this idea? What is your opinion? Share it in the comments📄🖌
If you like the idea, please give it a like. This is the best "Thank you!" for the author
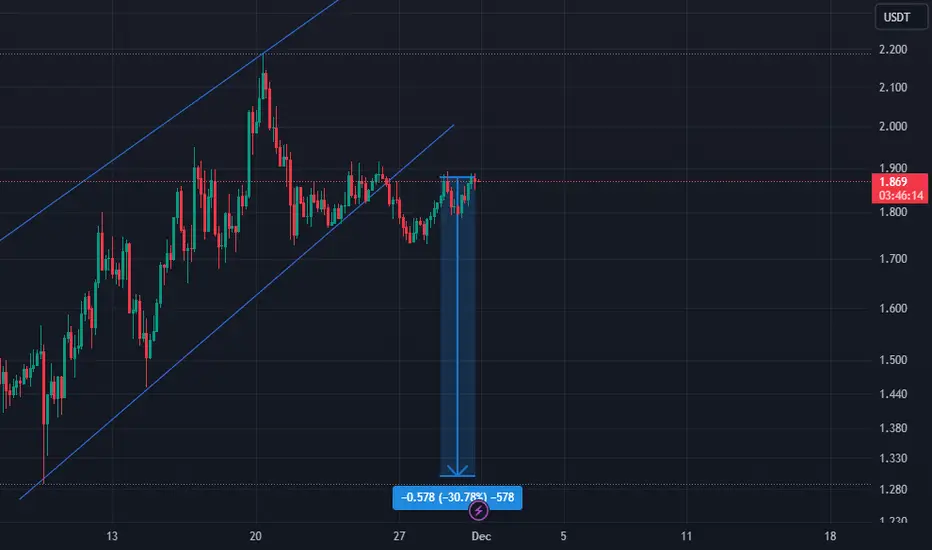
Near Short Idea ScalpEntering in short from here
Entry 1.990
Tight SL 2 (0.5%)
TP 1.86 (6.5%)
Note: not a Financial Advice

SHORT Near/usdt From Here Guys....#NEAR🔴🔴🔴
#Signal
👉EXIT: by market
✅TARGETS : 1.778-1.636-1.531
🔴Stop loss : 1.957
💸Put no more than 2% of the deposit on the trade
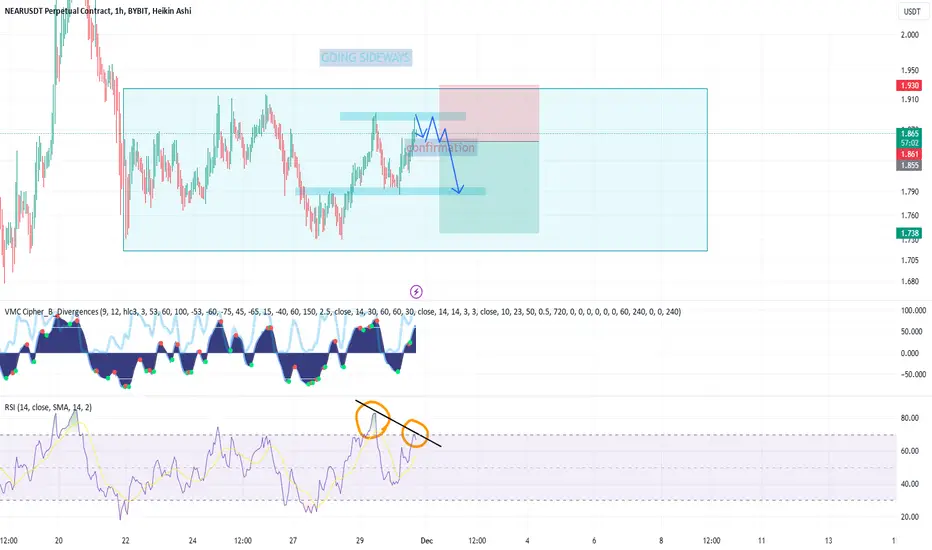
NEARUSDT Double-top daytradeDouble Top and descending RSI highs.
📉 Double Top Pattern:
A double top pattern is a bearish reversal pattern that signals a potential trend reversal. It forms after an uptrend and consists of two peaks at approximately the same price level. The pattern is completed when the price breaks below the intervening trough, indicating a shift from bullish to bearish sentiment.
📉🔼📉 Descending RSI Highs:
The Relative Strength Index (RSI) is a momentum oscillator that measures the speed and change of price movements. When combined with a double top pattern, observing descending RSI highs adds an additional layer of confirmation. As the price creates the second peak in the double top, if the corresponding RSI highs are descending, it suggests weakening upward momentum and potential exhaustion of buying interest.
🔍📉 Interpreting the Combination:
The double top pattern indicates a struggle for the market to sustain higher prices, while descending RSI highs reinforce the notion of diminishing buying strength. This combination serves as a powerful signal for traders, suggesting a higher probability of a trend reversal to the downside.
📉💨 Potential Bearish Momentum:
When the price breaks below the neckline of the double top, and RSI confirms with lower highs, it may indicate a shift towards bearish momentum. Traders often use this confirmation to initiate short positions or adjust their existing positions in anticipation of a downtrend.
⚠️ Risk Management is Key:
While these patterns and indicators provide valuable insights, it's crucial to implement proper risk management. No strategy is foolproof, and unexpected market events can occur. Always use protective measures like stop-loss orders to mitigate potential losses.
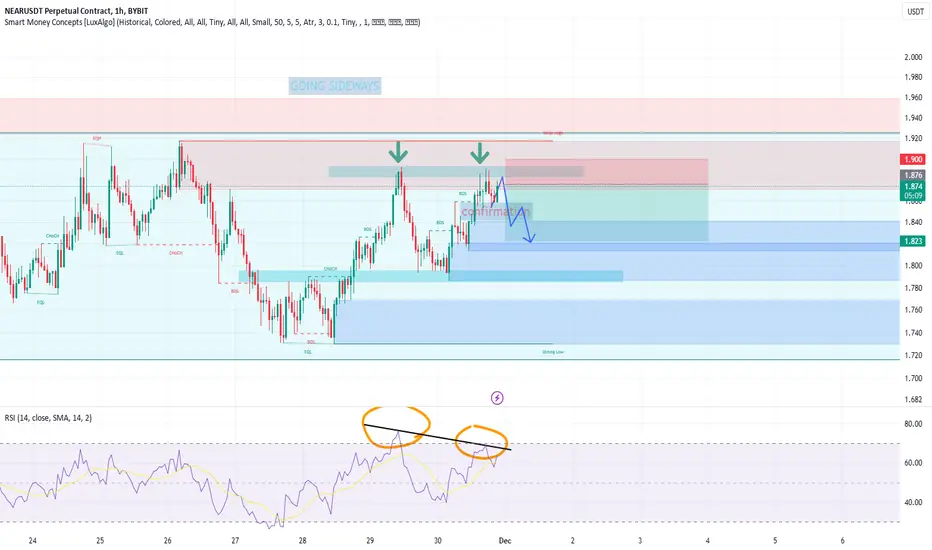
NEARUSDT or whatever. Short setupDouble top is about to form. IF and IF RSI hights are still descending and Cipher B gives sell signal (red dot) we are good to go.
Short from first move or safe play is to wait another pullback.
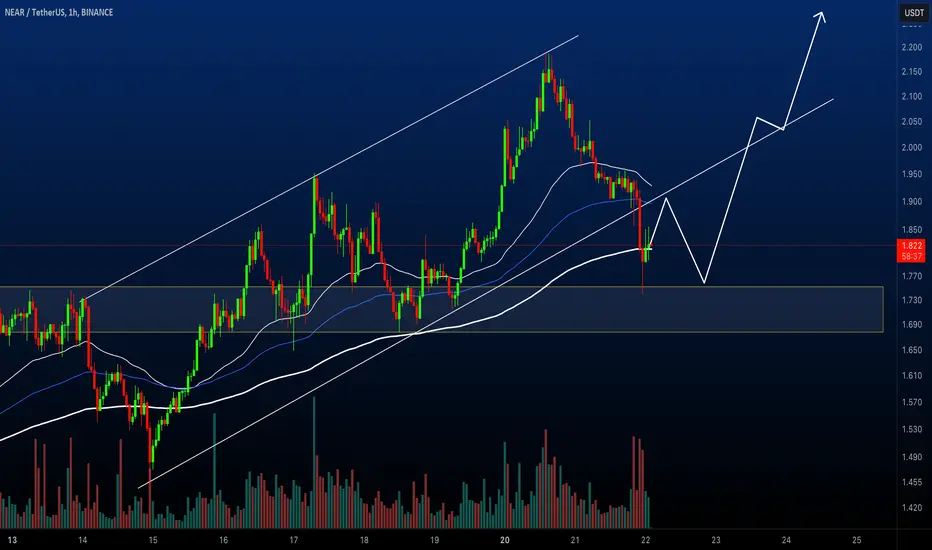
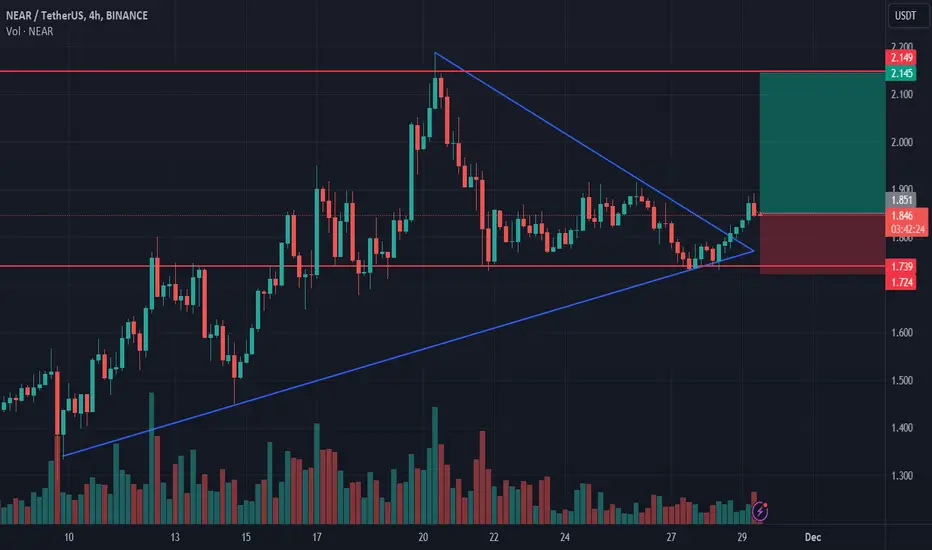
NEAR longNEAR bounced off the ascending trendline and bounced off the support level. Bullish movement to resistance level at 2.145 is expected to happen.
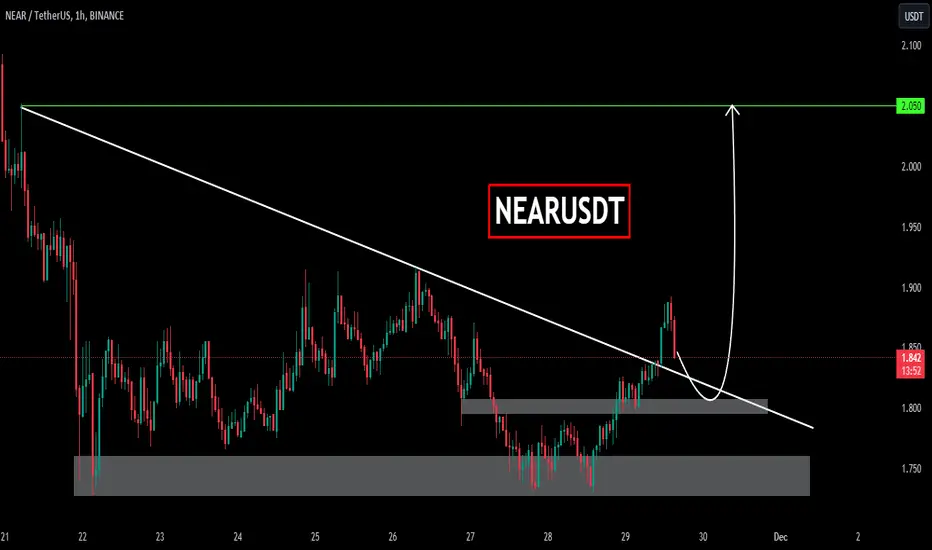
NEARUSDT NEARUSDT was trading under declining trendline and recently it seems like the sellers are bit exhausted then bulls took the charge and break through declining trendline.
Currently the price has given the breakout from falling trendline and now forming a local support around 1.80 region.
Will the bulls take charge again continue for leg higher?
NEAR USDT Nearusdt has opportunity to buy at this level for long term investment it will go up to 5$ in next coming weeks, first buying at this level 1.633 and 2nd buy at 1.330 if comes down dont forget to use dollar cost averaging

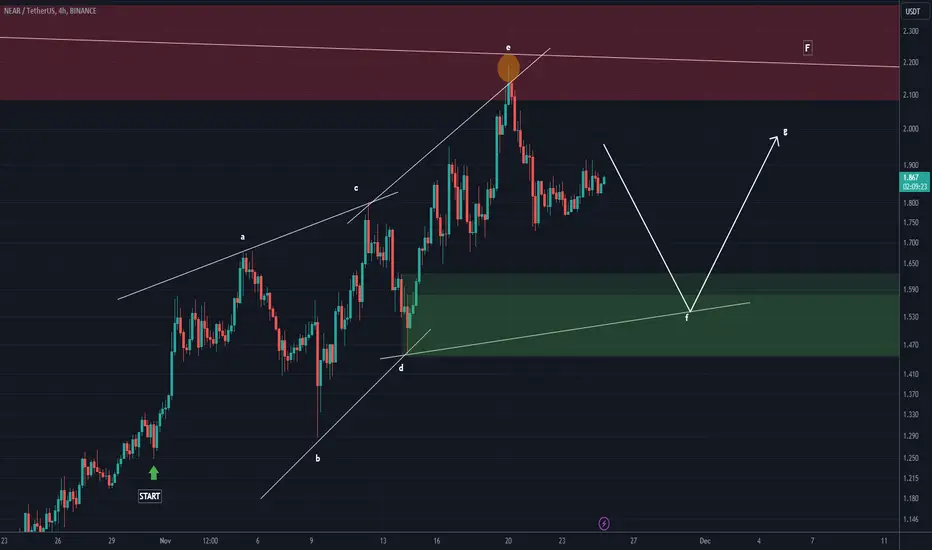
NEAR ANALYSIS (4H)It seems that the NEAR currency is in a diametric, and now we are in the F wave of this diametric.
After completing wave F on the green box, we can move up for wave G.
For risk management, please don't forget stop loss and capital management
Comment if you have any questions
Thank You
Near Protocol (NEAR) Bulls are Prioritizing Breaking ZoneNear Protocol (NEAR)
While NEAR's price has surged by 120% over the past month, its growth has recently decelerated. The asset is trading in a support zone ranging from $1.70 to $1.83, and buyers appear hesitant to push the asset beyond this range.
Should NEAR continue its upward trajectory amid Bitcoin's positive trend, the token might test the $1.95 mark and encounter resistance in the $2.05-$2.19 zone. Bulls are prioritizing breaking past these local highs. If successful, NEAR might then tackle resistance levels at $2.3 and $2.4.
Beneath its current support zone, NEAR has a potential buyer's level at $1.65 and another zone between $1.46 and $1.55. These levels could be tested even without a Bitcoin market correction, particularly if buyers lack the momentum to drive up prices from their current positions.
NEAR/USDTAMEX:NEAR
Ascending broadening wedge pattern, set alert on red support line if it breaks down we SHORT
if we white resistance line breaks above we LONG

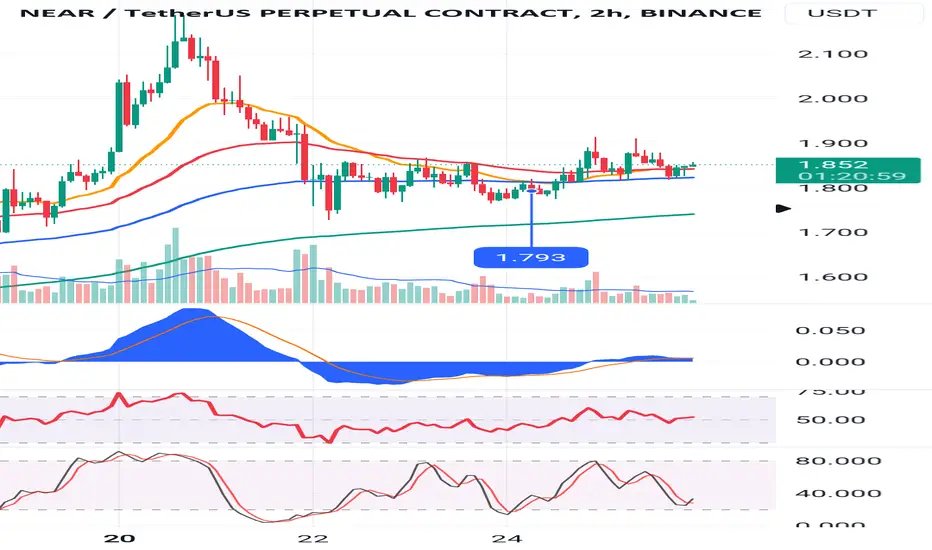
Maintain the mentioned range to continue the upward pathThe price of this currency is moving in the white channel, if the range of 1.744 is maintained, it can still be an upward trend.

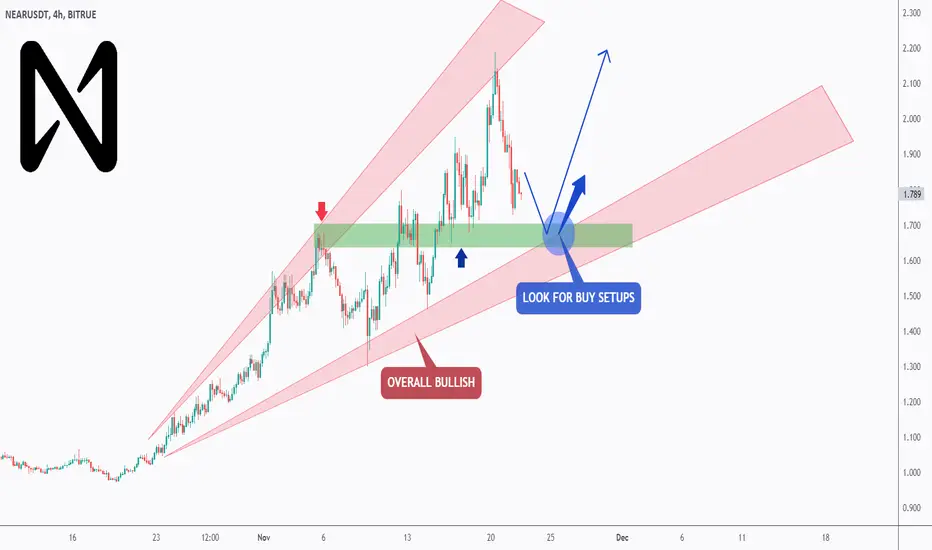
NEARing A Strong Support ✅Hello TradingView Family / Fellow Traders. This is Richard, also known as theSignalyst.
📈 BITRUE:NEARUSDT has exhibited an overall bullish trend , trading inside the rising broadening wedge in red.
At present, NEAR is undergoing a correction phase and it is currently approaching the lower bound of the wedge.
Moreover, it is retesting a strong support/structure marked in green.
🏹 Thus, the highlighted blue circle is a strong area to look for buy setups as it is the intersection of the green support and lower red trendline acting as a non-horizontal support.
📚 As per my trading style:
As #NEAR approaches the lower blue circle zone, I will be looking for bullish reversal setups (like a double bottom pattern, trendline break , and so on...)
📚 Always follow your trading plan regarding entry, risk management, and trade management.
Good luck!
All Strategies Are Good; If Managed Properly!
~Rich