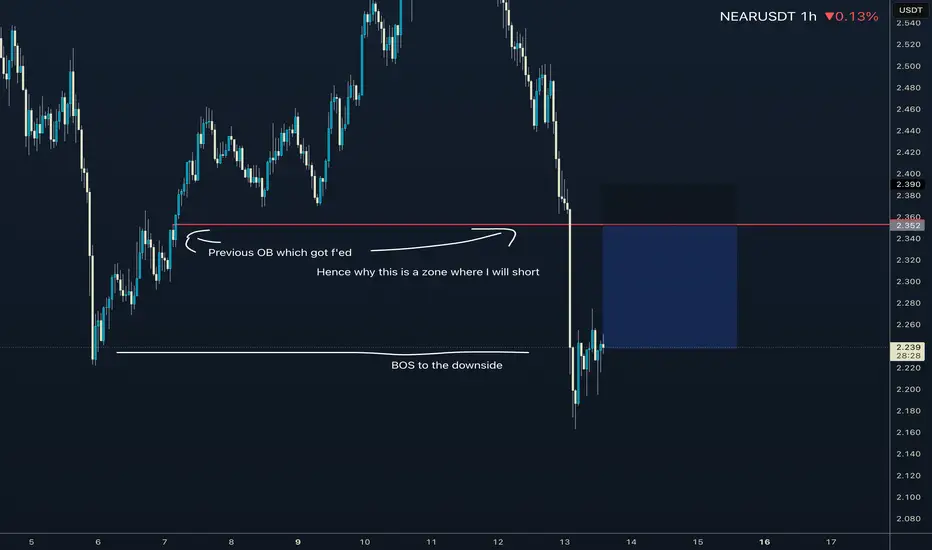
NEAR shortAs you can see on the chart NEAR has broken to the downside as multiple hourly candles have closed below previous swing lows.
I have identified an untapped OB which I will utilize for my zone to short.
Use max 5-8x leverage.
Good luck
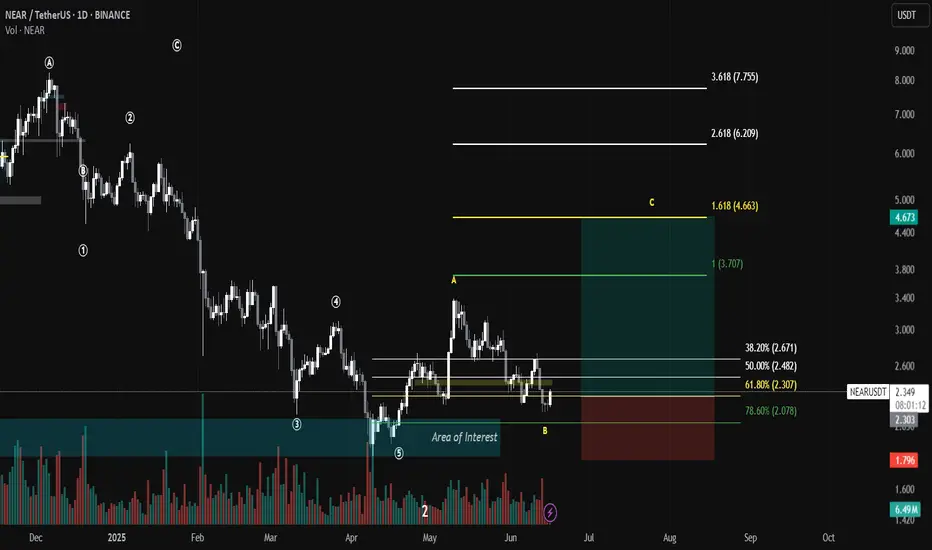
NEAR/USDT trade plan🧠 NEAR/USDT – Potential Wave C Setup (Elliott Wave + Fib Confluence)
📆 Timeframe: 1D | Exchange: BINANCE
🚀 Setup Overview:
We are likely entering a bullish Wave C based on the completion of an ABC corrective structure within a larger Elliott Wave pattern. The current price action has pulled back in
TradeCityPro | NEAR: Key Support Battle in Layer 1 AI Protocol👋 Welcome to TradeCity Pro!
In this analysis, I’m going to review the NEAR coin for you — one of the prominent AI-focused and Layer 1 protocols that has gained significant attention in recent years.
🔍 This project’s coin, with the ticker NEAR, currently holds a market cap of $2.94 billion, ranking
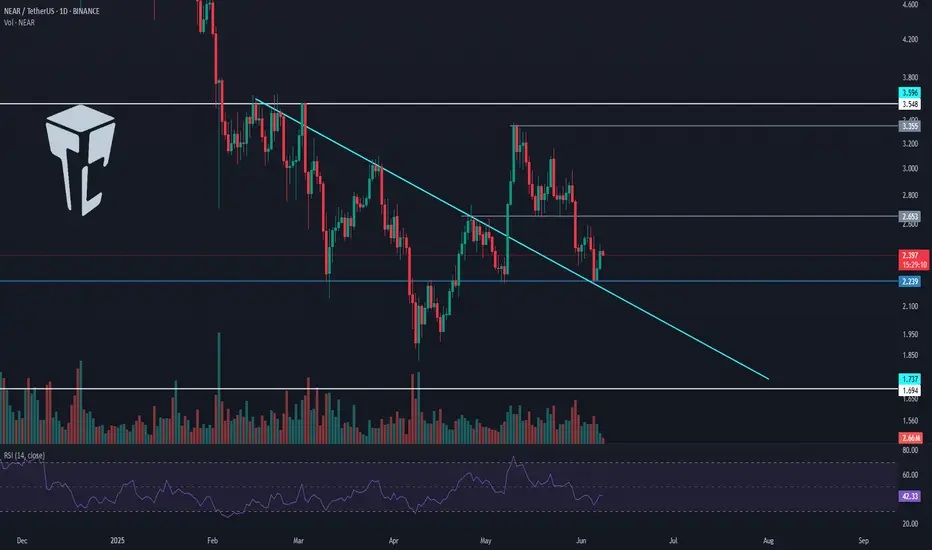
Breakout Watch: NEAR Approaching Moment of Truth If you want, ICBOE:NEAR is currently testing the breakout zone but is still holding below the key trendline.
It’s a critical spot — if NEAR manages to break and close above this trendline, it could unlock further upside. For now, the trendline remains intact, so patience is needed here.
Watching closely to see
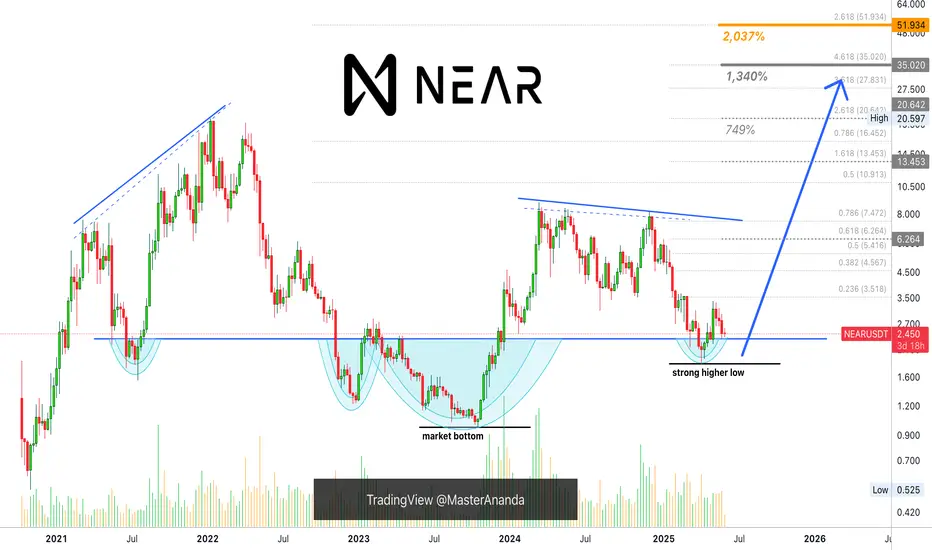
NEAR Protocol Can Hit $35 or $52 in 2025 (PP: 2,000%+)Back to what I was doing... NEAR Protocol (NEARUSDT) closed red three weeks and this week is the fourth week with the action being bearish, why am I bullish?
Four weeks of bearish action and there isn't much, well, bearish action. Total drop is less than 30%. If you look back to January, or say May
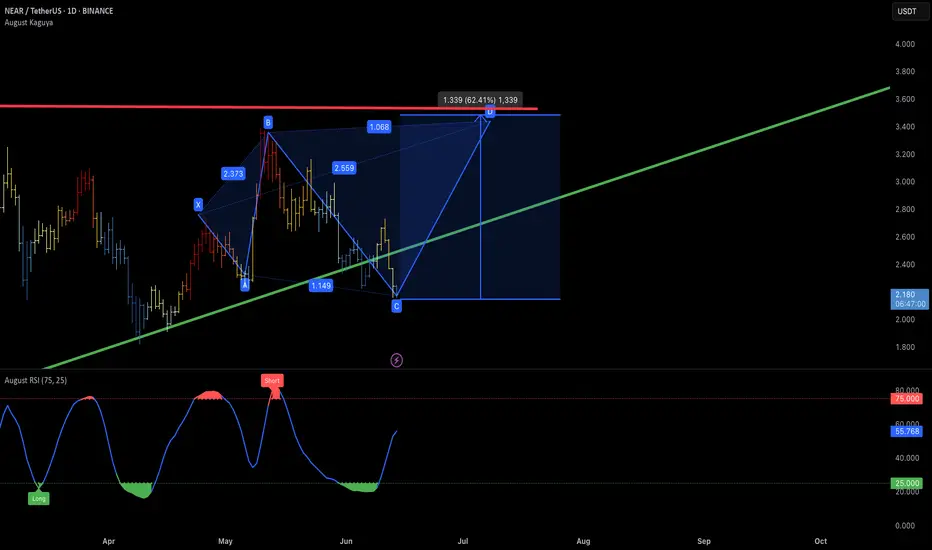
Long Setup on NEAR/USDTBullish harmonic pattern forming with confluence on the rising trendline and fib levels. Currently at point C, expecting a potential move toward point D.
📌 Entry: ~2.18 (current price, near C-zone)
🎯 Take Profits:
TP1: 2.55 (minor structure)
TP2: 2.85 (golden fib extension)
TP3: 3.20
TP4: 3.60 (ma
NEARUSDT 1D AnalysisNEAR ~ 1D Analysis
#NEAR Buy again from here if you still have confidence in this coin with a short term target of at least 10%+ and a long term target of $8
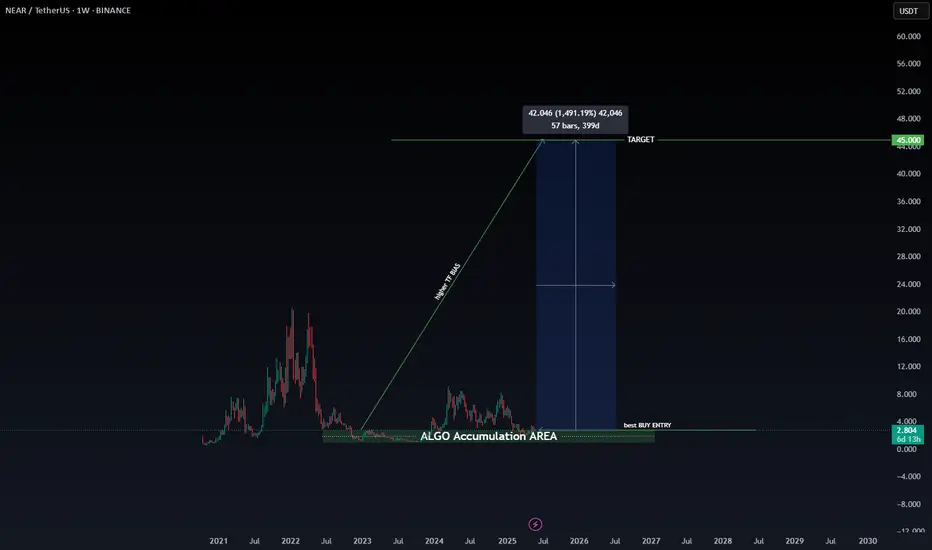
NEAR to $45? The Signs Are All There…Just imagine traveling through time.
Many people look back with regret, wishing they had invested in cryptocurrencies before previous bullish cycles. We've all heard phrases like "If only I had bought Bitcoin at $100, I'd be a millionaire by now."
But the real question is: Will you have the courage
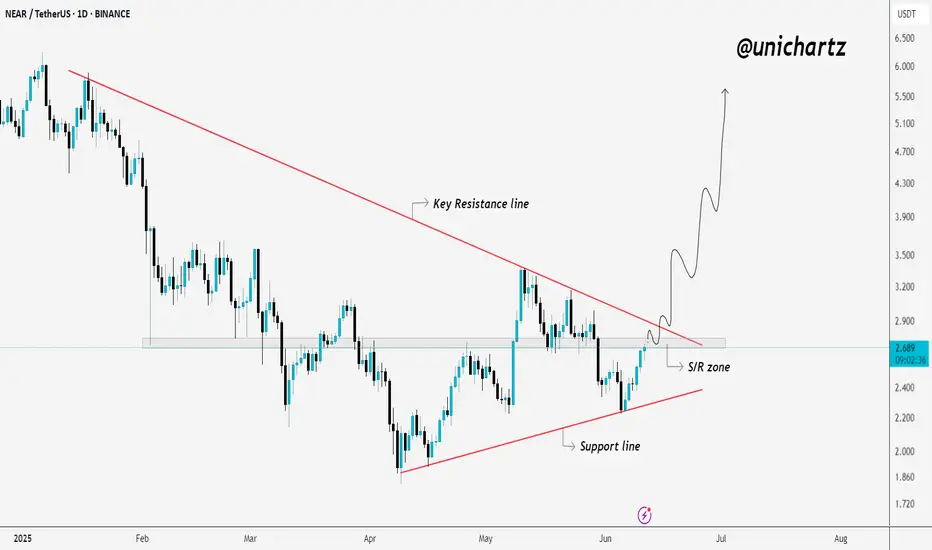
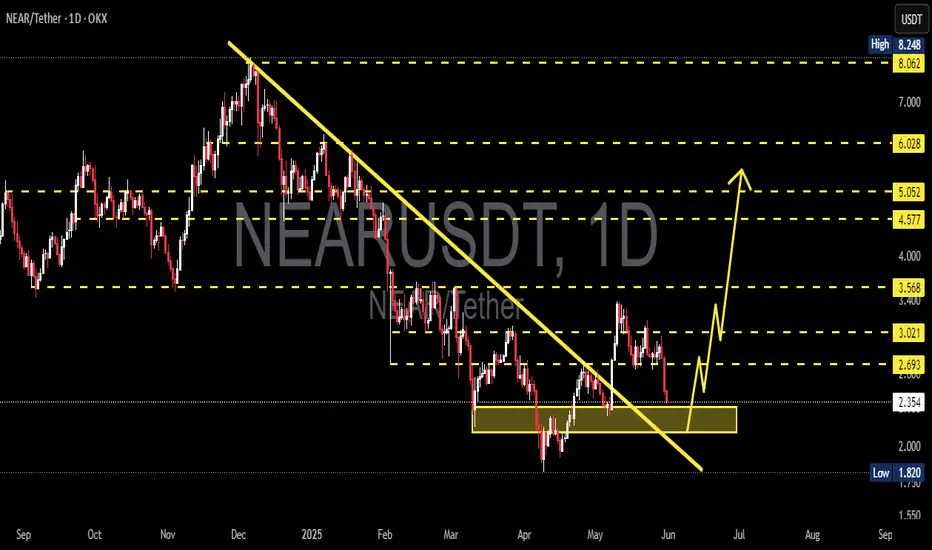
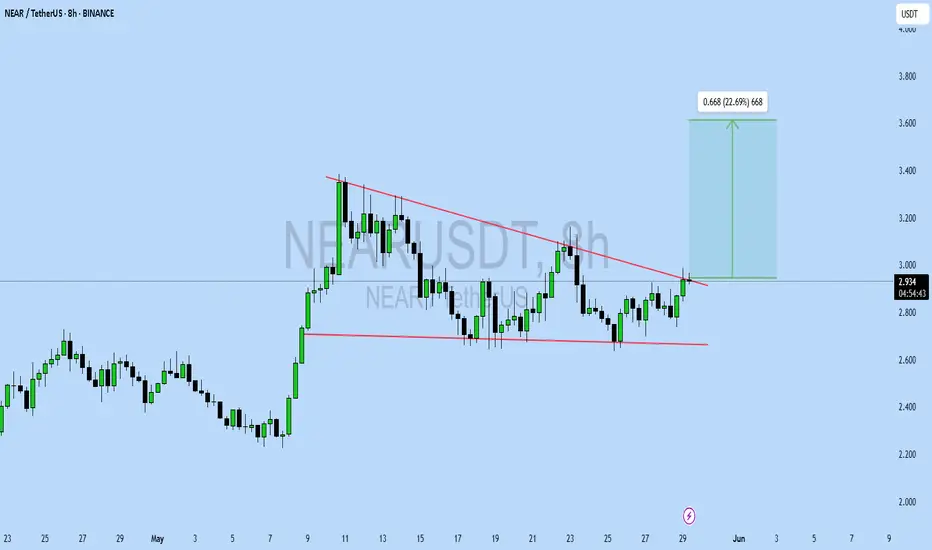
NEARUSDT UPDATE
Pattern: Descending Triangle Breakout
Current Price: \$2.937
Target Price: \$3.60
Target % Gain: 22.69%
Technical Analysis: NEAR has broken out of a descending triangle on the 8H chart. Price is closing above resistance with decent momentum, indicating a potential move toward \$3.60.
Time Frame:
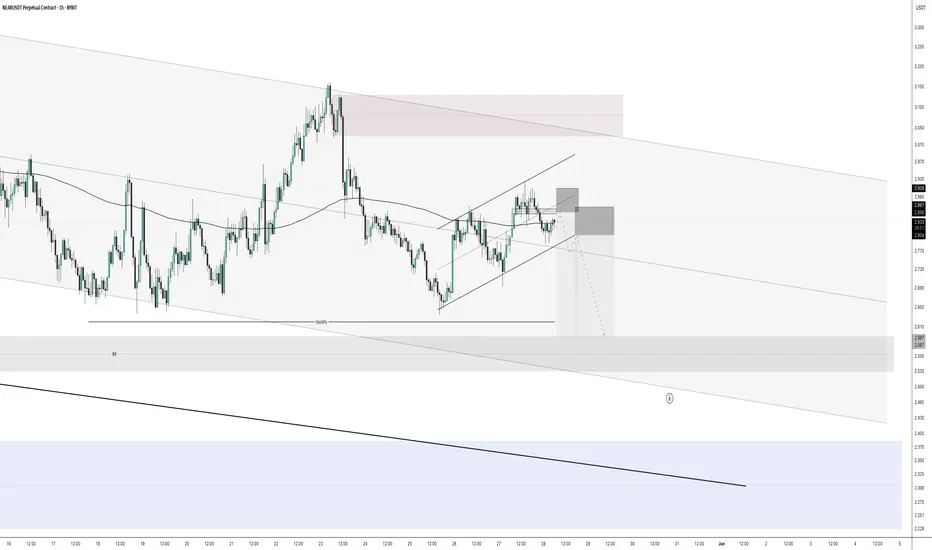
Near short continuation to HTF POINear is falling bellow the 200EMA on the 1H Time Frame and price is showing weakness trying to gain momentum to the upside.
Before we start the next big move up we need the price to go lower and grab some liquidity to have the necessary fuel to start the real move to the upside.
See all ideas
Summarizing what the indicators are suggesting.
Oscillators
Neutral
SellBuy
Strong sellStrong buy
Strong sellSellNeutralBuyStrong buy
Oscillators
Neutral
SellBuy
Strong sellStrong buy
Strong sellSellNeutralBuyStrong buy
Summary
Neutral
SellBuy
Strong sellStrong buy
Strong sellSellNeutralBuyStrong buy
Summary
Neutral
SellBuy
Strong sellStrong buy
Strong sellSellNeutralBuyStrong buy
Summary
Neutral
SellBuy
Strong sellStrong buy
Strong sellSellNeutralBuyStrong buy
Moving Averages
Neutral
SellBuy
Strong sellStrong buy
Strong sellSellNeutralBuyStrong buy
Moving Averages
Neutral
SellBuy
Strong sellStrong buy
Strong sellSellNeutralBuyStrong buy
Displays a symbol's price movements over previous years to identify recurring trends.
Curated watchlists where NEARUSDT.P is featured.

Gen 3 crypto: A new day dawns…
25 No. of Symbols

Smart contracts: Make the smart decision
36 No. of Symbols
See all sparks