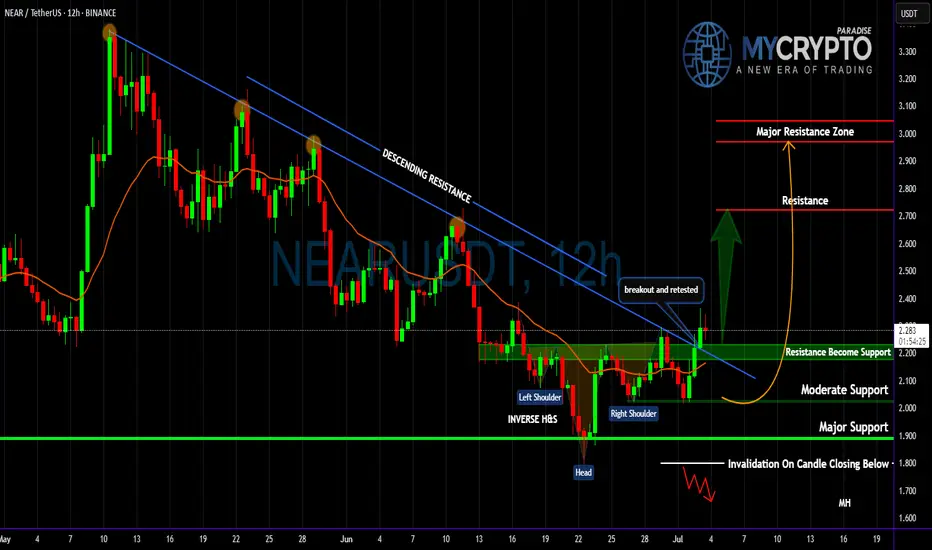
NEAR Breakout Confirmed—But Is This Just a Bull Trap?Yello Paradisers! Did you see that breakout on #NEARUSDT? After weeks of consistent lower highs and a clearly defined descending resistance, price action has finally snapped that bearish structure and completed a textbook inverse Head and Shoulders formation on the 12H chart. This kind of pattern do
TradeCityPro | NEAR Faces Resistance in Lower Range Zone👋 Welcome to TradeCity Pro!
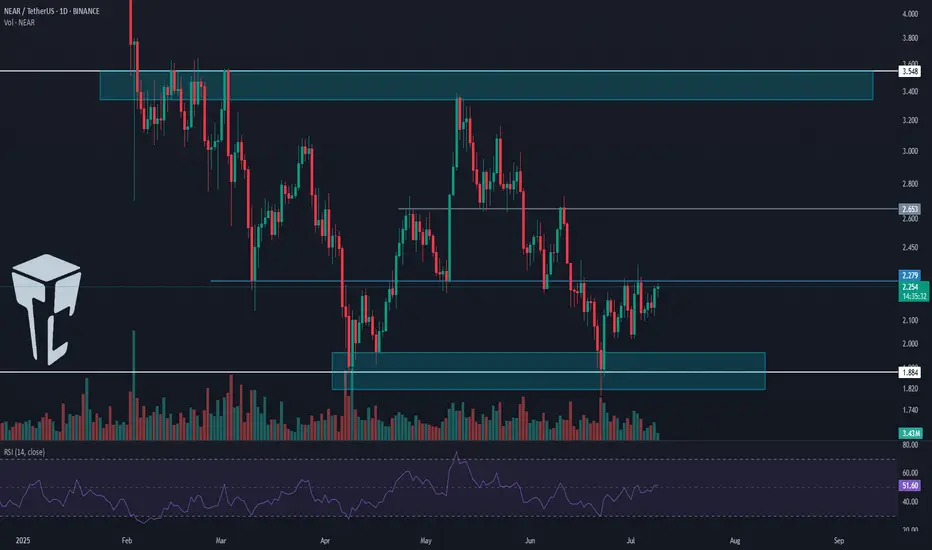
In this analysis, I’m going to review NEAR, one of the AI and Layer1 crypto projects, currently ranked 35 on CoinMarketCap with a market cap of 2.77 billion dollars.
📅 Daily Timeframe
On the daily chart, NEAR has formed a large ranging box between the 1.884 and 3.548 lev
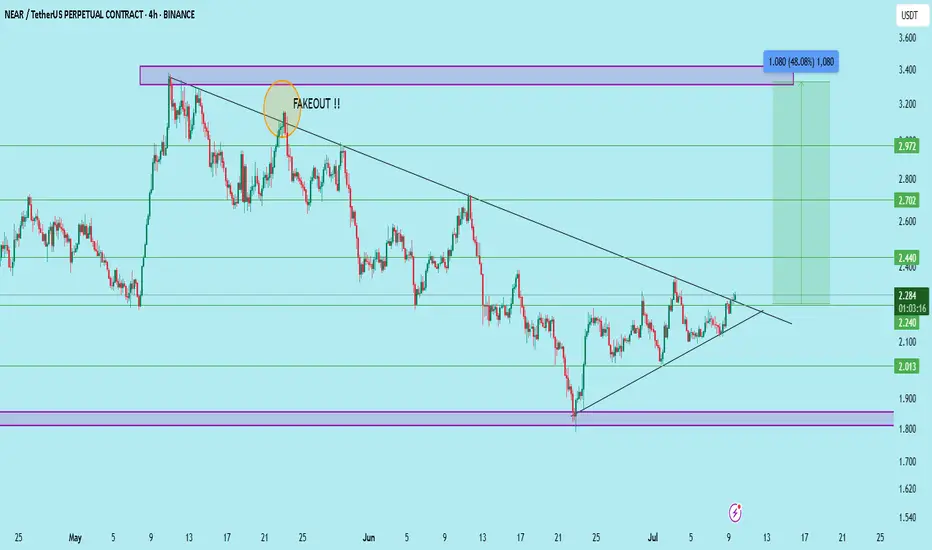
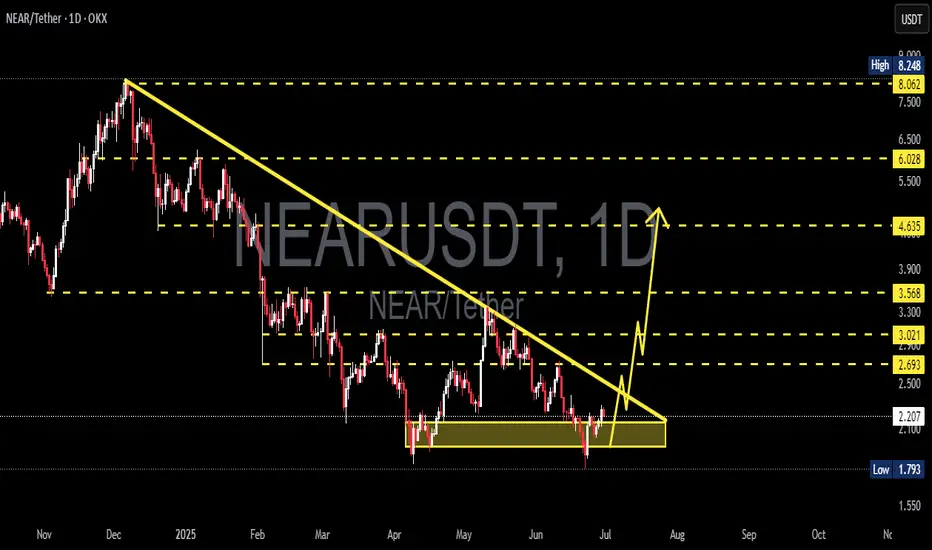
NEAR/USDT – Breakout in Progress? Watch This Zone CloselyNEAR is attempting to break out of a long-standing descending triangle. After a previous fakeout near the $2.70 zone, the price is again testing the upper trendline with strong momentum.
Chart Overview:
Price crossing the resistance of the descending structure.
Strong support held at $2.01 and $2.2
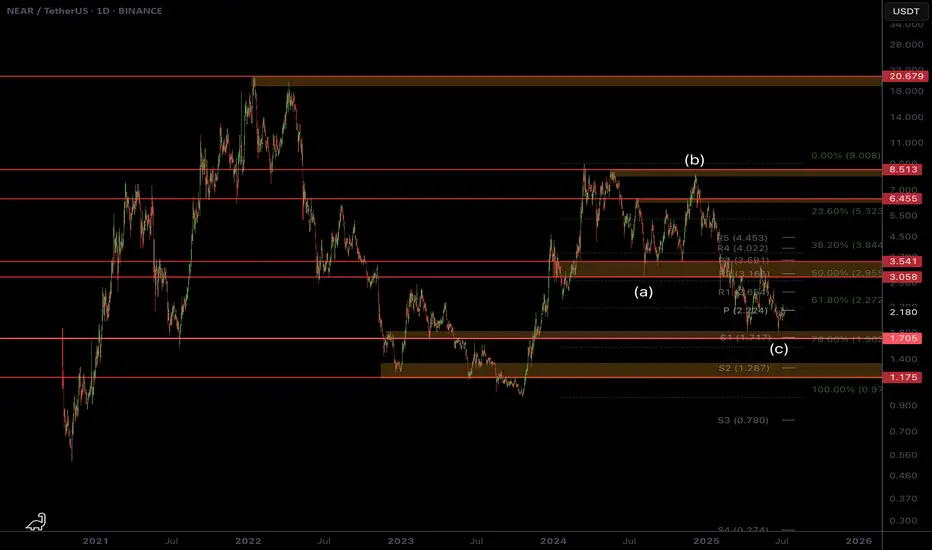
$NEAR Disappointing so far...CBOE:NEAR is disappointing me as it continues towards the lows
Testing the .786 alt-coin golden pocket High Volume Node so should see a decent reaction from here as it appears a an ABC correction is complete after an Elliot wave motif wave.
Safe trading
near chart analysisbreif discuss the chart of near upcoming potential might be pump from here heavliy
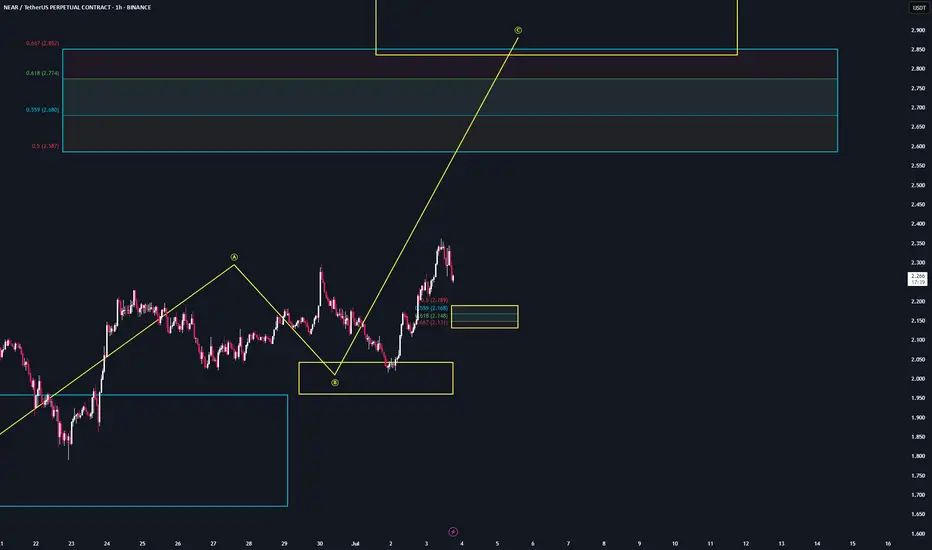
NEAR | Trade Setup📌 After the reaction from the bearish target zones (blue), we've now activated a bullish sequence (yellow) in $Near.
📊 Valid entries are currently forming during a potential B-C correction.
Trademanagement:
I'm placing long orders at each level.
Once the trade reaches a 2 R/R, I’ll move the stop-
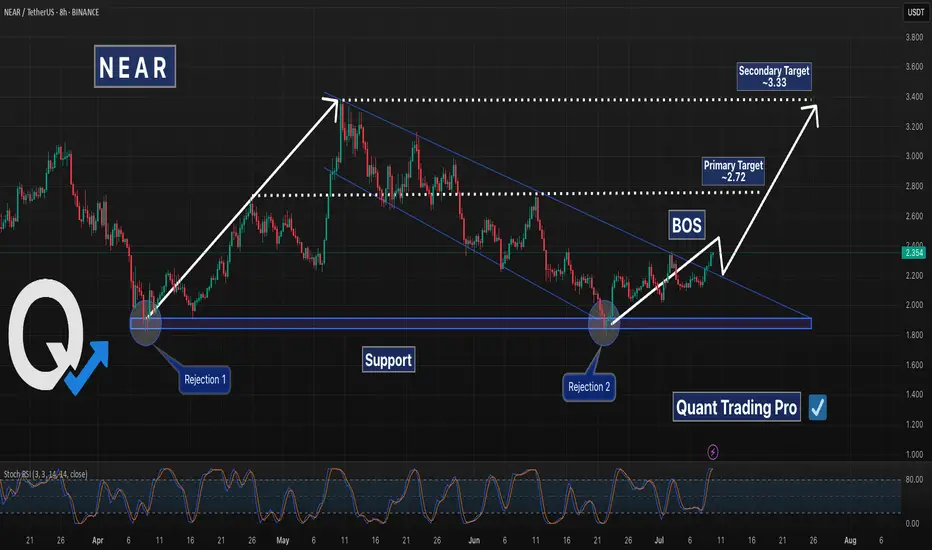
NEAR Breaks Downtrend – Bullish Momentum Targets $2.72 & $3.33NEAR/USDT just completed a clean Break of Structure (BOS) from a long-running descending channel — a move that could shift momentum and open up upside toward previous highs.
📊 Technical Highlights:
🔹 Double Rejection at Support: Price found strong demand at ~$1.80–$1.90, bouncing twice from the sa
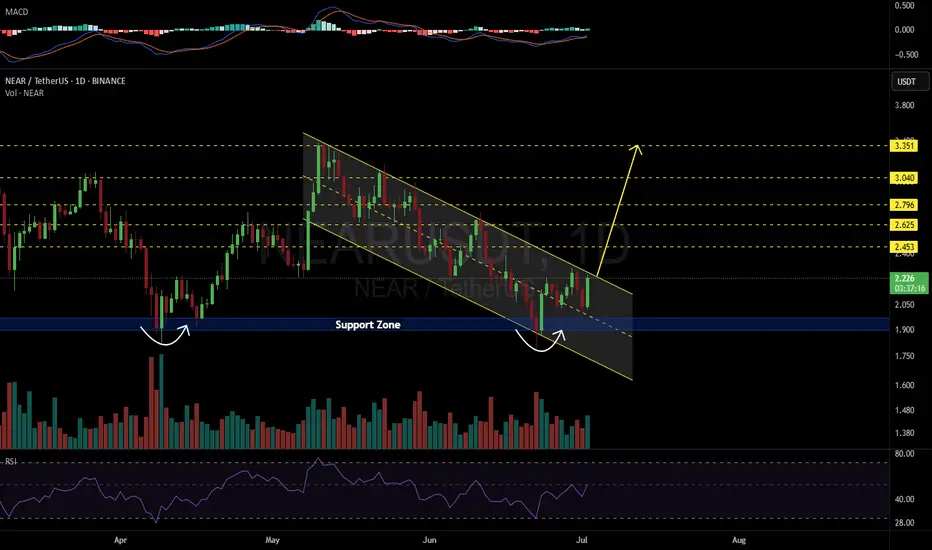
NEARUSDT 1D#NEAR is trading inside a descending channel on the daily chart and has recently bounced off a strong support zone.
It’s now on the verge of breaking above the channel resistance.
If a breakout occurs, the next targets are:
🎯 $2.453
🎯 $2.625
🎯 $2.796
🎯 $3.040
🎯 $3.351
⚠️ As always, use a tight st
$NEAR Approaching Breakout from 54D Trendline!CBOE:NEAR
In the LTF, CBOE:NEAR is sitting at the 0.5 Fib retracement level.
Which is a pretty good level to buy.
We have a 54D long descending trendline resistance, which we need to break out of.
IMO, we will break this trendline soon, so keep an eye on it.
We have strong support at the $1.

NEARUSDT Breakout Watch Descending Triangle Reversal in Progress🧠 Pattern and Structure Analysis
The NEAR/USDT pair is currently displaying a long-term Descending Triangle pattern that has been developing for over 6 months. While descending triangles are typically bearish continuation patterns, a breakout to the upside often signals a strong trend reversal.
De
See all ideas
Summarizing what the indicators are suggesting.
Oscillators
Neutral
SellBuy
Strong sellStrong buy
Strong sellSellNeutralBuyStrong buy
Oscillators
Neutral
SellBuy
Strong sellStrong buy
Strong sellSellNeutralBuyStrong buy
Summary
Neutral
SellBuy
Strong sellStrong buy
Strong sellSellNeutralBuyStrong buy
Summary
Neutral
SellBuy
Strong sellStrong buy
Strong sellSellNeutralBuyStrong buy
Summary
Neutral
SellBuy
Strong sellStrong buy
Strong sellSellNeutralBuyStrong buy
Moving Averages
Neutral
SellBuy
Strong sellStrong buy
Strong sellSellNeutralBuyStrong buy
Moving Averages
Neutral
SellBuy
Strong sellStrong buy
Strong sellSellNeutralBuyStrong buy
Displays a symbol's price movements over previous years to identify recurring trends.
Curated watchlists where NEARUSDT.P is featured.

Gen 3 crypto: A new day dawns…
25 No. of Symbols

Smart contracts: Make the smart decision
36 No. of Symbols
See all sparks